You are viewing a plain text version of this content. The canonical link for it is here.
Posted to notifications@apisix.apache.org by "yuqiquan (via GitHub)" <gi...@apache.org> on 2023/04/09 13:57:29 UTC
[GitHub] [apisix] yuqiquan commented on issue #9263: bug: apisix etcd https watch timeout issue
yuqiquan commented on issue #9263:
URL: https://github.com/apache/apisix/issues/9263#issuecomment-1501135092
1. 我的安装是用 RPM 方式的
2. 主要涉及部署了两个apisix实例, 可以叫他 apisix1 , apisix2
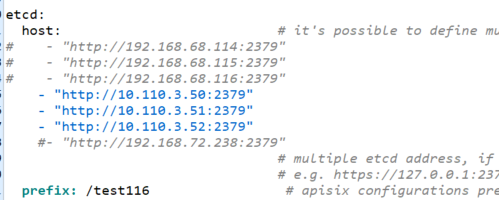
3. 在apisix1中创建一条路由,上游是一个etcd集群,然后保证http https 请求它都是正常的 (这个实例使用的etcd配置是这样的)
路由详情
```
{
"uri": "*",
"name": "etcd数据库",
"methods": [
"GET",
"POST",
"PUT",
"DELETE",
"PATCH",
"HEAD",
"OPTIONS",
"CONNECT",
"TRACE"
],
"host": "www.etcd.com",
"upstream": {
"nodes": [
{
"host": "10.110.3.50",
"port": 2379,
"weight": 1
},
{
"host": "10.110.3.51",
"port": 2379,
"weight": 1
},
{
"host": "10.110.3.52",
"port": 2379,
"weight": 1
}
],
"timeout": {
"connect": 120,
"send": 120,
"read": 120
},
"type": "roundrobin",
"scheme": "http",
"pass_host": "pass",
"keepalive_pool": {
"idle_timeout": 60000000,
"requests": 10000,
"size": 320
}
},
"status": 1
}
```
4. 在apisix2中我的etcd配置做了一些改变,想通过访问apisix1的 www.etcd.com 路由 来配置etcd集群, 所以 apisix2 etcd配置部分是这样的
```
etcd:
host:
- "https://www.etcd.com:443"
prefix: /test114 # apisix configurations prefix
timeout: 30 # 30 seconds
#resync_delay: 5 # when sync failed and a rest is needed, resync after the configured seconds plus 50% random jitter
health_check_timeout: 10 # etcd retry the unhealthy nodes after the configured seconds
health_check_retry: 2 # etcd retry time that only affects the health check, default 2
user: fwd # root username for etcd
password: fwd # root password for etcd
tls:
#cert: /usr/local/apisix/conf/server.crt
#key: /usr/local/apisix/conf/server.key
verify: false
sni: yuqiquan.made-in-china.com
```
同时我将 ssl 的 ssl_trusted_certificate 注释掉
https://user-images.githubusercontent.com/44921350/230589159-de2970ca-8a0d-4037-a2a5-b4798a2522e3.png
5. 启动apisix2 ,发现日志是正常的,同时 apisix1 的access.log中出现访问/v3/.... 的一些路径的路由,但是30秒以后,apisix1中就会出现很多这样日志
https://user-images.githubusercontent.com/44921350/230592860-b8cfcfd0-96fd-4236-9058-8aa58093afec.png
6. 日志内容是通过我的apisix2 配置的etcd ,apisix2 底层代码会访问 apisix1的 https://www.etcd.com:443/v3/watch的路由产生的
7. 在apisix2 启动以后,我尝试改变apisix2的路由数据信息,发现路由数据无法监听获取到改变, 然后我尝试将apisix2的etcd配置改为 http://www.etcd.com:80 发现监听是正常的
扒了下源码 发现在执行监听的时候
config_etcd.lua 中的
https://user-images.githubusercontent.com/44921350/230590927-621b15d4-3e4c-4043-b9e0-4f26f499f8fc.png
配置成https时 ,会返回nil,timeout ,而http的没有,不知道为什么, 就是请求etcd的监听 https的老是监听不到
--
This is an automated message from the Apache Git Service.
To respond to the message, please log on to GitHub and use the
URL above to go to the specific comment.
To unsubscribe, e-mail: notifications-unsubscribe@apisix.apache.org
For queries about this service, please contact Infrastructure at:
users@infra.apache.org