You are viewing a plain text version of this content. The canonical link for it is here.
Posted to dev@echarts.apache.org by GitBox <gi...@apache.org> on 2018/08/15 12:27:06 UTC
[GitHub] littlenawi opened a new issue #8875: onClick Bar Event
littlenawi opened a new issue #8875: onClick Bar Event
URL: https://github.com/apache/incubator-echarts/issues/8875
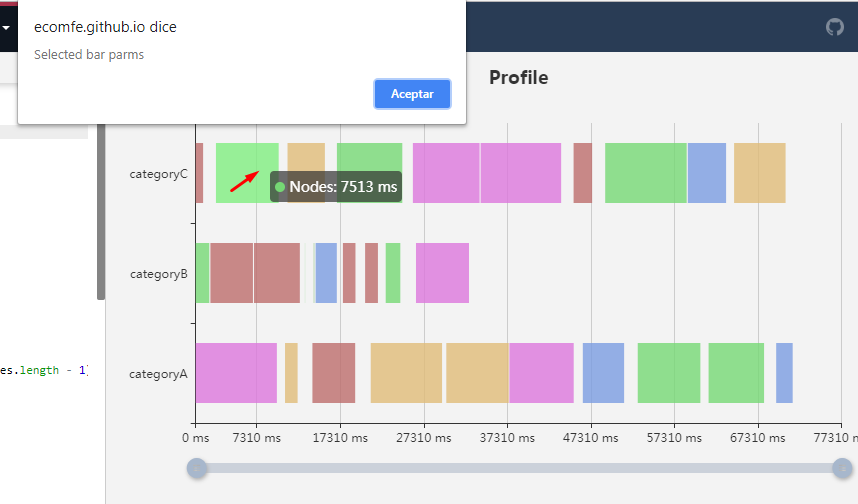
### One-line summary [问题简述]
I need to capture the click event when I select a bar.
I should be able to return the parameters of this bar.
Its posible ?
### Version & Environment [版本及环境]
+ ECharts version [ECharts 版本]:v4.1.0.rc2
+ Browser version [浏览器类型和版本]:chrome 68.0.3440.106 x64
+ OS Version [操作系统类型和版本]:window10 x64
### Expected behaviour [期望结果]
### ECharts option [ECharts配置项]
var data = [];
var dataCount = 10;
var startTime = +new Date();
var categories = ['categoryA', 'categoryB', 'categoryC'];
var types = [
{name: 'JS Heap', color: '#7b9ce1'},
{name: 'Documents', color: '#bd6d6c'},
{name: 'Nodes', color: '#75d874'},
{name: 'Listeners', color: '#e0bc78'},
{name: 'GPU Memory', color: '#dc77dc'},
{name: 'GPU', color: '#72b362'}
];
// Generate mock data
echarts.util.each(categories, function (category, index) {
var baseTime = startTime;
for (var i = 0; i < dataCount; i++) {
var typeItem = types[Math.round(Math.random() * (types.length - 1))];
var duration = Math.round(Math.random() * 10000);
data.push({
name: typeItem.name,
value: [
index,
baseTime,
baseTime += duration,
duration
],
itemStyle: {
normal: {
color: typeItem.color
}
}
});
baseTime += Math.round(Math.random() * 2000);
}
});
function renderItem(params, api) {
var categoryIndex = api.value(0);
var start = api.coord([api.value(1), categoryIndex]);
var end = api.coord([api.value(2), categoryIndex]);
var height = api.size([0, 1])[1] * 0.6;
return {
type: 'rect',
shape: echarts.graphic.clipRectByRect({
x: start[0],
y: start[1] - height / 2,
width: end[0] - start[0],
height: height
}, {
x: params.coordSys.x,
y: params.coordSys.y,
width: params.coordSys.width,
height: params.coordSys.height
}),
style: api.style()
};
}
option = {
tooltip: {
formatter: function (params) {
return params.marker + params.name + ': ' + params.value[3] + ' ms';
}
},
title: {
text: 'Profile',
left: 'center'
},
dataZoom: [{
type: 'slider',
filterMode: 'weakFilter',
showDataShadow: false,
top: 400,
height: 10,
borderColor: 'transparent',
backgroundColor: '#e2e2e2',
handleIcon: 'M10.7,11.9H9.3c-4.9,0.3-8.8,4.4-8.8,9.4c0,5,3.9,9.1,8.8,9.4h1.3c4.9-0.3,8.8-4.4,8.8-9.4C19.5,16.3,15.6,12.2,10.7,11.9z M13.3,24.4H6.7v-1.2h6.6z M13.3,22H6.7v-1.2h6.6z M13.3,19.6H6.7v-1.2h6.6z', // jshint ignore:line
handleSize: 20,
handleStyle: {
shadowBlur: 6,
shadowOffsetX: 1,
shadowOffsetY: 2,
shadowColor: '#aaa'
},
labelFormatter: ''
}, {
type: 'inside',
filterMode: 'weakFilter'
}],
grid: {
height:300
},
xAxis: {
min: startTime,
scale: true,
axisLabel: {
formatter: function (val) {
return Math.max(0, val - startTime) + ' ms';
}
}
},
yAxis: {
data: categories
},
series: [{
type: 'custom',
renderItem: renderItem,
itemStyle: {
normal: {
opacity: 0.8
}
},
encode: {
x: [1, 2],
y: 0
},
data: data
}]
};
### Other comments [其他信息]
https://ecomfe.github.io/echarts-examples/public/editor.html?c=custom-profile
----------------------------------------------------------------
This is an automated message from the Apache Git Service.
To respond to the message, please log on GitHub and use the
URL above to go to the specific comment.
For queries about this service, please contact Infrastructure at:
users@infra.apache.org
With regards,
Apache Git Services
---------------------------------------------------------------------
To unsubscribe, e-mail: dev-unsubscribe@echarts.apache.org
For additional commands, e-mail: dev-help@echarts.apache.org