You are viewing a plain text version of this content. The canonical link for it is here.
Posted to commits@echarts.apache.org by GitBox <gi...@apache.org> on 2022/01/26 14:48:12 UTC
[GitHub] [echarts] jainsuneet opened a new issue #16437: Need a way to set custom axisLabel & axisTick for Gauge charts [Feature]
jainsuneet opened a new issue #16437:
URL: https://github.com/apache/echarts/issues/16437
### What problem does this feature solve?
Currently the Gauge chart from Echarts only allow to configure splitNumber but I need a way to only show certain axisLabels and axisTicks like the example below, I tried to use formatter in axisLabel but I can only filter the labels not limit the ticks.
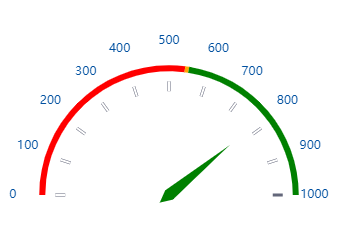
### What does the proposed API look like?
I need a way to only show certain axisLabels and axisTicks

--
This is an automated message from the Apache Git Service.
To respond to the message, please log on to GitHub and use the
URL above to go to the specific comment.
To unsubscribe, e-mail: commits-unsubscribe@echarts.apache.org
For queries about this service, please contact Infrastructure at:
users@infra.apache.org
---------------------------------------------------------------------
To unsubscribe, e-mail: commits-unsubscribe@echarts.apache.org
For additional commands, e-mail: commits-help@echarts.apache.org
[GitHub] [echarts] jainsuneet commented on issue #16437: Need a way to set custom axisLabel & axisTick for Gauge charts [Feature]
Posted by GitBox <gi...@apache.org>.
jainsuneet commented on issue #16437:
URL: https://github.com/apache/echarts/issues/16437#issuecomment-1022980015


   > Looks like this example? https://echarts.apache.org/examples/zh/editor.html?c=gauge-grade

   @Ovilia In this example formatter is used on axisLabel to manually filter the labels but then the axisTick are still fully shown based upon the splitNumber. I need a way to limit both.


--
This is an automated message from the Apache Git Service.
To respond to the message, please log on to GitHub and use the
URL above to go to the specific comment.

To unsubscribe, e-mail: commits-unsubscribe@echarts.apache.org

For queries about this service, please contact Infrastructure at:
users@infra.apache.org


---------------------------------------------------------------------
To unsubscribe, e-mail: commits-unsubscribe@echarts.apache.org
For additional commands, e-mail: commits-help@echarts.apache.org
[GitHub] [echarts] Ovilia commented on issue #16437: Need a way to set custom axisLabel & axisTick for Gauge charts [Feature]
Posted by GitBox <gi...@apache.org>.
Ovilia commented on issue #16437:
URL: https://github.com/apache/echarts/issues/16437#issuecomment-1022855843


   Looks like this example? https://echarts.apache.org/examples/zh/editor.html?c=gauge-grade


--
This is an automated message from the Apache Git Service.
To respond to the message, please log on to GitHub and use the
URL above to go to the specific comment.

To unsubscribe, e-mail: commits-unsubscribe@echarts.apache.org

For queries about this service, please contact Infrastructure at:
users@infra.apache.org


---------------------------------------------------------------------
To unsubscribe, e-mail: commits-unsubscribe@echarts.apache.org
For additional commands, e-mail: commits-help@echarts.apache.org