You are viewing a plain text version of this content. The canonical link for it is here.
Posted to reviews@iotdb.apache.org by GitBox <gi...@apache.org> on 2022/04/19 04:01:36 UTC
[GitHub] [iotdb] SpriCoder commented on a diff in pull request #5587: [IOTDB-2873]add Apache IoTDB Dashboard grafana template for master
SpriCoder commented on code in PR #5587:
URL: https://github.com/apache/iotdb/pull/5587#discussion_r852573598
##########
docs/UserGuide/Maintenance-Tools/Metric-Tool.md:
##########
@@ -328,8 +328,11 @@ The following documents may help you have a good journey with Prometheus and Gra
[Grafana query metrics from Prometheus](https://prometheus.io/docs/visualization/grafana/#grafana-support-for-prometheus)
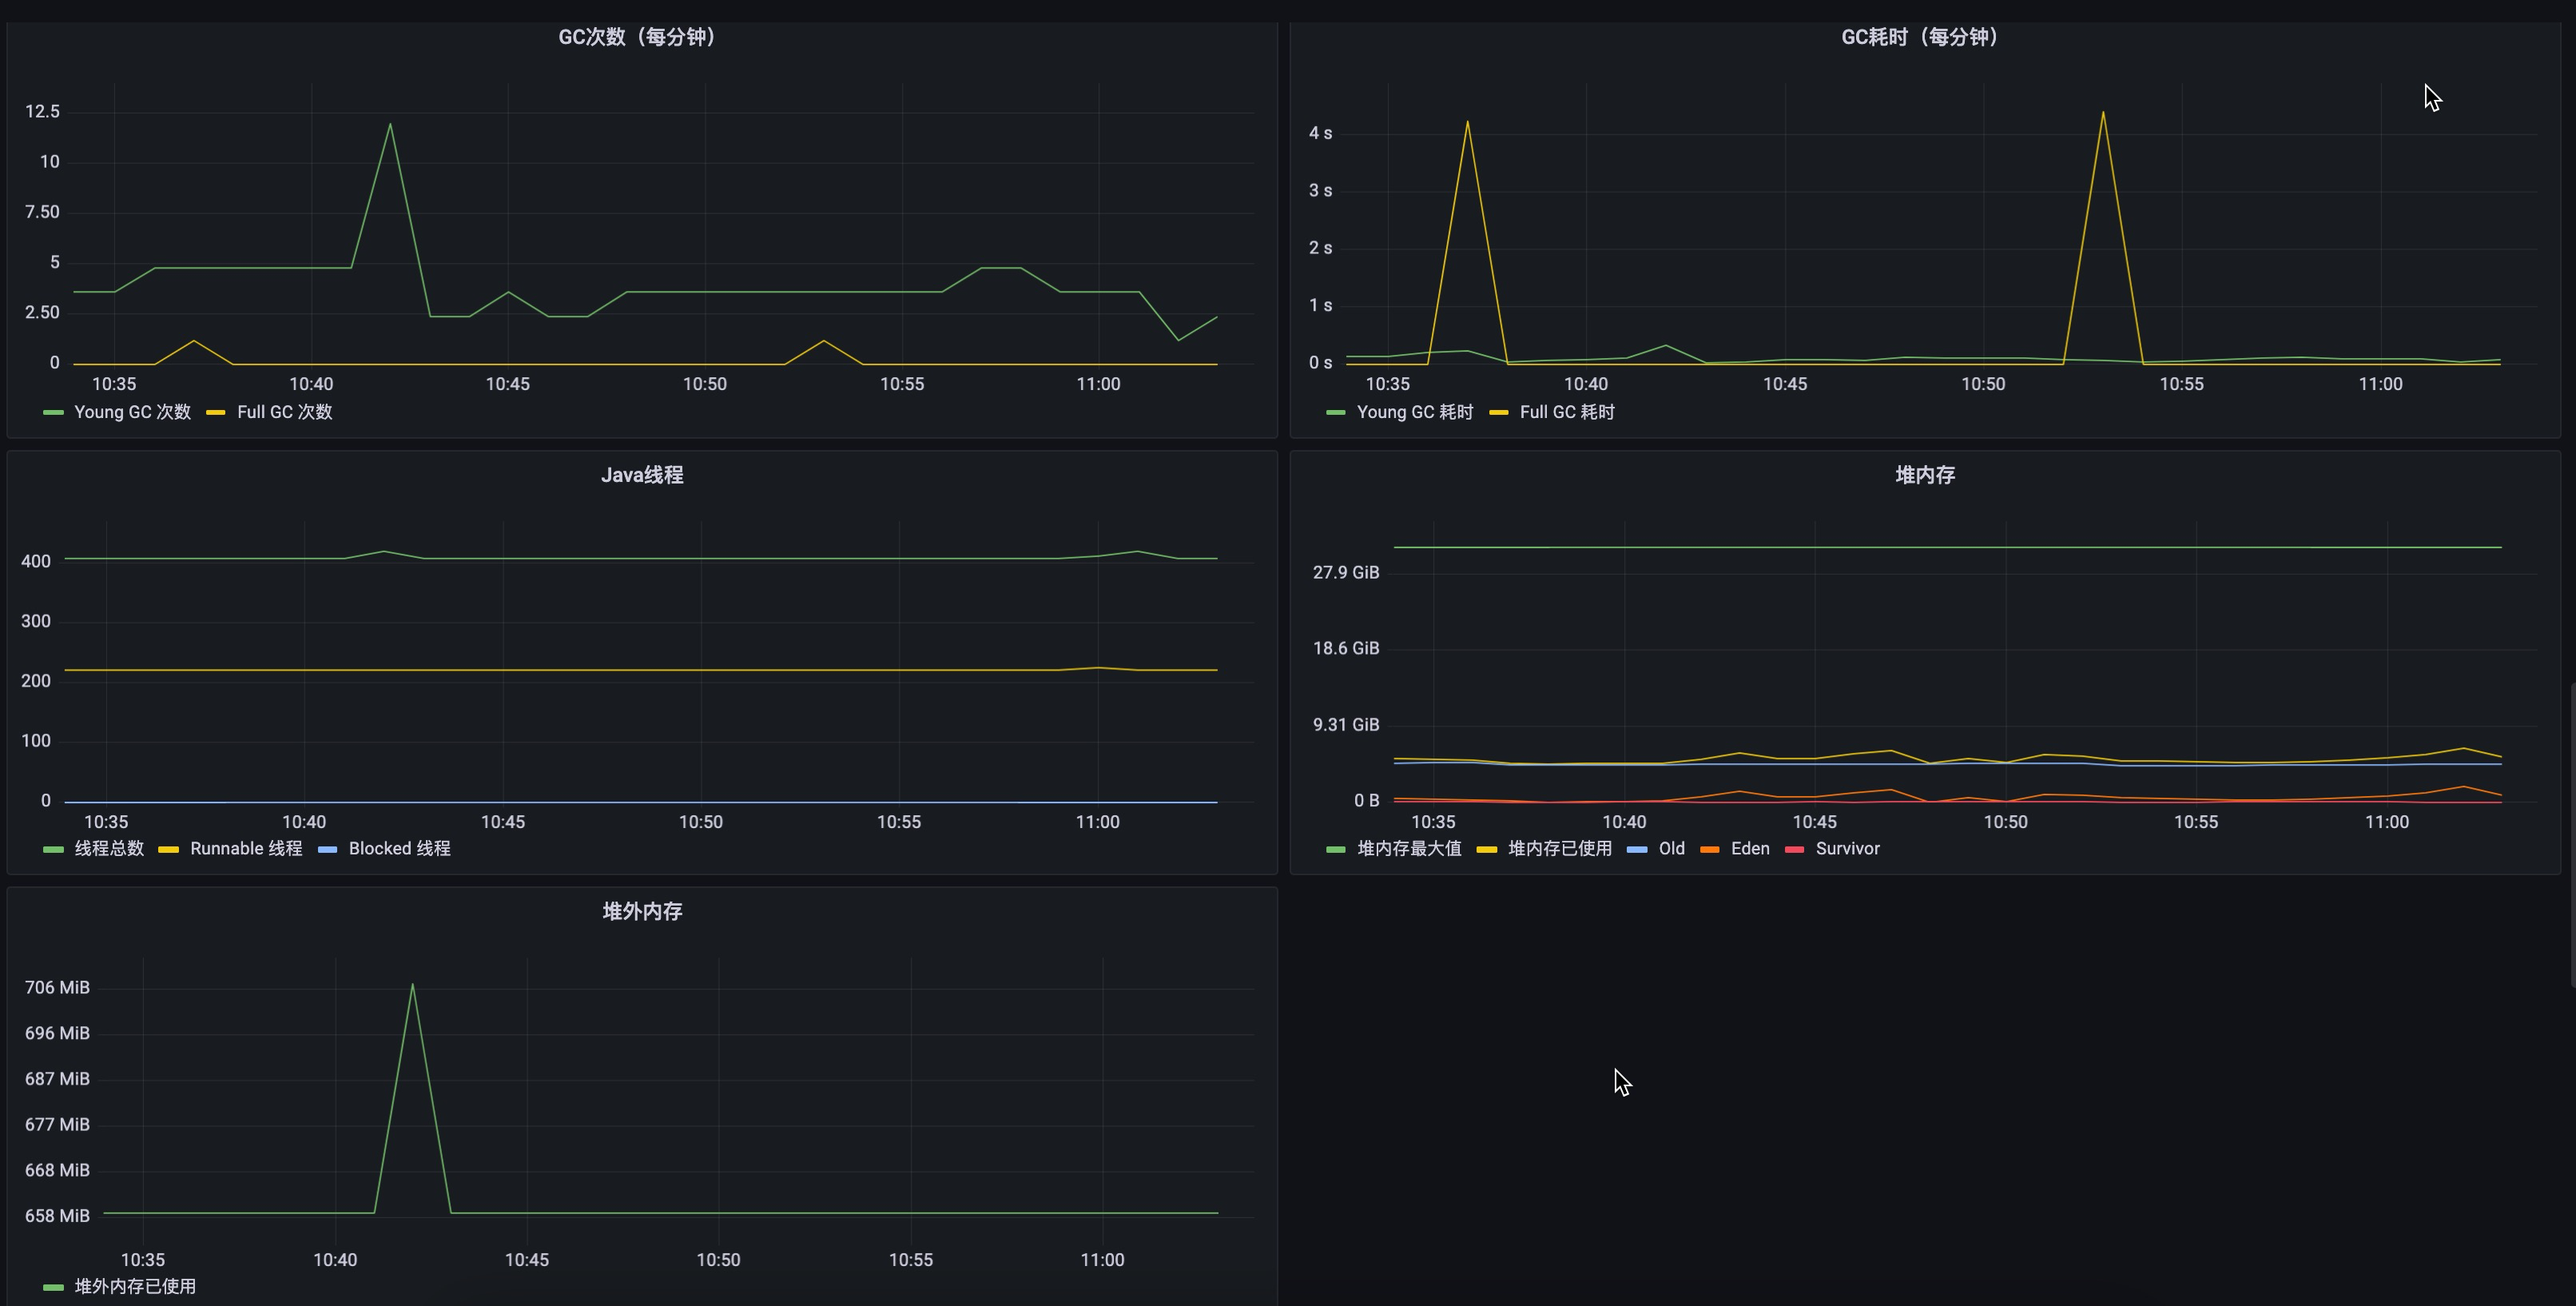
-Here are two demo pictures of IoTDB's metrics data in Grafana.
+### 5.3. Apache IoTDB Dashboard
+We provide the Apache IoTDB Dashboard, and the rendering shown in Grafana is as follows:
-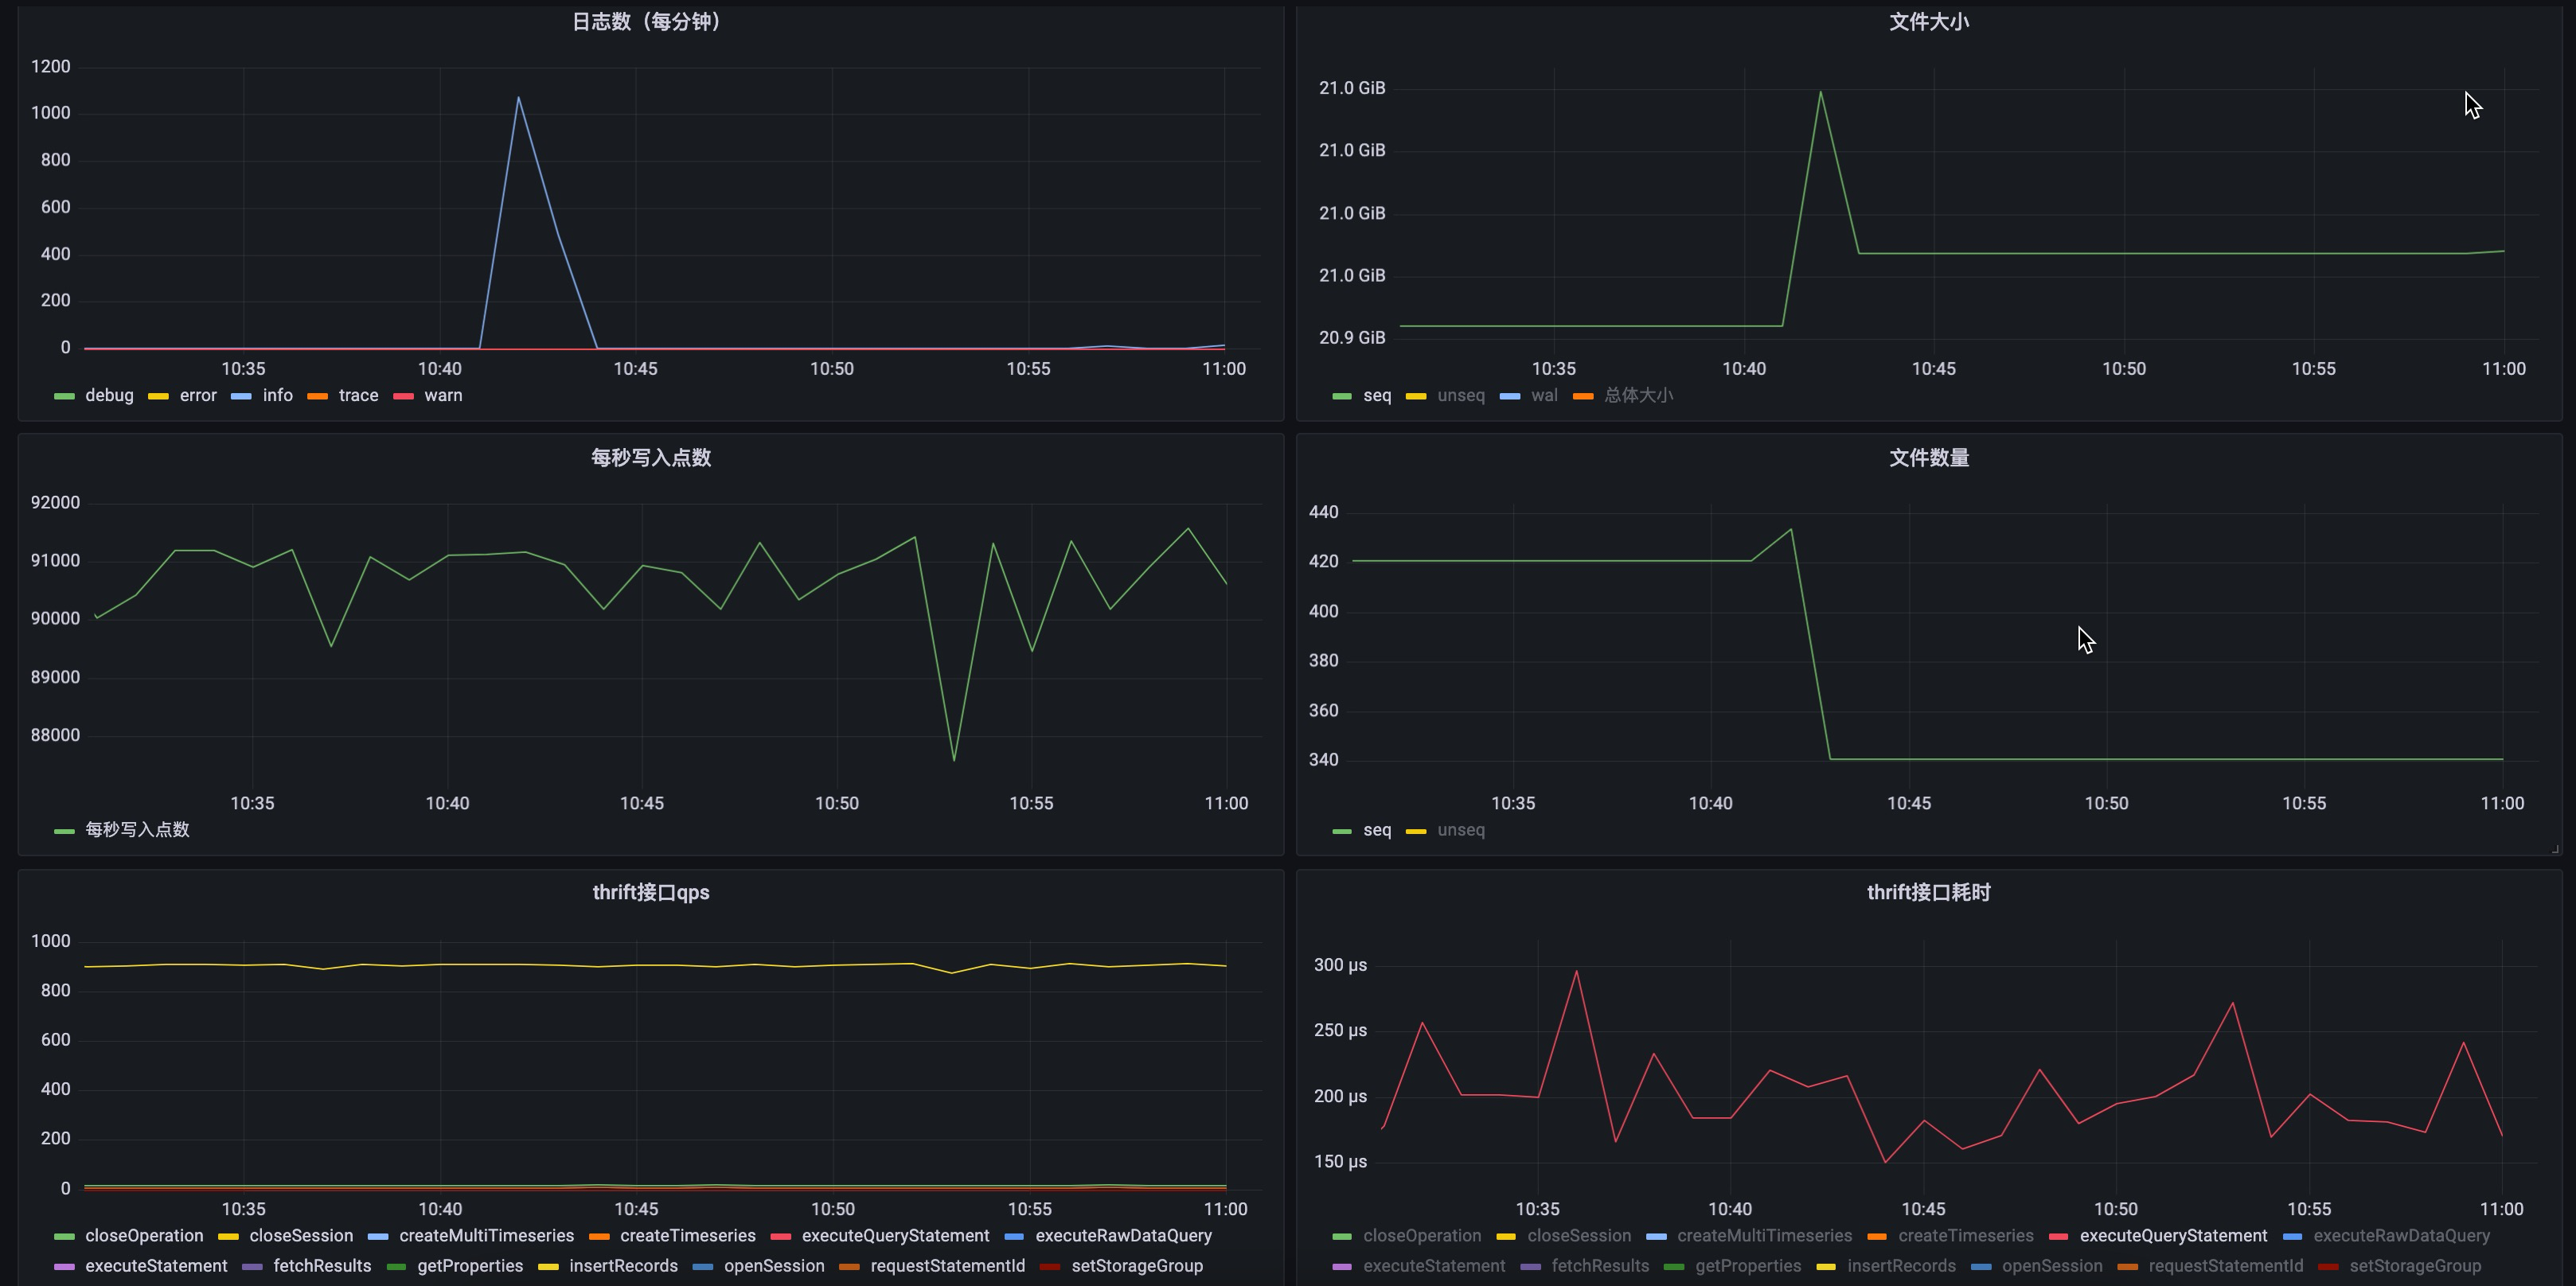
+
-
\ No newline at end of file
+You can obtain the json files of Dashboards corresponding to different iotdb versions in the grafana-metrics-example folder.
Review Comment:
Ok, I will check. Thanks for your suggestion.
--
This is an automated message from the Apache Git Service.
To respond to the message, please log on to GitHub and use the
URL above to go to the specific comment.
To unsubscribe, e-mail: reviews-unsubscribe@iotdb.apache.org
For queries about this service, please contact Infrastructure at:
users@infra.apache.org