You are viewing a plain text version of this content. The canonical link for it is here.
Posted to notifications@skywalking.apache.org by ha...@apache.org on 2024/08/22 03:31:45 UTC
(skywalking-banyandb) 01/01: Enable native ob to classic test
This is an automated email from the ASF dual-hosted git repository.
hanahmily pushed a commit to branch metrics
in repository https://gitbox.apache.org/repos/asf/skywalking-banyandb.git
commit a1bc1f3e299d61b1b9712e1fb0469cbcc0ec615a
Author: Gao Hongtao <ha...@gmail.com>
AuthorDate: Thu Aug 22 11:04:09 2024 +0800
Enable native ob to classic test
Signed-off-by: Gao Hongtao <ha...@gmail.com>
---
docs/menu.yml | 2 +-
docs/{ => operation}/observability.md | 8 ++++----
test/stress/classic/docker-compose.yaml | 2 ++
3 files changed, 7 insertions(+), 5 deletions(-)
diff --git a/docs/menu.yml b/docs/menu.yml
index cfb0b057..6417d17a 100644
--- a/docs/menu.yml
+++ b/docs/menu.yml
@@ -110,7 +110,7 @@ catalog:
- name: "Rollback"
path: ""
- name: "Observability"
- path: "/observability"
+ path: "/operation/observability"
- name: "Cluster Management"
path: "/operation/cluster"
- name: "Security"
diff --git a/docs/observability.md b/docs/operation/observability.md
similarity index 95%
rename from docs/observability.md
rename to docs/operation/observability.md
index 9f339aaf..0b9c9455 100644
--- a/docs/observability.md
+++ b/docs/operation/observability.md
@@ -4,7 +4,7 @@ This document outlines the observability features of BanyanDB, which include met
## Metrics
-BanyanDB has built-in support for metrics collection. Currently, there are two supported metrics provider: `prometheus` and `native`. These can be enabled through `observability-modes` flag, allowing you to activate one or both of them.
+BanyanDB has built-in support for metrics collection. Currently, there are two supported metrics provider: `prometheus` and `native`. These can be enabled through `observability-modes` flag, allowing you to activate one or both of them.
### Prometheus
@@ -12,14 +12,13 @@ Prometheus is auto enabled at run time, if no flag is passed or if `promethus` i
When the Prometheus metrics provider is enabled, the metrics server listens on port `2121`. This allows Prometheus to scrape metrics data from BanyanDB for monitoring and analysis.
-
-### Self-observability
+### Self-observability
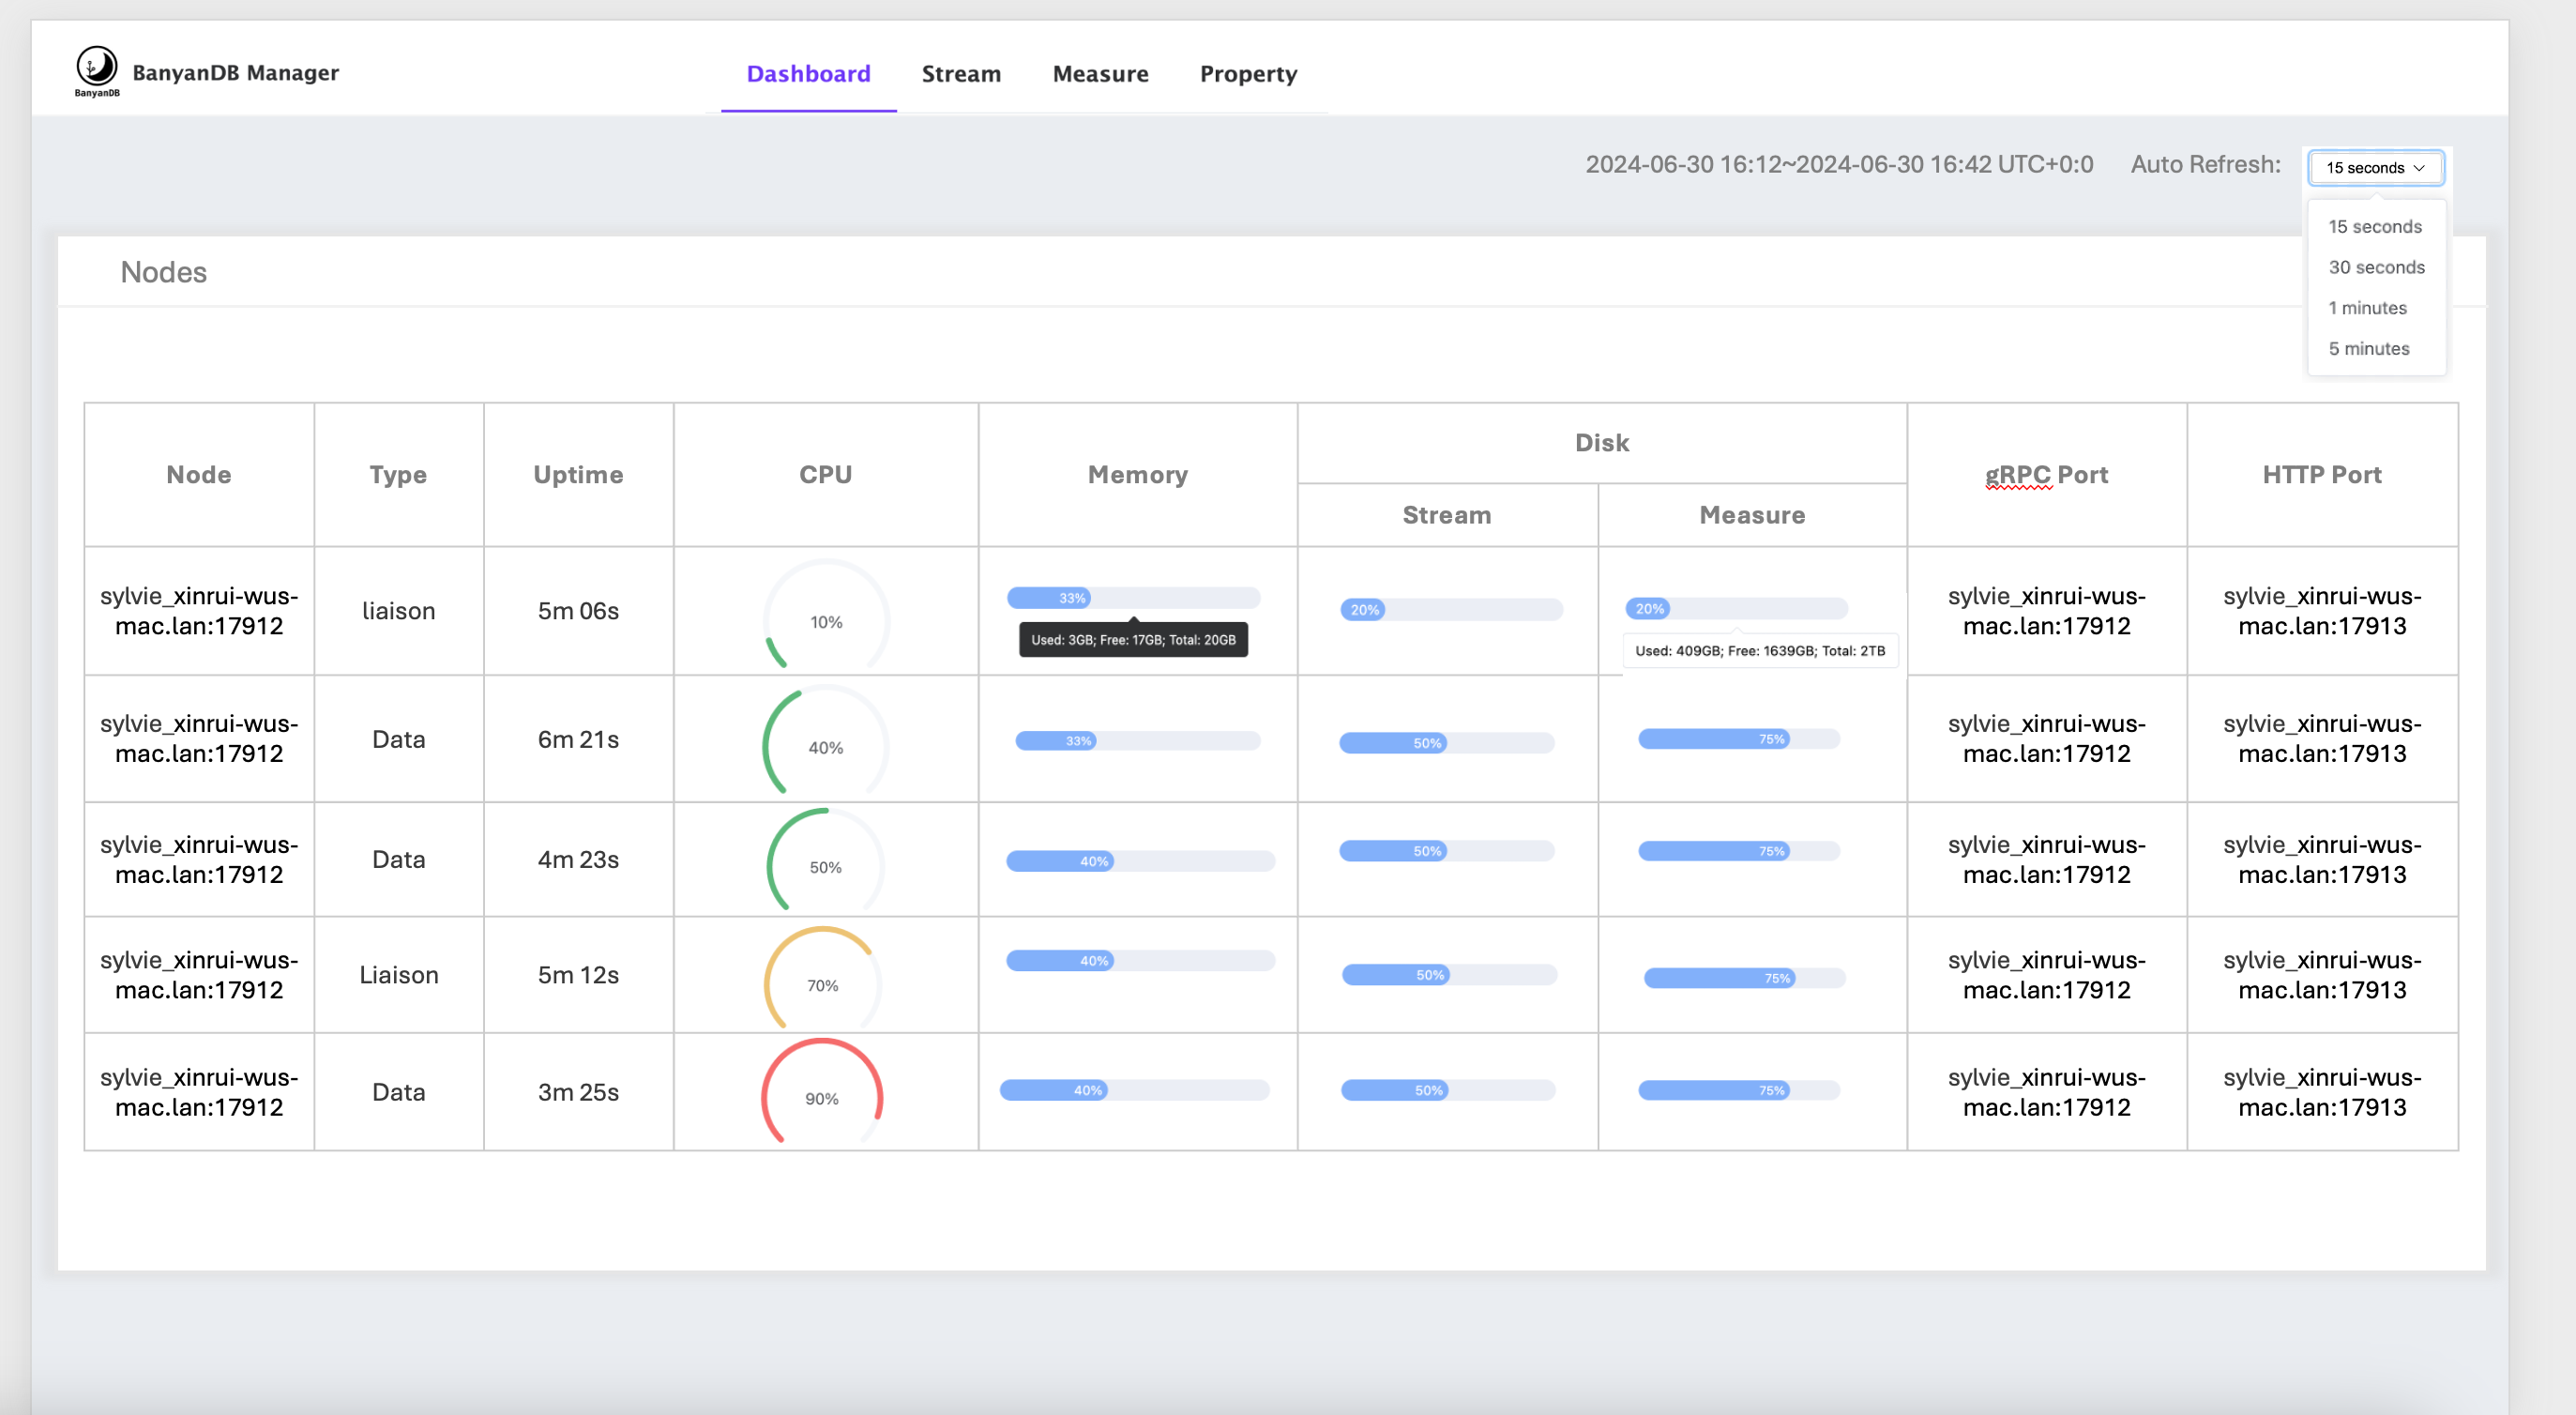
If the `observability-modes` flag is set to `native`, the self-observability metrics provider will be enabled. The some of metrics will be displayed in the dashboard of [banyandb-ui](http://localhost:17913/)
-#### Metrics storage
+#### Metrics storage
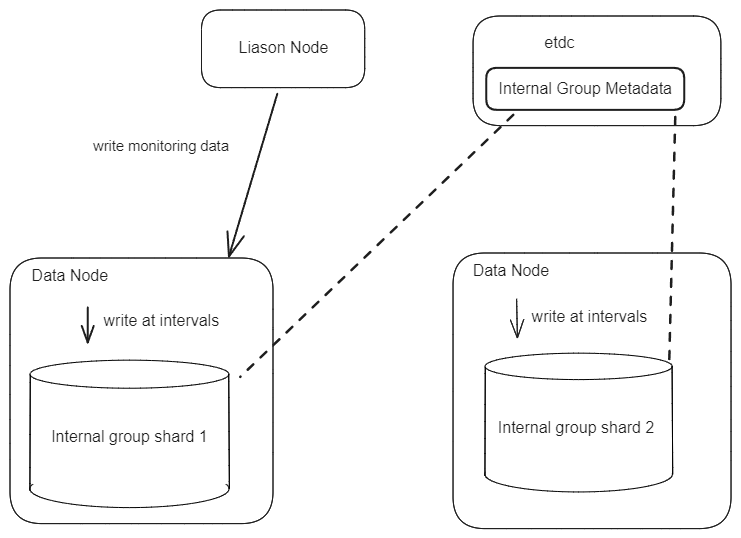
In self-observability, the metrics data is stored in BanyanDB within the ` _monitoring` internal group. Each metric will be created as a new `measure` within this group.
@@ -32,6 +31,7 @@ When starting any node, the `_monitoring` internal group will be created, and th
#### Read Flow
+
The read flow is the same as reading data from `measure`, with each metric being a new measure.
## Profiling
diff --git a/test/stress/classic/docker-compose.yaml b/test/stress/classic/docker-compose.yaml
index 76a518a9..23c0469f 100644
--- a/test/stress/classic/docker-compose.yaml
+++ b/test/stress/classic/docker-compose.yaml
@@ -27,6 +27,8 @@ services:
extends:
file: ../../docker/base-compose.yml
service: banyandb
+ environment:
+ BYDB_OBSERVABILITY_MODES: "prometheus,native"
build:
dockerfile: ./docker/Dockerfile
context: ../../..