You are viewing a plain text version of this content. The canonical link for it is here.
Posted to dev@echarts.apache.org by GitBox <gi...@apache.org> on 2019/06/12 06:55:57 UTC
[GitHub] [incubator-echarts] nongzhenli edited a comment on issue #9044: 这个loop实现真的奇怪,搞了好几天了,还是有问题,例如在使用setOption更新图数据时,加入数据前后相同,这种实现effect居然不会重绘,就算数据不完全相同,那些相同的数据也不会重绘,个人认为在刷新数据之后,即使数据相同,effect配置一样,也应该重绘吧。谁能解答这个问题,用了最新的版本了,里面设置了loop,但还是没有解决,二次加载数据的时候还是不会重绘,希望再这里得到各位的帮助!!!
nongzhenli edited a comment on issue #9044: 这个loop实现真的奇怪,搞了好几天了,还是有问题,例如在使用setOption更新图数据时,加入数据前后相同,这种实现effect居然不会重绘,就算数据不完全相同,那些相同的数据也不会重绘,个人认为在刷新数据之后,即使数据相同,effect配置一样,也应该重绘吧。谁能解答这个问题,用了最新的版本了,里面设置了loop,但还是没有解决,二次加载数据的时候还是不会重绘,希望再这里得到各位的帮助!!!
URL: https://github.com/apache/incubator-echarts/issues/9044#issuecomment-501140022
> 轨迹可以用没有特效动画的 lines 系列绘制
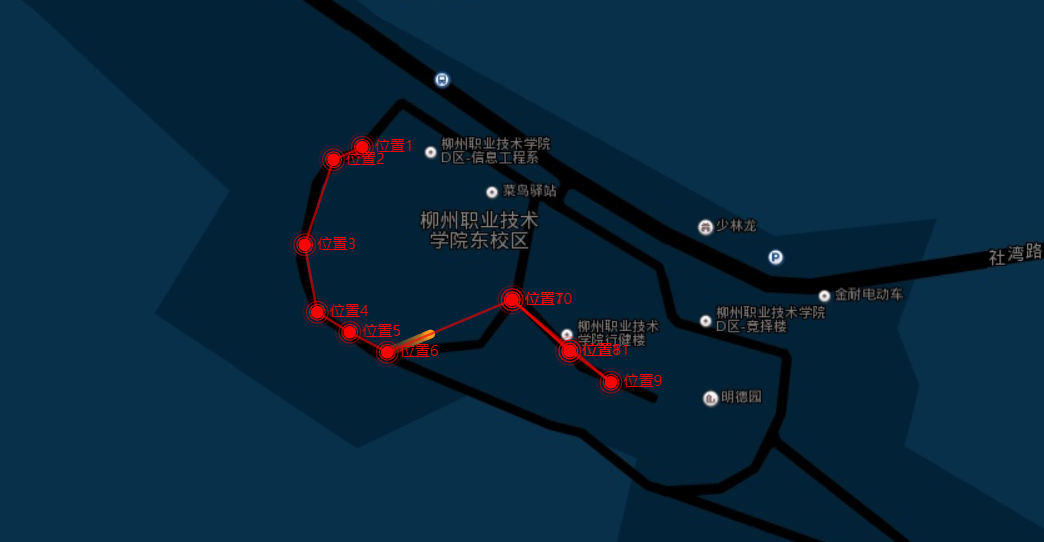
你好,我目前使用 Lines + bmap 依照最标点描绘轨迹!为了保证轨迹的 `effect` 点的始终仅在一条线上划动,将loop关闭了!并且使用 setOption()动画更新图表!
但是有个问题:
> 我每次更新图表setOption() 时,lines画出来的轨迹线段就会闪烁一下(应该是重绘或者什么原因),但是 坐标点 `effectScatter` 和 `effect` (就是出现trailLength 拖影短暂消失这个问题不大)并没有影响。
================
请问这个是什么原因呢?
代码如下:
<pre><code>
// ###### echart 配置项 ##########
chartSeries: [{
// 参考Echart地址:https://echarts.baidu.com/option.html#series-scatter.coordinateSystem
type: "effectScatter",
coordinateSystem: "bmap",
// 参考Echart地址:https://echarts.baidu.com/option.html#series-effectScatter.encode
// 设置 data中item的维度
encode: {
// 这里表示设置:data[item].value[2]为数值
value: 2
},
zlevel: 2,
// 参照Echart地址:https://echarts.baidu.com/option.html#series-effectScatter.zlevel
// 关闭动画,解决了百度地图拖动时,图表描点跟随拖动的问题
animation: false,
rippleEffect: {
brushType: 'stroke'
},
label: {
normal: {
show: true,
position: 'right',
formatter: '{b}'
}
},
// 点大小
symbolSize: function(val) {
// return val[2] / 2;
// 直接设定 30
return 10
},
showEffectOn: 'render',
itemStyle: {
normal: {
color: "red"
}
},
// DATA
data: [],
},
// 轨迹-线条
{
type: 'lines',
coordinateSystem: 'bmap',
zlevel: 2,
symbol: ['none', 'none'],
symbolSize: 10,
animation: false,
effect: {
show: false,
},
lineStyle: {
normal: {
color: "red",
width: 2,
opacity: 0.6,
curveness: 0,
// 设置线条曲度 0~1
}
},
markLine: {
data: []
},
data: [],
},
// 轨迹-高斯模糊底部拖影
{
type: 'lines',
coordinateSystem: 'bmap',
zlevel: 1,
animation: false,
effect: {
show: true,
period: 1,
trailLength: 0.1,
color: '#ffa022',
symbolSize: 7,
delay: function(idx) {
return idx * 1000
},
loop: true,
},
lineStyle: {
normal: {
color: "#ffa022",
width: 0,
curveness: 0,
}
},
data: [],
},
],
// ##### data数据、执行动画修改setOption() ##########
async getLocusData() {
let routeQuery = this.$route.query,
params = {
number: routeQuery.number,
name: routeQuery.name,
dbName: routeQuery.dbName,
startTime: routeQuery.startTime,
endTime: routeQuery.endTime,
};
const res = await getLocus(params);
if (res.data.length > 0) {
this.geoCoordMap = res.data || []
// 坐标
this.chartSeries[0].data = this.circleData
// 线条
this.chartSeries[1].data = this.convertLinesData
// 拷贝副本数据
// this.convertLinesCopyData = JSON.parse(JSON.stringify(this.convertLinesData))
// this.chartSeries[2].data = this.convertLinesCopyData
await this.forEachUpEchart()
// }
},
// 定时更新
forEachUpEchart(nextDelay) {
let _data = [],
_nextData = [],
_index = 0;
if (this.convertLinesCopyData.length === 0) {
this.convertLinesCopyData = JSON.parse(JSON.stringify(this.convertLinesData))
}
// 计算差,方便定位index索引值
_index = this.circleData.length - this.convertLinesCopyData.length;
_data = this.circleData[_index - 1];
_nextData = this.circleData[_index];
this.chartSeries[2].data = [this.convertLinesCopyData.shift()] this.chartSeries[2].effect.period = _data.period;
this.chartSeries[2].effect.delay = 0;
// this.echartsMap.clear();
this.echartsMap.setOption(this.chartSeries[2])
// 每次都要进行一次清除定时器
clearInterval(this.UpEchartIntervalObj) this.UpEchartIntervalObj = setInterval(() = >{
this.forEachUpEchart()
},
_nextData.delay + 100)
},
</code></pre>
> 效果图如下
----------------------------------------------------------------
This is an automated message from the Apache Git Service.
To respond to the message, please log on to GitHub and use the
URL above to go to the specific comment.
For queries about this service, please contact Infrastructure at:
users@infra.apache.org
With regards,
Apache Git Services
---------------------------------------------------------------------
To unsubscribe, e-mail: dev-unsubscribe@echarts.apache.org
For additional commands, e-mail: dev-help@echarts.apache.org