You are viewing a plain text version of this content. The canonical link for it is here.
Posted to dev@jena.apache.org by GitBox <gi...@apache.org> on 2019/02/19 16:28:29 UTC
[GitHub] seaninryan opened a new pull request #534: [WIP] Proof of concept
for prometheus endpoint
seaninryan opened a new pull request #534: [WIP] Proof of concept for prometheus endpoint
URL: https://github.com/apache/jena/pull/534
I've put together a new servlet to try and expose some of the existing stats (i.e. what's exposed by `http://<host>:3030/$/stats/<dataset>`) in a format consumable by prometheus.
With this change we'd see the metrics at `http://<host>:3030/$/prometheus` and they would look like this:
```
fuseki_requests_bad{operation="GSP_RW", description="Graph Store Protocol", dataset="/Argon", endpoint="data"} 0
fuseki_requests{operation="GSP_RW", description="Graph Store Protocol", dataset="/Argon", endpoint="data"} 1315
fuseki_requests_good{operation="GSP_RW", description="Graph Store Protocol", dataset="/Argon", endpoint="data"} 1315
fuseki_requests_bad{operation="Quads_RW", description="HTTP Quads", dataset="/Argon", endpoint=""} 0
fuseki_requests{operation="Quads_RW", description="HTTP Quads", dataset="/Argon", endpoint=""} 0
fuseki_requests_good{operation="Quads_RW", description="HTTP Quads", dataset="/Argon", endpoint=""} 0
fuseki_requests_bad{operation="Upload", description="File Upload", dataset="/Argon", endpoint="upload"} 0
fuseki_requests{operation="Upload", description="File Upload", dataset="/Argon", endpoint="upload"} 0
fuseki_requests_good{operation="Upload", description="File Upload", dataset="/Argon", endpoint="upload"} 0
fuseki_requests_bad{operation="Query", description="SPARQL Query", dataset="/Argon", endpoint="query"} 0
fuseki_requests{operation="Query", description="SPARQL Query", dataset="/Argon", endpoint="query"} 1694
fuseki_requests_good{operation="Query", description="SPARQL Query", dataset="/Argon", endpoint="query"} 1694
fuseki_requests_bad{operation="Query", description="SPARQL Query", dataset="/Argon", endpoint="sparql"} 0
...
etc
etc
```
I configured Prometheus to scrape every 5 seconds and in Grafana was able to put together these graphs
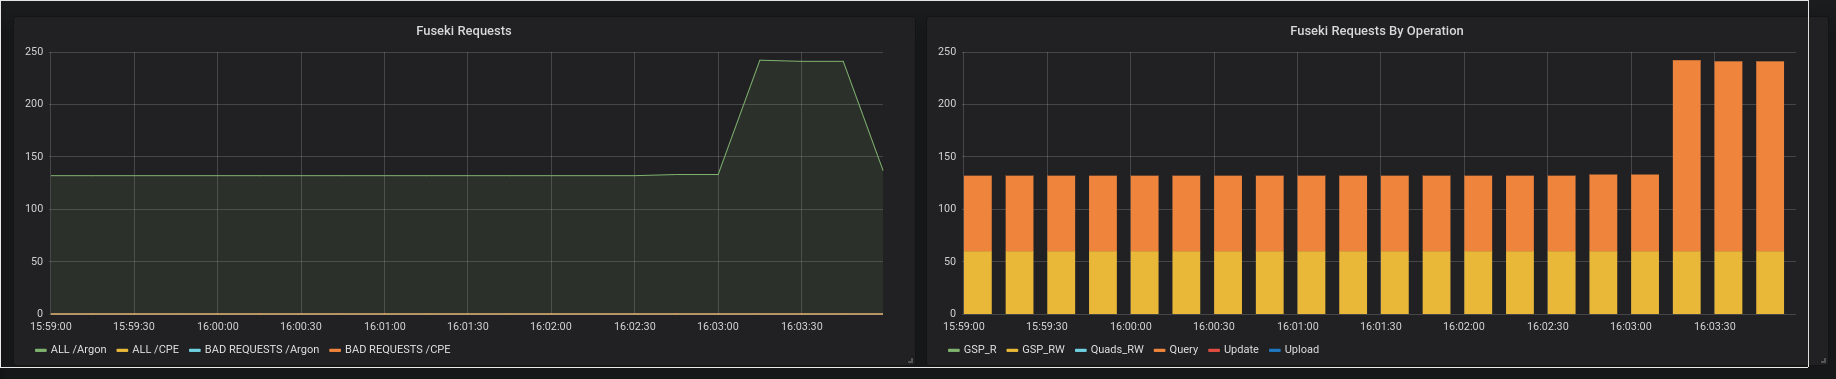
One the left is fuseki_requests grouped by dataset and on the right is the same metric but grouped by request type. I just wrote a curl loop of `GET`s to generate the spike
I on-purpose didn't introduce any new dependencies here - it'd be great to also expose jvm metrics like what happens in [the Spring Boot actuator for Prometheus](https://www.callicoder.com/spring-boot-actuator-metrics-monitoring-dashboard-prometheus-grafana/) but it would involve maybe adding dependencies on something like [micrometer](https://github.com/micrometer-metrics/micrometer)
I had looked into getting the tuple counts but I see that it's implemented via a sparql query in the Fuseki UI - so not sure how resource intensive it would be to continually do that
Let me know what you think - is there any interest out there in persevering with this?
----------------------------------------------------------------
This is an automated message from the Apache Git Service.
To respond to the message, please log on GitHub and use the
URL above to go to the specific comment.
For queries about this service, please contact Infrastructure at:
users@infra.apache.org
With regards,
Apache Git Services