You are viewing a plain text version of this content. The canonical link for it is here.
Posted to commits@airflow.apache.org by GitBox <gi...@apache.org> on 2020/05/20 19:24:35 UTC
[GitHub] [airflow] JeffryMAC opened a new issue #8931: Graph to see DAG run duration metric
JeffryMAC opened a new issue #8931:
URL: https://github.com/apache/airflow/issues/8931
**Description**
airflow has many graph showing insights on task level (task duration, task tries, landing times, gantt)
yet there are no graphs that show metrics on graph level
I have a simple question that I want to see in a graph. Did the overall time the dag runs has increased or not? it can be simple graph just calculating the dag start time and stop time and putting all durations on one graph.
something like:
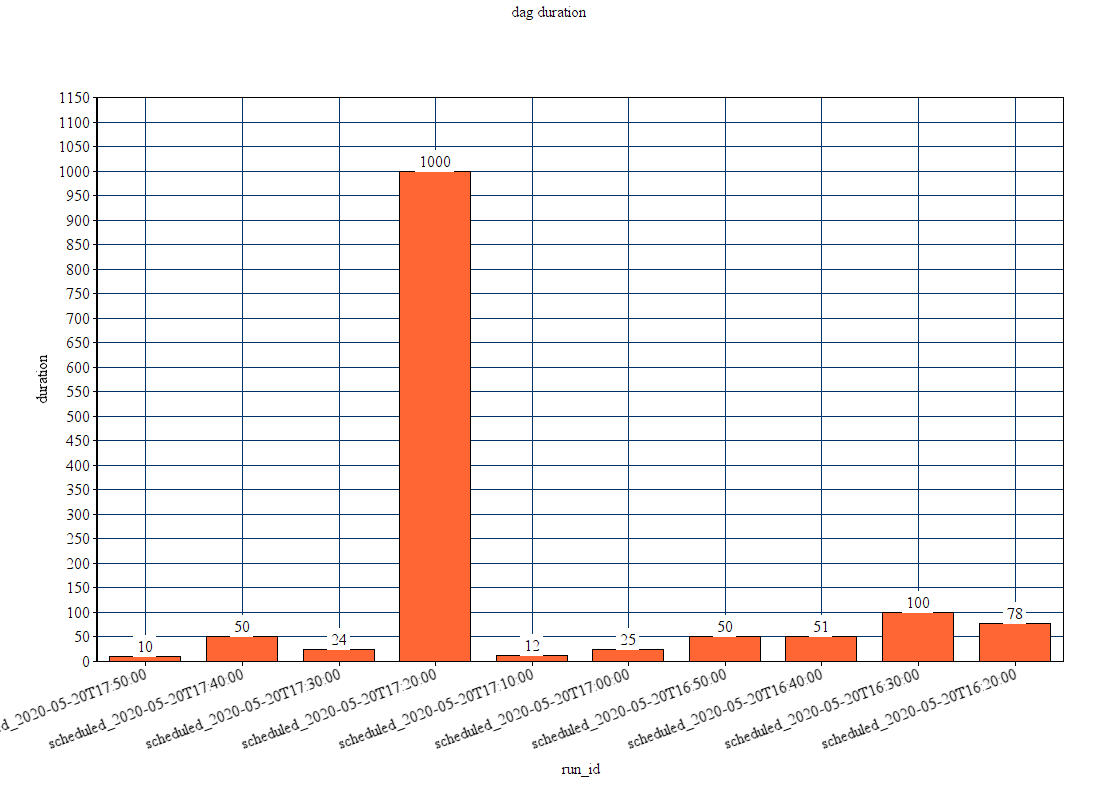
would be extra cool if it will allow to play with the duration units (seconds, minutes, hours, days)
----------------------------------------------------------------
This is an automated message from the Apache Git Service.
To respond to the message, please log on to GitHub and use the
URL above to go to the specific comment.
For queries about this service, please contact Infrastructure at:
users@infra.apache.org
[GitHub] [airflow] JeffryMAC commented on issue #8931: Graph to see DAG run duration metric
Posted by GitBox <gi...@apache.org>.
JeffryMAC commented on issue #8931:
URL: https://github.com/apache/airflow/issues/8931#issuecomment-639095357


   is anyone know a good way to get this data from the backend db? is anyone monitoring such thing in their own internal system?


----------------------------------------------------------------
This is an automated message from the Apache Git Service.
To respond to the message, please log on to GitHub and use the
URL above to go to the specific comment.

For queries about this service, please contact Infrastructure at:
users@infra.apache.org
[GitHub] [airflow] JeffryMAC commented on issue #8931: Graph to see DAG run duration metric
Posted by GitBox <gi...@apache.org>.
JeffryMAC commented on issue #8931:
URL: https://github.com/apache/airflow/issues/8931#issuecomment-718784852


   Played around some and I couldn't find easy way to set this up.
   I really think that airflow needs to support this natively.
   Have a graph that shows run time (duration) of the whole dag end to end with trend so we can detect which dag runs take long time and should be investigated.


----------------------------------------------------------------
This is an automated message from the Apache Git Service.
To respond to the message, please log on to GitHub and use the
URL above to go to the specific comment.

For queries about this service, please contact Infrastructure at:
users@infra.apache.org
[GitHub] [airflow] mik-laj commented on issue #8931: Graph to see DAG run duration metric
Posted by GitBox <gi...@apache.org>.
mik-laj commented on issue #8931:
URL: https://github.com/apache/airflow/issues/8931#issuecomment-639162286


   I think it's best if you use Data Studio and you connect directly to the database.
   Here is a guide for PostgresSQL:
   https://support.google.com/datastudio/answer/7288010?hl=en
   Here is a guide for MySQL:
   https://support.google.com/datastudio/answer/7088031?hl=en


----------------------------------------------------------------
This is an automated message from the Apache Git Service.
To respond to the message, please log on to GitHub and use the
URL above to go to the specific comment.

For queries about this service, please contact Infrastructure at:
users@infra.apache.org
[GitHub] [airflow] mik-laj commented on issue #8931: Graph to see DAG run duration metric
Posted by GitBox <gi...@apache.org>.
mik-laj commented on issue #8931:
URL: https://github.com/apache/airflow/issues/8931#issuecomment-660618043


   @JeffryMAC I haven't seen it, but we use [FAB](https://flask-appbuilder.readthedocs.io/en/latest/) to build views and [nvd3](https://pypi.org/project/python-nvd3/) as a graph library


----------------------------------------------------------------
This is an automated message from the Apache Git Service.
To respond to the message, please log on to GitHub and use the
URL above to go to the specific comment.

For queries about this service, please contact Infrastructure at:
users@infra.apache.org
[GitHub] [airflow] JeffryMAC commented on issue #8931: Graph to see DAG run duration metric
Posted by GitBox <gi...@apache.org>.
JeffryMAC commented on issue #8931:
URL: https://github.com/apache/airflow/issues/8931#issuecomment-766083179


   @turbaszek that looks very cool and it's very useful I'm sure.
   But this issue is around data that already available in Airflow database it just need a proper presentation in the UI.

   I really feel that Airflow can improve in the graphs it shows in the UI and allow users to better understand what is going on.
   Graphs can make it really easy to spot problems.


----------------------------------------------------------------
This is an automated message from the Apache Git Service.
To respond to the message, please log on to GitHub and use the
URL above to go to the specific comment.

For queries about this service, please contact Infrastructure at:
users@infra.apache.org
[GitHub] [airflow] turbaszek commented on issue #8931: Graph to see DAG run duration metric
Posted by GitBox <gi...@apache.org>.
turbaszek commented on issue #8931:
URL: https://github.com/apache/airflow/issues/8931#issuecomment-727284355


   @JeffryMAC I somehow agree that having nice stats in Airflow itself would be a nice feature. I did some work around that in #11631


----------------------------------------------------------------
This is an automated message from the Apache Git Service.
To respond to the message, please log on to GitHub and use the
URL above to go to the specific comment.

For queries about this service, please contact Infrastructure at:
users@infra.apache.org
[GitHub] [airflow] JeffryMAC commented on issue #8931: Graph to see DAG run duration metric
Posted by GitBox <gi...@apache.org>.
JeffryMAC commented on issue #8931:
URL: https://github.com/apache/airflow/issues/8931#issuecomment-660607520


   thx @mik-laj  is there any documentation on how to add more graphs to the UI?


----------------------------------------------------------------
This is an automated message from the Apache Git Service.
To respond to the message, please log on to GitHub and use the
URL above to go to the specific comment.

For queries about this service, please contact Infrastructure at:
users@infra.apache.org
[GitHub] [airflow] bbovenzi commented on issue #8931: Graph to see DAG run duration metric
Posted by GitBox <gi...@apache.org>.
bbovenzi commented on issue #8931:
URL: https://github.com/apache/airflow/issues/8931#issuecomment-910133752


   I'm working on some updates to tree view that will address this.


--
This is an automated message from the Apache Git Service.
To respond to the message, please log on to GitHub and use the
URL above to go to the specific comment.

To unsubscribe, e-mail: commits-unsubscribe@airflow.apache.org

For queries about this service, please contact Infrastructure at:
users@infra.apache.org