You are viewing a plain text version of this content. The canonical link for it is here.
Posted to notifications@superset.apache.org by GitBox <gi...@apache.org> on 2019/01/17 21:24:49 UTC
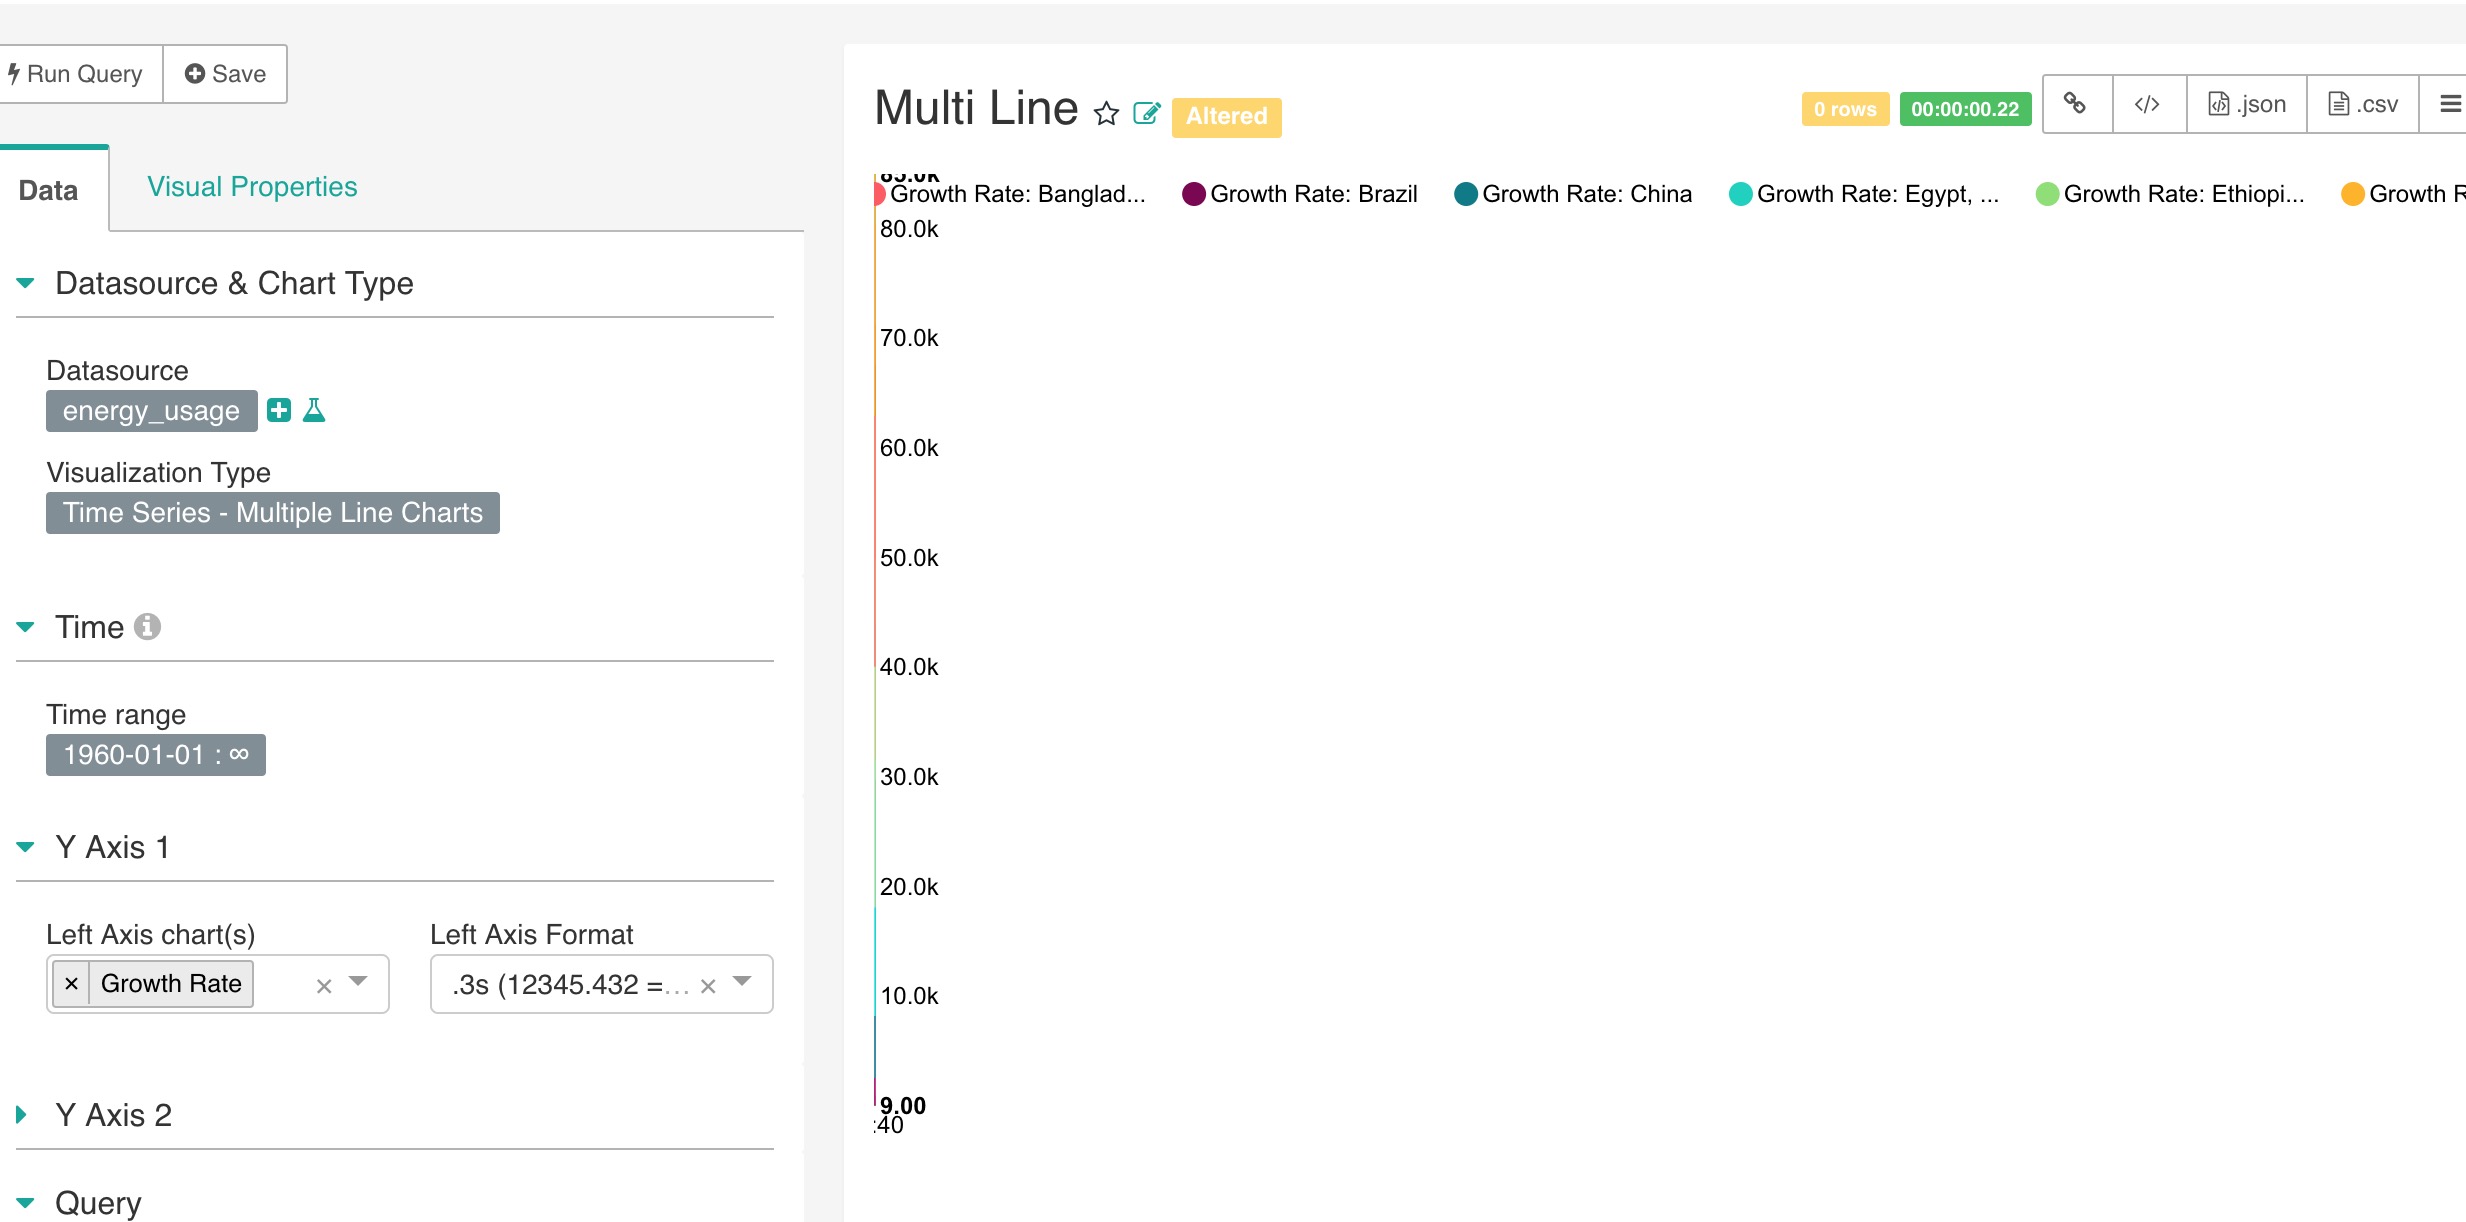
[GitHub] rsdpyenugula opened a new issue #6716: Time Series Multi Line Chart
Rendering issue
rsdpyenugula opened a new issue #6716: Time Series Multi Line Chart Rendering issue
URL: https://github.com/apache/incubator-superset/issues/6716
### Superset version
Flask 0.12.4
Python 3.6.6 |Anaconda, Inc.| (default, Jun 28 2018, 11:07:29)
[GCC 4.2.1 Compatible Clang 4.0.1 (tags/RELEASE_401/final)]
### Actual results
### Steps to reproduce
Go the Dashboard Misc Charts in the examples
----------------------------------------------------------------
This is an automated message from the Apache Git Service.
To respond to the message, please log on GitHub and use the
URL above to go to the specific comment.
For queries about this service, please contact Infrastructure at:
users@infra.apache.org
With regards,
Apache Git Services
---------------------------------------------------------------------
To unsubscribe, e-mail: notifications-unsubscribe@superset.apache.org
For additional commands, e-mail: notifications-help@superset.apache.org