You are viewing a plain text version of this content. The canonical link for it is here.
Posted to commits@echarts.apache.org by GitBox <gi...@apache.org> on 2021/08/23 18:48:18 UTC
[GitHub] [echarts] NiantongDong commented on issue #15558: Display negative value in Logarithmic axis
NiantongDong commented on issue #15558:
URL: https://github.com/apache/echarts/issues/15558#issuecomment-904022244
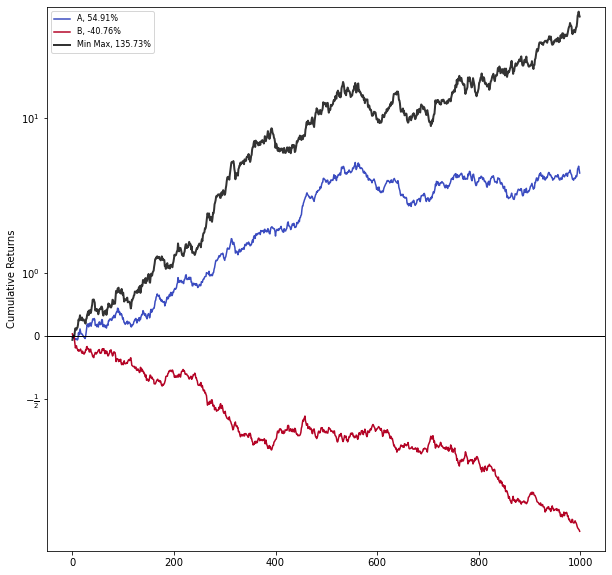
What I want to do is to use the log1p y-axis to represent the certain stock return rate. The rate may be negative and keep going down. If I use type 'log' in echarts, it will not show any value less than 0. If I use type 'value', the graph is incorrect. The idea is that the rate is calculated by Math.log1p(x) and the y-axis value should also be calculated Math.exp(y) so that it can show the correct plot for each value. Here is an example graph I generated using Juptyer and matplotlib.
--
This is an automated message from the Apache Git Service.
To respond to the message, please log on to GitHub and use the
URL above to go to the specific comment.
To unsubscribe, e-mail: commits-unsubscribe@echarts.apache.org
For queries about this service, please contact Infrastructure at:
users@infra.apache.org
---------------------------------------------------------------------
To unsubscribe, e-mail: commits-unsubscribe@echarts.apache.org
For additional commands, e-mail: commits-help@echarts.apache.org