You are viewing a plain text version of this content. The canonical link for it is here.
Posted to reviews@iotdb.apache.org by GitBox <gi...@apache.org> on 2021/12/14 16:25:51 UTC
[GitHub] [iotdb] xinzhongtianxia opened a new pull request #4573: [IOTDB-2144][metric]Collect IoTDB Runtime Metrics
xinzhongtianxia opened a new pull request #4573:
URL: https://github.com/apache/iotdb/pull/4573


   ## Description
   Benefit from the metric framework, we could now collect some core IoTDB Runtime metrics, which will help users get a clear sight of their IoTDB's status and will also help RD an SRE resolve problems or establish their own monitor systems.
   1. These metrics will coverage current core modules, such as cluster、flush、thrift、compaction、cache、JVM、logback...
   2. All metrics will provided with both standard JMX via JMX beans and Prometheus format via http APIs.

   jira:
   https://issues.apache.org/jira/browse/IOTDB-2144


--
This is an automated message from the Apache Git Service.
To respond to the message, please log on to GitHub and use the
URL above to go to the specific comment.

To unsubscribe, e-mail: reviews-unsubscribe@iotdb.apache.org

For queries about this service, please contact Infrastructure at:
users@infra.apache.org
[GitHub] [iotdb] SteveYurongSu edited a comment on pull request #4573: [IOTDB-2144][metric]Collect IoTDB Runtime Metrics
Posted by GitBox <gi...@apache.org>.
SteveYurongSu edited a comment on pull request #4573:
URL: https://github.com/apache/iotdb/pull/4573#issuecomment-996541720


   Thanks for the work of @xinzhongtianxia, now we have a performance report.

   **The report shows that the current monitoring points have no impact on performance.**

   Disable metrics:
   ```
   ----------------------Main Configurations----------------------
   DB_SWITCH: IoTDB-012-SESSION_BY_RECORDS
   OPERATION_PROPORTION: 10:1:1:1:1:1:1:1:1:1:1
   ENABLE_THRIFT_COMPRESSION: false
   INSERT_DATATYPE_PROPORTION: 1:1:1:1:1:1
   IS_CLIENT_BIND: true
   CLIENT_NUMBER: 15
   GROUP_NUMBER: 20
   DEVICE_NUMBER: 100
   SENSOR_NUMBER: 10
   BATCH_SIZE_PER_WRITE: 10
   LOOP: 100000
   POINT_STEP: 5000
   QUERY_INTERVAL: 250000
   IS_OUT_OF_ORDER: false
   OUT_OF_ORDER_MODE: 0
   OUT_OF_ORDER_RATIO: 0.5
   ---------------------------------------------------------------
   main measurements:
   Create schema cost 0.04 second
   Test elapsed time (not include schema creation): 684.90 second
   ----------------------------------------------------------Result Matrix----------------------------------------------------------
   Operation           okOperation         okPoint             failOperation       failPoint           throughput(point/s)
   INGESTION           4998403             499840300           0                   0                   729799.97
   PRECISE_POINT       75067               19                  0                   0                   0.03
   TIME_RANGE          74887               3743985             0                   0                   5466.47
   VALUE_RANGE         75087               3754246             0                   0                   5481.45
   AGG_RANGE           75113               75113               0                   0                   109.67
   AGG_VALUE           75425               75425               0                   0                   110.13
   AGG_RANGE_VALUE     74690               74690               0                   0                   109.05
   GROUP_BY            74918               973934              0                   0                   1422.01
   LATEST_POINT        75172               75172               0                   0                   109.76
   RANGE_QUERY_DESC    74839               3741459             0                   0                   5462.78
   VALUE_RANGE_QUERY_DESC74979               3748794             0                   0                   5473.49
   ---------------------------------------------------------------------------------------------------------------------------------
   --------------------------------------------------------------------------Latency (ms) Matrix--------------------------------------------------------------------------
   Operation           AVG         MIN         P10         P25         MEDIAN      P75         P90         P95         P99         P999        MAX         SLOWEST_THREAD
   INGESTION           0.30        0.14        0.16        0.16        0.18        0.22        0.26        0.32        1.48        5.72        60007.18    143014.31
   PRECISE_POINT       3.42        0.25        2.17        2.23        2.34        2.84        3.26        3.38        4.49        17.16       59801.91    72709.95
   TIME_RANGE          2.82        0.48        2.33        2.41        2.52        3.06        3.53        3.65        5.58        17.76       192.43      14380.86
   VALUE_RANGE         5.25        0.50        2.41        2.48        2.43        2.86        3.63        3.79        6.11        17.72       59921.04    74458.15
   AGG_RANGE           2.70        0.42        2.30        2.36        2.45        2.68        3.43        3.58        4.77        17.36       316.38      13796.32
   AGG_VALUE           80.84       0.64        16.50       40.06       78.96       116.41      138.65      148.63      190.91      218.47      60021.10    455553.88
   AGG_RANGE_VALUE     4.12        0.63        2.72        2.85        3.03        3.35        4.15        4.44        7.75        19.05       59772.80    76746.97
   GROUP_BY            3.33        0.43        2.16        2.22        2.30        2.54        3.19        3.33        4.62        16.99       59468.04    72096.31
   LATEST_POINT        0.25        0.14        0.20        0.21        0.23        0.25        0.28        0.29        0.35        2.71        18.46       1288.20
   RANGE_QUERY_DESC    3.64        0.48        2.35        2.41        2.53        3.07        3.53        3.66        5.72        17.76       59943.76    74318.56
   VALUE_RANGE_QUERY_DESC3.67        0.52        2.42        2.49        2.59        2.86        3.63        3.79        5.84        17.66       60011.17    74054.30
   ```

   Enable metrics:
   ```
   ----------------------Main Configurations----------------------
   DB_SWITCH: IoTDB-012-SESSION_BY_RECORDS
   OPERATION_PROPORTION: 10:1:1:1:1:1:1:1:1:1:1
   ENABLE_THRIFT_COMPRESSION: false
   INSERT_DATATYPE_PROPORTION: 1:1:1:1:1:1
   IS_CLIENT_BIND: true
   CLIENT_NUMBER: 15
   GROUP_NUMBER: 20
   DEVICE_NUMBER: 100
   SENSOR_NUMBER: 10
   BATCH_SIZE_PER_WRITE: 10
   LOOP: 100000
   POINT_STEP: 5000
   QUERY_INTERVAL: 250000
   IS_OUT_OF_ORDER: false
   OUT_OF_ORDER_MODE: 0
   OUT_OF_ORDER_RATIO: 0.5
   ---------------------------------------------------------------
   main measurements:
   Create schema cost 0.08 second
   Test elapsed time (not include schema creation): 614.42 second
   ----------------------------------------------------------Result Matrix----------------------------------------------------------
   Operation           okOperation         okPoint             failOperation       failPoint           throughput(point/s)
   INGESTION           4998403             499840300           0                   0                   813509.32
   PRECISE_POINT       75067               15                  0                   0                   0.02
   TIME_RANGE          74887               3743969             0                   0                   6093.45
   VALUE_RANGE         75087               3754251             0                   0                   6110.19
   AGG_RANGE           75113               75113               0                   0                   122.25
   AGG_VALUE           75425               75425               0                   0                   122.76
   AGG_RANGE_VALUE     74690               74690               0                   0                   121.56
   GROUP_BY            74918               973934              0                   0                   1585.12
   LATEST_POINT        75172               75172               0                   0                   122.35
   RANGE_QUERY_DESC    74839               3741417             0                   0                   6089.30
   VALUE_RANGE_QUERY_DESC74979               3748741             0                   0                   6101.22
   ---------------------------------------------------------------------------------------------------------------------------------
   --------------------------------------------------------------------------Latency (ms) Matrix--------------------------------------------------------------------------
   Operation           AVG         MIN         P10         P25         MEDIAN      P75         P90         P95         P99         P999        MAX         SLOWEST_THREAD
   INGESTION           0.27        0.16        0.17        0.18        0.20        0.25        0.29        0.37        1.55        6.98        272.78      93945.68
   PRECISE_POINT       2.57        0.36        2.13        2.19        2.29        2.69        3.22        3.34        4.20        16.95       220.03      13104.44
   TIME_RANGE          2.76        0.83        2.28        2.35        2.45        2.90        3.47        3.61        5.57        17.78       171.88      14154.52
   VALUE_RANGE         2.84        0.85        2.38        2.44        2.54        2.83        3.59        3.74        5.69        18.55       199.86      14478.47
   AGG_RANGE           2.67        0.75        2.25        2.31        2.40        2.64        3.41        3.56        4.67        17.73       220.22      13721.33
   AGG_VALUE           76.64       1.11        15.64       38.45       75.59       112.95      134.03      144.54      182.34      211.64      331.16      399059.57
   AGG_RANGE_VALUE     3.33        0.98        2.69        2.82        3.02        3.36        4.16        4.47        8.24        19.43       248.50      16953.70
   GROUP_BY            2.55        0.80        2.12        2.18        2.27        2.52        3.18        3.32        4.74        17.91       220.14      13092.05
   LATEST_POINT        0.26        0.15        0.20        0.22        0.24        0.26        0.29        0.31        0.48        2.89        81.12       1391.35
   RANGE_QUERY_DESC    2.78        0.84        2.29        2.35        2.46        2.90        3.48        3.61        5.57        17.93       245.16      14249.38
   VALUE_RANGE_QUERY_DESC2.84        0.82        2.38        2.45        2.55        2.84        3.60        3.77        5.80        18.58       170.85      14732.33
   -----------------------------------------------------------------------------------------------------------------------------------------------------------------------
   ```


--
This is an automated message from the Apache Git Service.
To respond to the message, please log on to GitHub and use the
URL above to go to the specific comment.

To unsubscribe, e-mail: reviews-unsubscribe@iotdb.apache.org

For queries about this service, please contact Infrastructure at:
users@infra.apache.org
[GitHub] [iotdb] stormbroken commented on a change in pull request #4573: [IOTDB-2144][metric]Collect IoTDB Runtime Metrics
Posted by GitBox <gi...@apache.org>.
stormbroken commented on a change in pull request #4573:
URL: https://github.com/apache/iotdb/pull/4573#discussion_r770254620


##########
File path: metrics/interface/src/main/assembly/resources/conf/iotdb-metric.yml
##########
@@ -18,11 +18,12 @@
 #

 # whether enable the module
-enableMetric: false
+enableMetric: true

Review comment:
       Please set default value as false because this will influence iotdb-server

##########
File path: metrics/interface/src/main/assembly/resources/conf/iotdb-metric.yml
##########
@@ -18,11 +18,12 @@
 #

 # whether enable the module
-enableMetric: false
+enableMetric: true

 # can be multiple reporter, e.g., jmx, prometheus
 metricReporterList:
   - jmx
+  - prometheus

Review comment:
       From my perspective, Default value(jmx) is enough, so you can remove prometheus here

##########
File path: metrics/interface/src/main/java/org/apache/iotdb/metrics/config/MetricConfig.java
##########
@@ -27,7 +27,7 @@

 public class MetricConfig {
   /** enable publishing data. */
-  private Boolean enableMetric = false;
+  private Boolean enableMetric = true;

Review comment:
       I think default value can be false?

##########
File path: metrics/interface/src/main/java/org/apache/iotdb/metrics/config/MetricConfig.java
##########
@@ -36,7 +36,8 @@
   private MonitorType monitorType = MonitorType.micrometer;

   /** provide or push metric data to remote system, could be jmx, prometheus, iotdb, etc. */
-  private List<ReporterType> metricReporterList = Arrays.asList(ReporterType.jmx);
+  private List<ReporterType> metricReporterList =
+      Arrays.asList(ReporterType.jmx, ReporterType.prometheus);

Review comment:
       I think default value can be only jmx


--
This is an automated message from the Apache Git Service.
To respond to the message, please log on to GitHub and use the
URL above to go to the specific comment.

To unsubscribe, e-mail: reviews-unsubscribe@iotdb.apache.org

For queries about this service, please contact Infrastructure at:
users@infra.apache.org
[GitHub] [iotdb] SteveYurongSu commented on a change in pull request #4573: [IOTDB-2144][metric]Collect IoTDB Runtime Metrics
Posted by GitBox <gi...@apache.org>.
SteveYurongSu commented on a change in pull request #4573:
URL: https://github.com/apache/iotdb/pull/4573#discussion_r773558058
##########
File path: docs/UserGuide/System-Tools/Metric-Tool.md
##########
@@ -264,9 +264,20 @@ mem{name="mtree",} 1328.0
### Integrating with Prometheus and Grafana
-As above descriptions,IoTDB provides metrics data in standard Prometheus format,so we can Integrate with Prometheus and Grafana directly.
+As above descriptions,IoTDB provides metrics data in standard Prometheus format,so we can integrate with Prometheus and Grafana directly.
-You can config your Prometheus as follows to get metrics data from IoTDB:
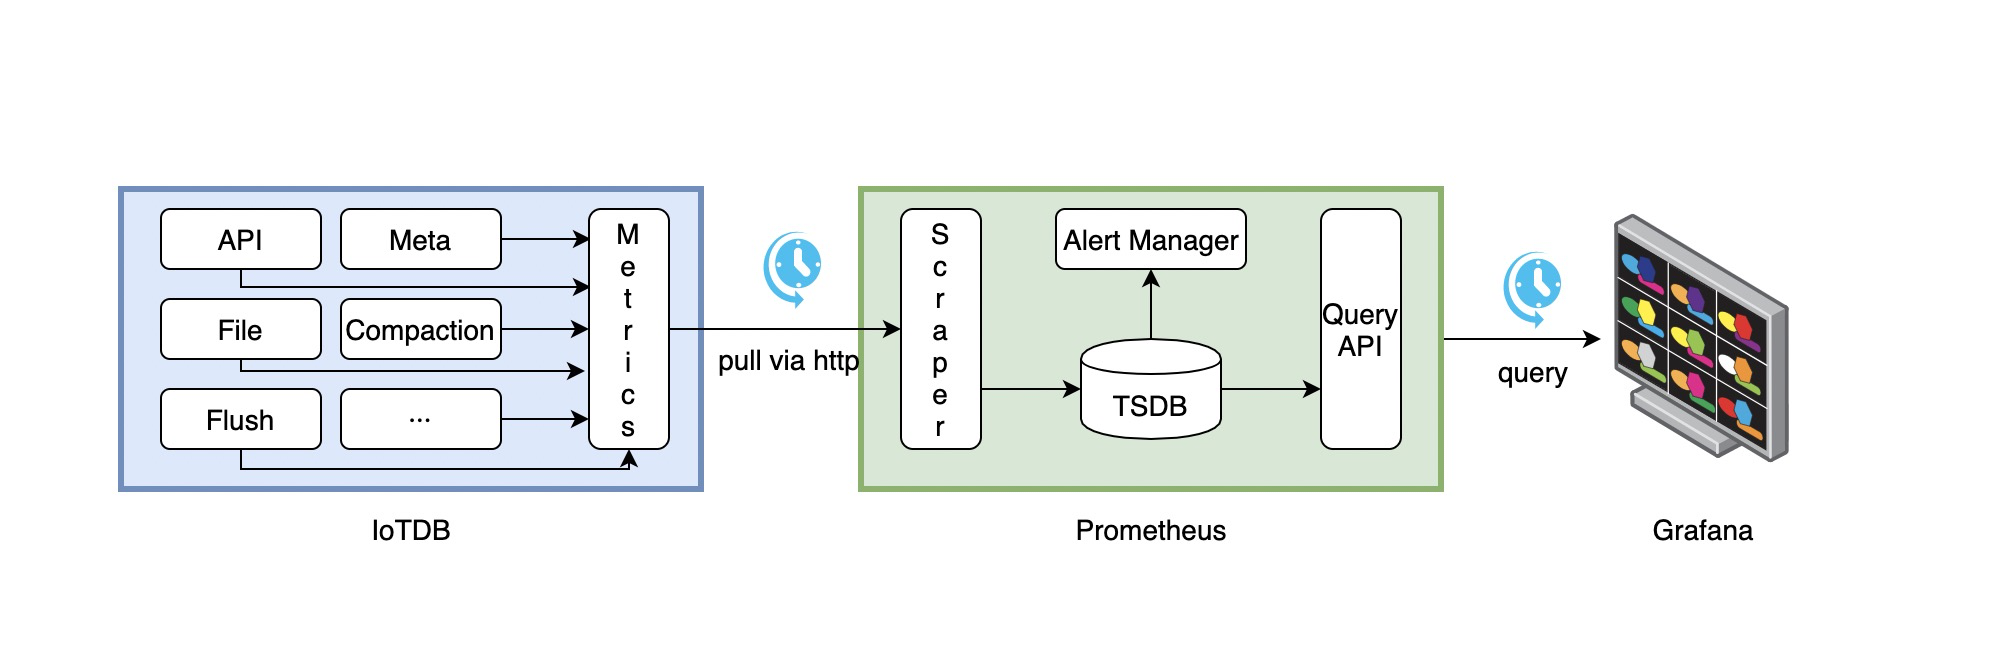
+The following picture describes the relationships among IoTDB, Prometheus and Grafana
+
+
+
+1. Along with running, IoTDB will collect its metrics continuously.
+2. Prometheus scrapes metrics from IoTDB at a constant interval (can be configured).
+3. Prometheus saves these metrics to its inner TSDB.
+4. Grafana queries metrics from Prometheus at a constant interval (can be configured) and then presents them on the graph.
+
+So, we need to do some additional works to configure and deploy Prometheus and Grafana.
+
+For instance, you can config your Prometheus as follows to get metrics data from IoTDB:
```yaml
job_name: push-metrics
Review comment:
```suggestion
job_name: pull-metrics
```
--
This is an automated message from the Apache Git Service.
To respond to the message, please log on to GitHub and use the
URL above to go to the specific comment.
To unsubscribe, e-mail: reviews-unsubscribe@iotdb.apache.org
For queries about this service, please contact Infrastructure at:
users@infra.apache.org
[GitHub] [iotdb] stormbroken commented on a change in pull request #4573: [IOTDB-2144][metric]Collect IoTDB Runtime Metrics
Posted by GitBox <gi...@apache.org>.
stormbroken commented on a change in pull request #4573:
URL: https://github.com/apache/iotdb/pull/4573#discussion_r770257322


##########
File path: metrics/interface/src/main/java/org/apache/iotdb/metrics/config/MetricConfig.java
##########
@@ -36,7 +36,8 @@
   private MonitorType monitorType = MonitorType.micrometer;

   /** provide or push metric data to remote system, could be jmx, prometheus, iotdb, etc. */
-  private List<ReporterType> metricReporterList = Arrays.asList(ReporterType.jmx);
+  private List<ReporterType> metricReporterList =
+      Arrays.asList(ReporterType.jmx, ReporterType.prometheus);

Review comment:
       I think default value can be only jmx


--
This is an automated message from the Apache Git Service.
To respond to the message, please log on to GitHub and use the
URL above to go to the specific comment.

To unsubscribe, e-mail: reviews-unsubscribe@iotdb.apache.org

For queries about this service, please contact Infrastructure at:
users@infra.apache.org
[GitHub] [iotdb] xinzhongtianxia commented on a change in pull request #4573: [IOTDB-2144][metric]Collect IoTDB Runtime Metrics
Posted by GitBox <gi...@apache.org>.
xinzhongtianxia commented on a change in pull request #4573:
URL: https://github.com/apache/iotdb/pull/4573#discussion_r770276006


##########
File path: metrics/interface/src/main/assembly/resources/conf/iotdb-metric.yml
##########
@@ -18,11 +18,12 @@
 #

 # whether enable the module
-enableMetric: false
+enableMetric: true

 # can be multiple reporter, e.g., jmx, prometheus
 metricReporterList:
   - jmx
+  - prometheus

Review comment:
       I think prometheus is more useful than JMX to DBA or SRE, from which iotdb can easily integrate with prometheus (the standard monitor resolutions of CNCF), and users can get status from a simple ‘curl’ command conveniently.


--
This is an automated message from the Apache Git Service.
To respond to the message, please log on to GitHub and use the
URL above to go to the specific comment.

To unsubscribe, e-mail: reviews-unsubscribe@iotdb.apache.org

For queries about this service, please contact Infrastructure at:
users@infra.apache.org
[GitHub] [iotdb] stormbroken commented on a change in pull request #4573: [IOTDB-2144][metric]Collect IoTDB Runtime Metrics
Posted by GitBox <gi...@apache.org>.
stormbroken commented on a change in pull request #4573:
URL: https://github.com/apache/iotdb/pull/4573#discussion_r770278103


##########
File path: metrics/interface/src/main/assembly/resources/conf/iotdb-metric.yml
##########
@@ -18,11 +18,12 @@
 #

 # whether enable the module
-enableMetric: false
+enableMetric: true

 # can be multiple reporter, e.g., jmx, prometheus
 metricReporterList:
   - jmx
+  - prometheus

Review comment:
       ok, I get it. I think this is reasonable


--
This is an automated message from the Apache Git Service.
To respond to the message, please log on to GitHub and use the
URL above to go to the specific comment.

To unsubscribe, e-mail: reviews-unsubscribe@iotdb.apache.org

For queries about this service, please contact Infrastructure at:
users@infra.apache.org
[GitHub] [iotdb] stormbroken commented on pull request #4573: [IOTDB-2144][metric]Collect IoTDB Runtime Metrics
Posted by GitBox <gi...@apache.org>.
stormbroken commented on pull request #4573:
URL: https://github.com/apache/iotdb/pull/4573#issuecomment-995493925


   @LebronAl This PR contains some metrics in cluster module, PTAL!


--
This is an automated message from the Apache Git Service.
To respond to the message, please log on to GitHub and use the
URL above to go to the specific comment.

To unsubscribe, e-mail: reviews-unsubscribe@iotdb.apache.org

For queries about this service, please contact Infrastructure at:
users@infra.apache.org
[GitHub] [iotdb] xinzhongtianxia commented on a change in pull request #4573: [IOTDB-2144][metric]Collect IoTDB Runtime Metrics
Posted by GitBox <gi...@apache.org>.
xinzhongtianxia commented on a change in pull request #4573:
URL: https://github.com/apache/iotdb/pull/4573#discussion_r770276315


##########
File path: metrics/interface/src/main/java/org/apache/iotdb/metrics/config/MetricConfig.java
##########
@@ -27,7 +27,7 @@

 public class MetricConfig {
   /** enable publishing data. */
-  private Boolean enableMetric = false;
+  private Boolean enableMetric = true;

Review comment:
       Agree, I'll fix this


--
This is an automated message from the Apache Git Service.
To respond to the message, please log on to GitHub and use the
URL above to go to the specific comment.

To unsubscribe, e-mail: reviews-unsubscribe@iotdb.apache.org

For queries about this service, please contact Infrastructure at:
users@infra.apache.org
[GitHub] [iotdb] SteveYurongSu commented on pull request #4573: [IOTDB-2144][metric]Collect IoTDB Runtime Metrics
Posted by GitBox <gi...@apache.org>.
SteveYurongSu commented on pull request #4573:
URL: https://github.com/apache/iotdb/pull/4573#issuecomment-996541720


   Thanks for the work of @xinzhongtianxia, now we have a performance report.

   Disable metrics:
   ```
   ----------------------Main Configurations----------------------
   DB_SWITCH: IoTDB-012-SESSION_BY_RECORDS
   OPERATION_PROPORTION: 10:1:1:1:1:1:1:1:1:1:1
   ENABLE_THRIFT_COMPRESSION: false
   INSERT_DATATYPE_PROPORTION: 1:1:1:1:1:1
   IS_CLIENT_BIND: true
   CLIENT_NUMBER: 15
   GROUP_NUMBER: 20
   DEVICE_NUMBER: 100
   SENSOR_NUMBER: 10
   BATCH_SIZE_PER_WRITE: 10
   LOOP: 100000
   POINT_STEP: 5000
   QUERY_INTERVAL: 250000
   IS_OUT_OF_ORDER: false
   OUT_OF_ORDER_MODE: 0
   OUT_OF_ORDER_RATIO: 0.5
   ---------------------------------------------------------------
   main measurements:
   Create schema cost 0.04 second
   Test elapsed time (not include schema creation): 684.90 second
   ----------------------------------------------------------Result Matrix----------------------------------------------------------
   Operation           okOperation         okPoint             failOperation       failPoint           throughput(point/s)
   INGESTION           4998403             499840300           0                   0                   729799.97
   PRECISE_POINT       75067               19                  0                   0                   0.03
   TIME_RANGE          74887               3743985             0                   0                   5466.47
   VALUE_RANGE         75087               3754246             0                   0                   5481.45
   AGG_RANGE           75113               75113               0                   0                   109.67
   AGG_VALUE           75425               75425               0                   0                   110.13
   AGG_RANGE_VALUE     74690               74690               0                   0                   109.05
   GROUP_BY            74918               973934              0                   0                   1422.01
   LATEST_POINT        75172               75172               0                   0                   109.76
   RANGE_QUERY_DESC    74839               3741459             0                   0                   5462.78
   VALUE_RANGE_QUERY_DESC74979               3748794             0                   0                   5473.49
   ---------------------------------------------------------------------------------------------------------------------------------
   --------------------------------------------------------------------------Latency (ms) Matrix--------------------------------------------------------------------------
   Operation           AVG         MIN         P10         P25         MEDIAN      P75         P90         P95         P99         P999        MAX         SLOWEST_THREAD
   INGESTION           0.30        0.14        0.16        0.16        0.18        0.22        0.26        0.32        1.48        5.72        60007.18    143014.31
   PRECISE_POINT       3.42        0.25        2.17        2.23        2.34        2.84        3.26        3.38        4.49        17.16       59801.91    72709.95
   TIME_RANGE          2.82        0.48        2.33        2.41        2.52        3.06        3.53        3.65        5.58        17.76       192.43      14380.86
   VALUE_RANGE         5.25        0.50        2.41        2.48        2.43        2.86        3.63        3.79        6.11        17.72       59921.04    74458.15
   AGG_RANGE           2.70        0.42        2.30        2.36        2.45        2.68        3.43        3.58        4.77        17.36       316.38      13796.32
   AGG_VALUE           80.84       0.64        16.50       40.06       78.96       116.41      138.65      148.63      190.91      218.47      60021.10    455553.88
   AGG_RANGE_VALUE     4.12        0.63        2.72        2.85        3.03        3.35        4.15        4.44        7.75        19.05       59772.80    76746.97
   GROUP_BY            3.33        0.43        2.16        2.22        2.30        2.54        3.19        3.33        4.62        16.99       59468.04    72096.31
   LATEST_POINT        0.25        0.14        0.20        0.21        0.23        0.25        0.28        0.29        0.35        2.71        18.46       1288.20
   RANGE_QUERY_DESC    3.64        0.48        2.35        2.41        2.53        3.07        3.53        3.66        5.72        17.76       59943.76    74318.56
   VALUE_RANGE_QUERY_DESC3.67        0.52        2.42        2.49        2.59        2.86        3.63        3.79        5.84        17.66       60011.17    74054.30
   ```

   Enable metrics:
   ```
   ----------------------Main Configurations----------------------
   DB_SWITCH: IoTDB-012-SESSION_BY_RECORDS
   OPERATION_PROPORTION: 10:1:1:1:1:1:1:1:1:1:1
   ENABLE_THRIFT_COMPRESSION: false
   INSERT_DATATYPE_PROPORTION: 1:1:1:1:1:1
   IS_CLIENT_BIND: true
   CLIENT_NUMBER: 15
   GROUP_NUMBER: 20
   DEVICE_NUMBER: 100
   SENSOR_NUMBER: 10
   BATCH_SIZE_PER_WRITE: 10
   LOOP: 100000
   POINT_STEP: 5000
   QUERY_INTERVAL: 250000
   IS_OUT_OF_ORDER: false
   OUT_OF_ORDER_MODE: 0
   OUT_OF_ORDER_RATIO: 0.5
   ---------------------------------------------------------------
   main measurements:
   Create schema cost 0.08 second
   Test elapsed time (not include schema creation): 614.42 second
   ----------------------------------------------------------Result Matrix----------------------------------------------------------
   Operation           okOperation         okPoint             failOperation       failPoint           throughput(point/s)
   INGESTION           4998403             499840300           0                   0                   813509.32
   PRECISE_POINT       75067               15                  0                   0                   0.02
   TIME_RANGE          74887               3743969             0                   0                   6093.45
   VALUE_RANGE         75087               3754251             0                   0                   6110.19
   AGG_RANGE           75113               75113               0                   0                   122.25
   AGG_VALUE           75425               75425               0                   0                   122.76
   AGG_RANGE_VALUE     74690               74690               0                   0                   121.56
   GROUP_BY            74918               973934              0                   0                   1585.12
   LATEST_POINT        75172               75172               0                   0                   122.35
   RANGE_QUERY_DESC    74839               3741417             0                   0                   6089.30
   VALUE_RANGE_QUERY_DESC74979               3748741             0                   0                   6101.22
   ---------------------------------------------------------------------------------------------------------------------------------
   --------------------------------------------------------------------------Latency (ms) Matrix--------------------------------------------------------------------------
   Operation           AVG         MIN         P10         P25         MEDIAN      P75         P90         P95         P99         P999        MAX         SLOWEST_THREAD
   INGESTION           0.27        0.16        0.17        0.18        0.20        0.25        0.29        0.37        1.55        6.98        272.78      93945.68
   PRECISE_POINT       2.57        0.36        2.13        2.19        2.29        2.69        3.22        3.34        4.20        16.95       220.03      13104.44
   TIME_RANGE          2.76        0.83        2.28        2.35        2.45        2.90        3.47        3.61        5.57        17.78       171.88      14154.52
   VALUE_RANGE         2.84        0.85        2.38        2.44        2.54        2.83        3.59        3.74        5.69        18.55       199.86      14478.47
   AGG_RANGE           2.67        0.75        2.25        2.31        2.40        2.64        3.41        3.56        4.67        17.73       220.22      13721.33
   AGG_VALUE           76.64       1.11        15.64       38.45       75.59       112.95      134.03      144.54      182.34      211.64      331.16      399059.57
   AGG_RANGE_VALUE     3.33        0.98        2.69        2.82        3.02        3.36        4.16        4.47        8.24        19.43       248.50      16953.70
   GROUP_BY            2.55        0.80        2.12        2.18        2.27        2.52        3.18        3.32        4.74        17.91       220.14      13092.05
   LATEST_POINT        0.26        0.15        0.20        0.22        0.24        0.26        0.29        0.31        0.48        2.89        81.12       1391.35
   RANGE_QUERY_DESC    2.78        0.84        2.29        2.35        2.46        2.90        3.48        3.61        5.57        17.93       245.16      14249.38
   VALUE_RANGE_QUERY_DESC2.84        0.82        2.38        2.45        2.55        2.84        3.60        3.77        5.80        18.58       170.85      14732.33
   -----------------------------------------------------------------------------------------------------------------------------------------------------------------------
   ```


--
This is an automated message from the Apache Git Service.
To respond to the message, please log on to GitHub and use the
URL above to go to the specific comment.

To unsubscribe, e-mail: reviews-unsubscribe@iotdb.apache.org

For queries about this service, please contact Infrastructure at:
users@infra.apache.org
[GitHub] [iotdb] xinzhongtianxia commented on a change in pull request #4573: [IOTDB-2144][metric]Collect IoTDB Runtime Metrics
Posted by GitBox <gi...@apache.org>.
xinzhongtianxia commented on a change in pull request #4573:
URL: https://github.com/apache/iotdb/pull/4573#discussion_r770276216


##########
File path: metrics/interface/src/main/assembly/resources/conf/iotdb-metric.yml
##########
@@ -18,11 +18,12 @@
 #

 # whether enable the module
-enableMetric: false
+enableMetric: true

Review comment:
       Agree, I'll fix this


--
This is an automated message from the Apache Git Service.
To respond to the message, please log on to GitHub and use the
URL above to go to the specific comment.

To unsubscribe, e-mail: reviews-unsubscribe@iotdb.apache.org

For queries about this service, please contact Infrastructure at:
users@infra.apache.org
[GitHub] [iotdb] SteveYurongSu merged pull request #4573: [IOTDB-2144][Metric] Collect IoTDB Runtime Metrics
Posted by GitBox <gi...@apache.org>.
SteveYurongSu merged pull request #4573:
URL: https://github.com/apache/iotdb/pull/4573


--
This is an automated message from the Apache Git Service.
To respond to the message, please log on to GitHub and use the
URL above to go to the specific comment.

To unsubscribe, e-mail: reviews-unsubscribe@iotdb.apache.org

For queries about this service, please contact Infrastructure at:
users@infra.apache.org