You are viewing a plain text version of this content. The canonical link for it is here.
Posted to dev@echarts.apache.org by GitBox <gi...@apache.org> on 2018/05/10 14:14:11 UTC
[GitHub] waitkafuka opened a new issue #8319: 3D绘制surface曲面中的问题
waitkafuka opened a new issue #8319: 3D绘制surface曲面中的问题
URL: https://github.com/apache/incubator-echarts/issues/8319
3D surface图表中的数据坐标,有什么要求吗?按理说不是应该空间中任意三个不重合的点都可以绘制出一个面吗?为什么在实际中绘制不了呢?
代码:
`var myChart = echarts.init(document.getElementsByClassName('chart-container')[0]);
var data = [
[-1, -1, 0],
[0, -1, 0],
[0.5, -1, 0],
];
var option = {
grid3D: {
},
xAxis3D: {
},
yAxis3D: {
},
zAxis3D: {
},
series: [{
type: 'surface',
data:data
}]
}
myChart.setOption(option);`
实际上是想做一个类似这样的图:

但是用上面的代码,把数据放进去,渲染不出来,是一片空白:
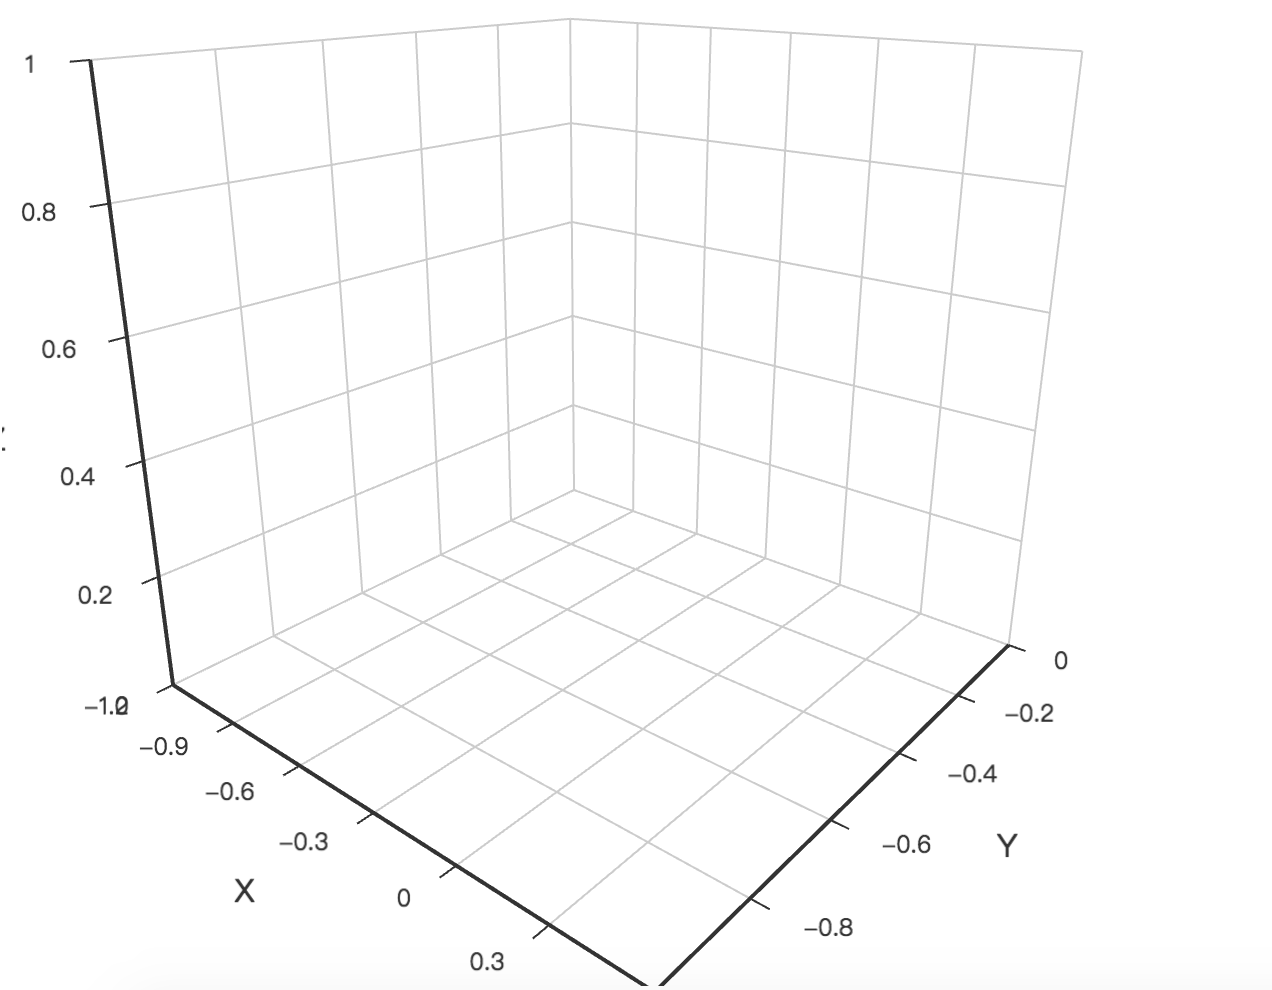
求解!
是对data有什么要求?
----------------------------------------------------------------
This is an automated message from the Apache Git Service.
To respond to the message, please log on GitHub and use the
URL above to go to the specific comment.
For queries about this service, please contact Infrastructure at:
users@infra.apache.org
With regards,
Apache Git Services
---------------------------------------------------------------------
To unsubscribe, e-mail: dev-unsubscribe@echarts.apache.org
For additional commands, e-mail: dev-help@echarts.apache.org