You are viewing a plain text version of this content. The canonical link for it is here.
Posted to dev@echarts.apache.org by GitBox <gi...@apache.org> on 2019/04/05 07:59:43 UTC
[GitHub] [incubator-echarts] tmtron opened a new issue #10222: Fix
clipPointsByRect()
tmtron opened a new issue #10222: Fix clipPointsByRect()
URL: https://github.com/apache/incubator-echarts/issues/10222
### Version
4.2.1
### Reproduction link
[jsFiddle Example](https://jsfiddle.net/tmtron/k9aof5pd/25/)
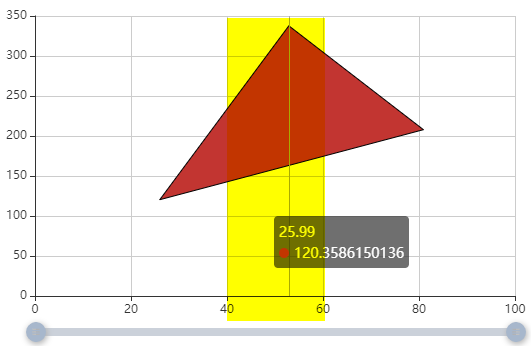
When you do not zoom, you see the full polygon (the yellow area marks the region that we will zoom into):
### Steps to reproduce
use a custom series to draw a polygon. when you zoom in, the polygon will be distored (it is not clipped correctly)
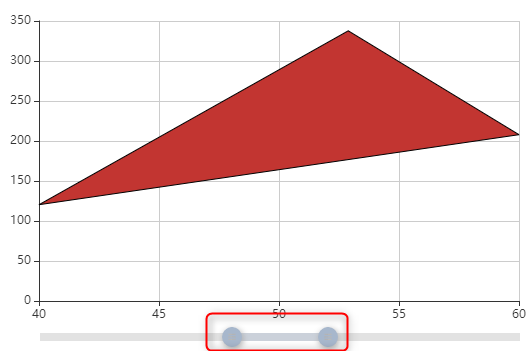
In the [jsFiddle Example](https://jsfiddle.net/tmtron/k9aof5pd/25/) you can press the `zoom Part` button below the chart. Here is the result, when `echarts.graphic.clipPointsByRect` is used:
notice the position of the zoom slider. The first data-point in the zoomed view seems to be at x=40 (but is in fact on x=25!)
### What is expected?
Clipping a polygon to a rectangle may need to change the ploygon shape (maybe add points).
The zoomed polygon should look like the yellow highlighted area in the first image.
### What is actually happening?
the current implementation only changes the x/y coordinates of the existing polygon, but does not change the shape
---
Full details are also on Stackoverflow: [How to avoid polygon distortion when zooming?](https://stackoverflow.com/questions/55521280/how-to-avoid-polygon-distortion-when-zooming/)
**Proposed solution**:
`clipPointsByRect()` should use a smarter clipping algorithm e.g. [Sutherland-Hodgman algorithm](https://en.wikipedia.org/wiki/Sutherland%E2%80%93Hodgman_algorithm) for polygon clipping
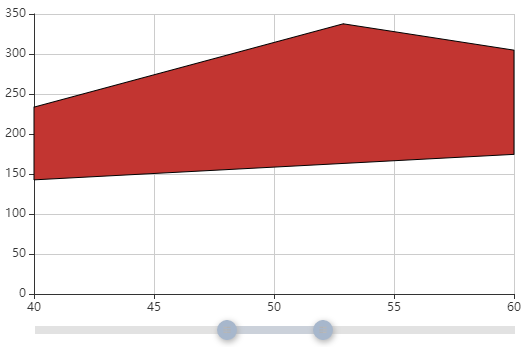
Here is an updated [js-fiddle example](https://jsfiddle.net/tmtron/k9aof5pd/34/), that uses the external [lineclip](https://github.com/mapbox/lineclip) library instead of `clipPointsByRect()`. This shows the correct result:
<!-- This issue is generated by echarts-issue-helper. DO NOT REMOVE -->
<!-- This issue is in English. DO NOT REMOVE -->
----------------------------------------------------------------
This is an automated message from the Apache Git Service.
To respond to the message, please log on to GitHub and use the
URL above to go to the specific comment.
For queries about this service, please contact Infrastructure at:
users@infra.apache.org
With regards,
Apache Git Services
---------------------------------------------------------------------
To unsubscribe, e-mail: dev-unsubscribe@echarts.apache.org
For additional commands, e-mail: dev-help@echarts.apache.org