You are viewing a plain text version of this content. The canonical link for it is here.
Posted to commits@airflow.apache.org by GitBox <gi...@apache.org> on 2021/04/25 22:17:22 UTC
[GitHub] [airflow] BenoitHanotte edited a comment on pull request #15423: UI: DAG Calendar View
BenoitHanotte edited a comment on pull request #15423:
URL: https://github.com/apache/airflow/pull/15423#issuecomment-826398624
> Technical: Overall looks good. In addition to the comments I left, the `calendar.js` file needs a linting pass. There were too many little issues to comment on.
>
> General: I still feel like we could make this view more data-rich. It would be great to do a heatmap of the ratio of successful and failed runs. After that, an indication of number of total runs a day. It may take some trial & error to get it both of those to look right within the same chart.
Thanks for the review, I applied `eslint` and addressed the comments.
I also made a change to use a heatmap to fill the day status, here is how it currently looks like:
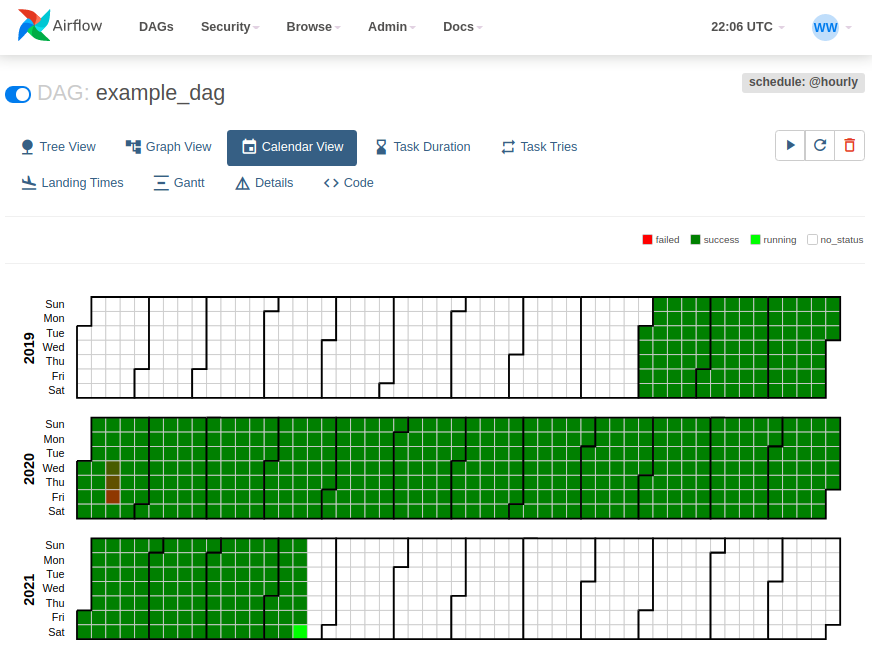
If there is at least one failure for a day, the color will be a mix of green and red according to the ratio of failed runs over the number of runs for that day (https://github.com/apache/airflow/pull/15423/files#diff-4bd7c1010027099f09d8d824b871bfc65c54843dc5283d3ec336182c623712b6R216)
On the screenshot above you can see 3 days with faile DAG runs: Jan 16 has 1 failed run, Jan 17 has 4 and Jan 18 has 8 failed DAG runs. The other days only have successful DAG runs, thus they are displayed as green.
Don't hesitate to let me know what you think! :)
--
This is an automated message from the Apache Git Service.
To respond to the message, please log on to GitHub and use the
URL above to go to the specific comment.
For queries about this service, please contact Infrastructure at:
users@infra.apache.org