You are viewing a plain text version of this content. The canonical link for it is here.
Posted to issues@hbase.apache.org by GitBox <gi...@apache.org> on 2021/06/10 17:34:52 UTC
[GitHub] [hbase] bharathv edited a comment on pull request #3371: HBASE-25984: Avoid premature reuse of sync futures in FSHLog [DRAFT]
bharathv edited a comment on pull request #3371:
URL: https://github.com/apache/hbase/pull/3371#issuecomment-858820006
> lockless but the likes of #putIfAbsent are not; they lock the 'bucket' the key is in.
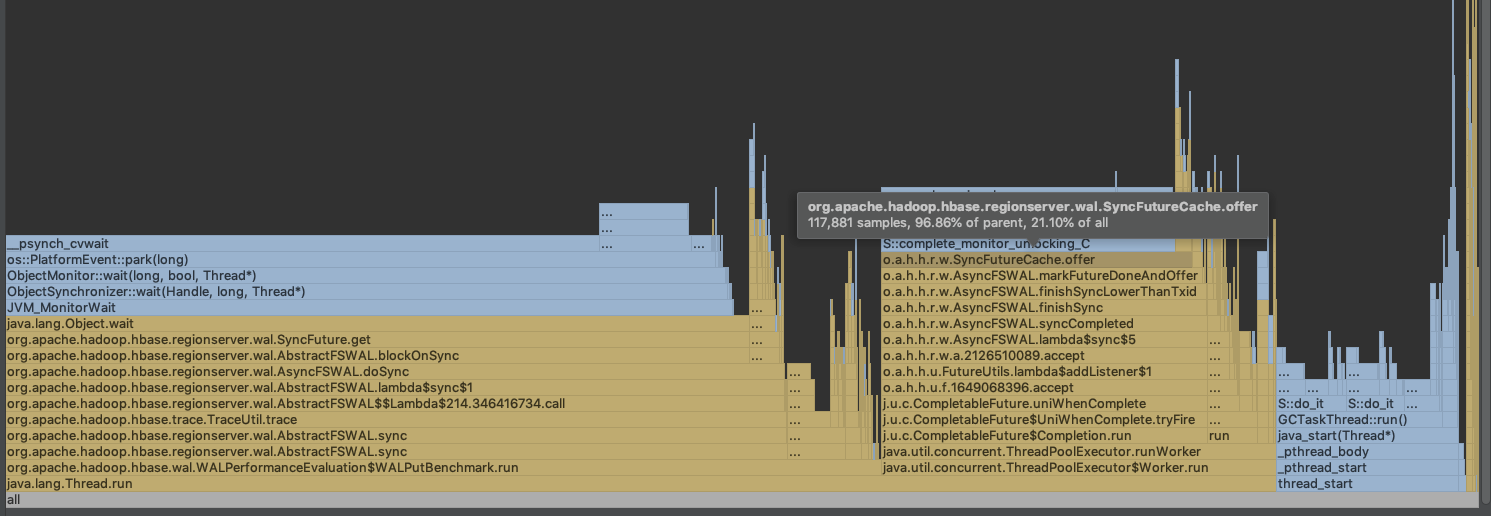
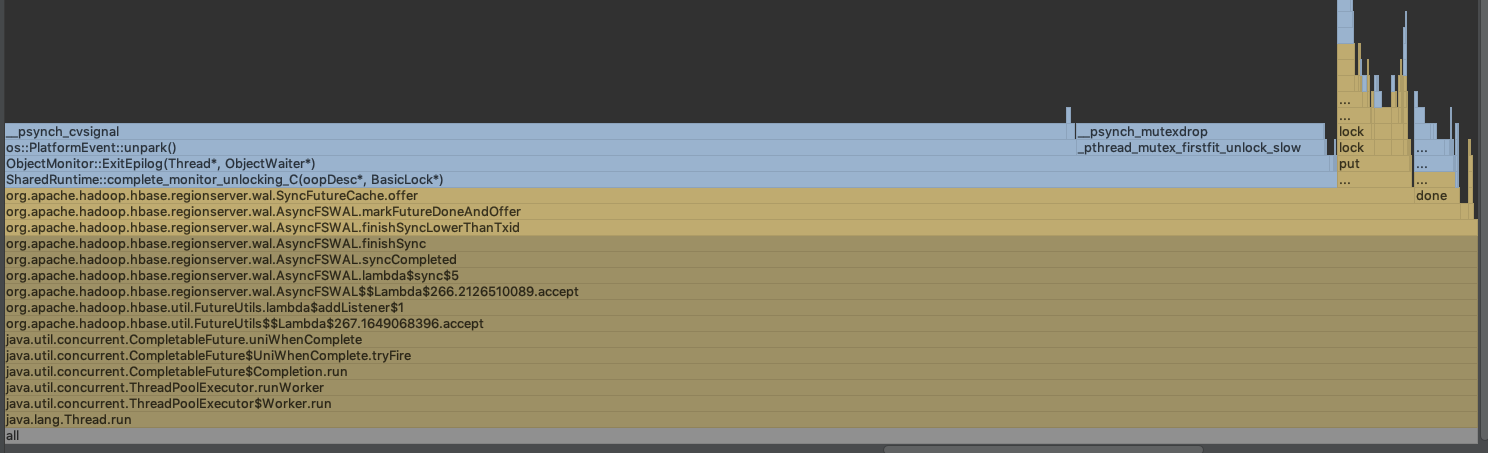
Nice catch, this coarse grained segment locking thing didn't cross my mind, thanks for the correction. I did run the WAL PE, here are the results, there is like ~1% drop for async WAL but performance was better in FSHLog case. Following are the results for the default AsyncFSWAL implementation. cc: @apurtell
**bin/hbase org.apache.hadoop.hbase.wal.WALPerformanceEvaluation -threads 256 -roll 10000 -verify**
**With Patch:**
```
-- Histograms ------------------------------------------------------------------
org.apache.hadoop.hbase.wal.WALPerformanceEvaluation.latencyHistogram.nanos
count = 10463419
min = 2490066
max = 69582818
mean = 4095968.77
stddev = 5892795.05
median = 3486862.00
75% <= 3664389.00
95% <= 4136964.00
98% <= 4732630.00
99% <= 33418377.00
99.9% <= 68981951.00
org.apache.hadoop.hbase.wal.WALPerformanceEvaluation.syncCountHistogram.countPerSync
count = 102788
min = 52
max = 103
mean = 101.87
stddev = 2.54
median = 102.00
75% <= 102.00
95% <= 102.00
98% <= 102.00
99% <= 103.00
99.9% <= 103.00
org.apache.hadoop.hbase.wal.WALPerformanceEvaluation.syncHistogram.nanos-between-syncs
count = 102788
min = 113865
max = 62777544
mean = 1628760.64
stddev = 3796429.99
median = 1391037.00
75% <= 1458844.00
95% <= 1647948.00
98% <= 1999632.00
99% <= 2492916.00
99.9% <= 62777544.00
-- Meters ----------------------------------------------------------------------
org.apache.hadoop.hbase.wal.WALPerformanceEvaluation.appendMeter.bytes
count = 5828294825
mean rate = 38614011.23 events/second
1-minute rate = 36650337.06 events/second
5-minute rate = 35737367.38 events/second
15-minute rate = 34778685.18 events/second
org.apache.hadoop.hbase.wal.WALPerformanceEvaluation.syncMeter.syncs
count = 102789
mean rate = 681.00 events/second
1-minute rate = 646.16 events/second
5-minute rate = 629.76 events/second
15-minute rate = 612.67 events/second
```
**Without patch:**
```
-- Histograms ------------------------------------------------------------------
org.apache.hadoop.hbase.wal.WALPerformanceEvaluation.latencyHistogram.nanos
count = 10836273
min = 2468323
max = 66655180
mean = 3893813.44
stddev = 5620979.14
median = 3247994.00
75% <= 3559261.00
95% <= 4026170.00
98% <= 4801295.00
99% <= 5688797.00
99.9% <= 66655180.00
org.apache.hadoop.hbase.wal.WALPerformanceEvaluation.syncCountHistogram.countPerSync
count = 106307
min = 52
max = 103
mean = 101.94
stddev = 1.70
median = 102.00
75% <= 102.00
95% <= 102.00
98% <= 102.00
99% <= 103.00
99.9% <= 103.00
org.apache.hadoop.hbase.wal.WALPerformanceEvaluation.syncHistogram.nanos-between-syncs
count = 106308
min = 126570
max = 54387876
mean = 1423180.52
stddev = 2174336.12
median = 1282380.00
75% <= 1421388.00
95% <= 1610647.00
98% <= 1897988.00
99% <= 2200189.00
99.9% <= 52882012.00
-- Meters ----------------------------------------------------------------------
org.apache.hadoop.hbase.wal.WALPerformanceEvaluation.appendMeter.bytes
count = 6035972275
mean rate = 39993180.92 events/second
1-minute rate = 38393898.28 events/second
5-minute rate = 36625545.98 events/second
15-minute rate = 35407434.87 events/second
org.apache.hadoop.hbase.wal.WALPerformanceEvaluation.syncMeter.syncs
count = 106308
mean rate = 704.37 events/second
1-minute rate = 676.34 events/second
5-minute rate = 644.42 events/second
15-minute rate = 622.68 events/second
```
It does show up on the profiler though.. doesn't seem like a great idea then?
--
This is an automated message from the Apache Git Service.
To respond to the message, please log on to GitHub and use the
URL above to go to the specific comment.
For queries about this service, please contact Infrastructure at:
users@infra.apache.org