You are viewing a plain text version of this content. The canonical link for it is here.
Posted to dev@echarts.apache.org by GitBox <gi...@apache.org> on 2018/10/10 10:31:21 UTC
[GitHub] yuanlove521 opened a new issue #9190: Echarts 4.x 在线定制,graph图表渲染时会有透明度
yuanlove521 opened a new issue #9190: Echarts 4.x 在线定制,graph图表渲染时会有透明度
URL: https://github.com/apache/incubator-echarts/issues/9190
在线定制内容:
图表:
柱状图
折线图
饼图
关系图
仪表盘
坐标系:
直角坐标系
组件:
标题
图例
提示框
标线
其他选项:
SVG渲染
正常引入
```
<!DOCTYPE html>
<html lang="en">
<head>
<meta charset="utf-8">
<meta http-equiv="X-UA-Compatible" content="IE=edge,chrome=1">
<meta name="viewport" content="width=device-width,initial-scale=1.0">
<link rel="icon" href="<%= BASE_URL %>favicon.ico">
<title>安全几何</title>
</head>
<body>
<script src="/echarts.min.js"></script>
<script src="/iconfont.js"></script>
<div id="app"></div>
</body>
</html>
```
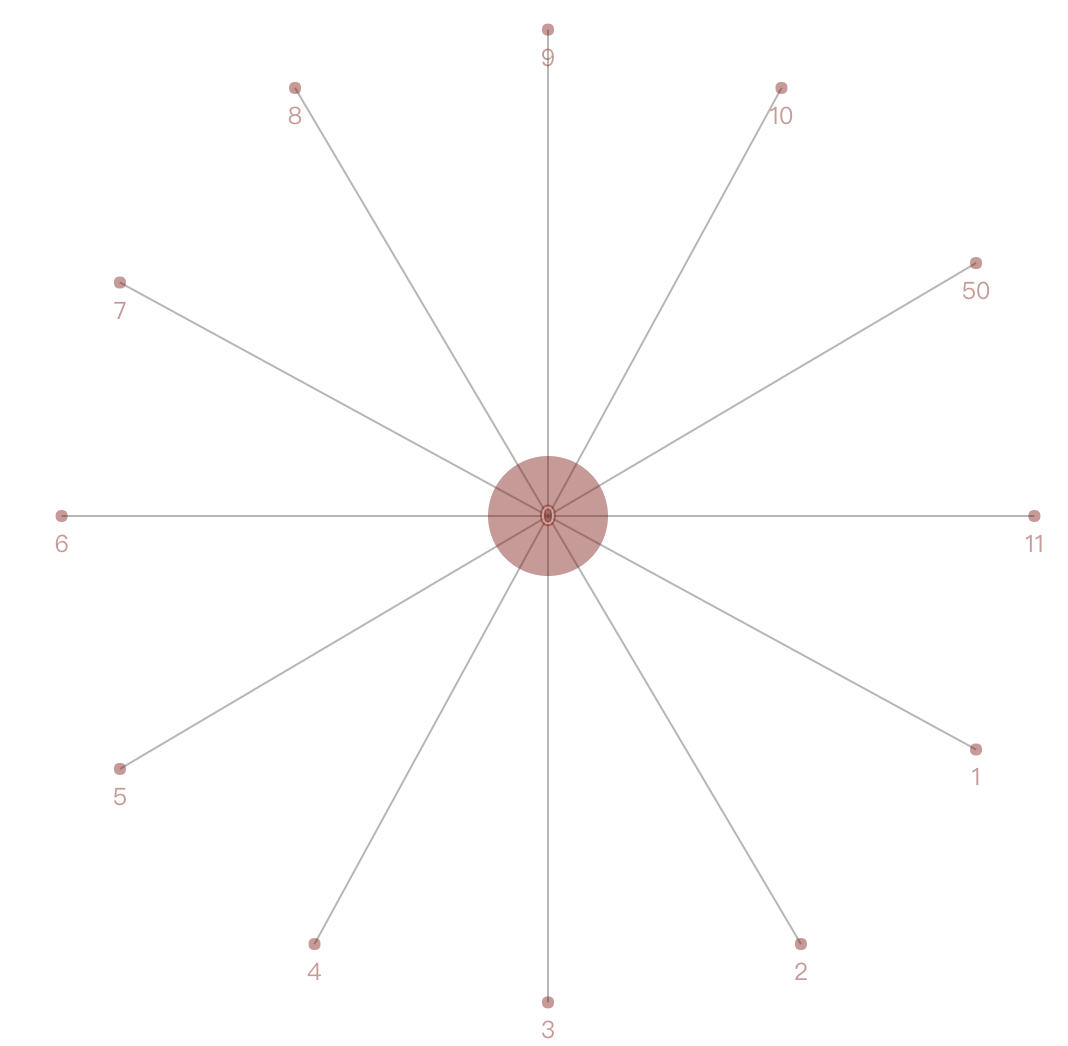
在渲染graph图表时出现透明度问题

鼠标经过元素之后又恢复正常了
----------------------------------------------------------------
This is an automated message from the Apache Git Service.
To respond to the message, please log on GitHub and use the
URL above to go to the specific comment.
For queries about this service, please contact Infrastructure at:
users@infra.apache.org
With regards,
Apache Git Services
---------------------------------------------------------------------
To unsubscribe, e-mail: dev-unsubscribe@echarts.apache.org
For additional commands, e-mail: dev-help@echarts.apache.org