You are viewing a plain text version of this content. The canonical link for it is here.
Posted to commits@kyuubi.apache.org by ya...@apache.org on 2021/12/23 03:32:06 UTC
[incubator-kyuubi] branch master updated: [KYUUBI #1607] [DOC] Add operation and backend service metrics in metrics doc
This is an automated email from the ASF dual-hosted git repository.
yao pushed a commit to branch master
in repository https://gitbox.apache.org/repos/asf/incubator-kyuubi.git
The following commit(s) were added to refs/heads/master by this push:
new 3ffb12d [KYUUBI #1607] [DOC] Add operation and backend service metrics in metrics doc
3ffb12d is described below
commit 3ffb12de24319aa84b57b7cbc1817f1354c1b2ab
Author: zhenjiaguo <zh...@163.com>
AuthorDate: Thu Dec 23 11:31:57 2021 +0800
[KYUUBI #1607] [DOC] Add operation and backend service metrics in metrics doc
<!--
Thanks for sending a pull request!
Here are some tips for you:
1. If this is your first time, please read our contributor guidelines: https://kyuubi.readthedocs.io/en/latest/community/contributions.html
2. If the PR is related to an issue in https://github.com/apache/incubator-kyuubi/issues, add '[KYUUBI #XXXX]' in your PR title, e.g., '[KYUUBI #XXXX] Your PR title ...'.
3. If the PR is unfinished, add '[WIP]' in your PR title, e.g., '[WIP][KYUUBI #XXXX] Your PR title ...'.
-->
### _Why are the changes needed?_
<!--
Please clarify why the changes are needed. For instance,
1. If you add a feature, you can talk about the use case of it.
2. If you fix a bug, you can clarify why it is a bug.
-->
Add operation and backend service metrics doc.
### _How was this patch tested?_
- [ ] Add some test cases that check the changes thoroughly including negative and positive cases if possible
- [x] Add screenshots for manual tests if appropriate
- [ ] [Run test](https://kyuubi.readthedocs.io/en/latest/develop_tools/testing.html#running-tests) locally before make a pull request
Closes #1607 from zhenjiaguo/add_be_metric_doc.
Closes #1607
e10bf146 [zhenjiaguo] Comment
0062f3d8 [zhenjiaguo] Metric format adjustment
af84534c [zhenjiaguo] Add metrics version compatibility description
c6f9eb26 [zhenjiaguo] Add operation and backend service method metric info doc
Authored-by: zhenjiaguo <zh...@163.com>
Signed-off-by: Kent Yao <ya...@apache.org>
---
docs/monitor/metrics.md | 42 +++++++++++++++++++++++++++++++++++-------
1 file changed, 35 insertions(+), 7 deletions(-)
diff --git a/docs/monitor/metrics.md b/docs/monitor/metrics.md
index d8d52f6..d36f05a 100644
--- a/docs/monitor/metrics.md
+++ b/docs/monitor/metrics.md
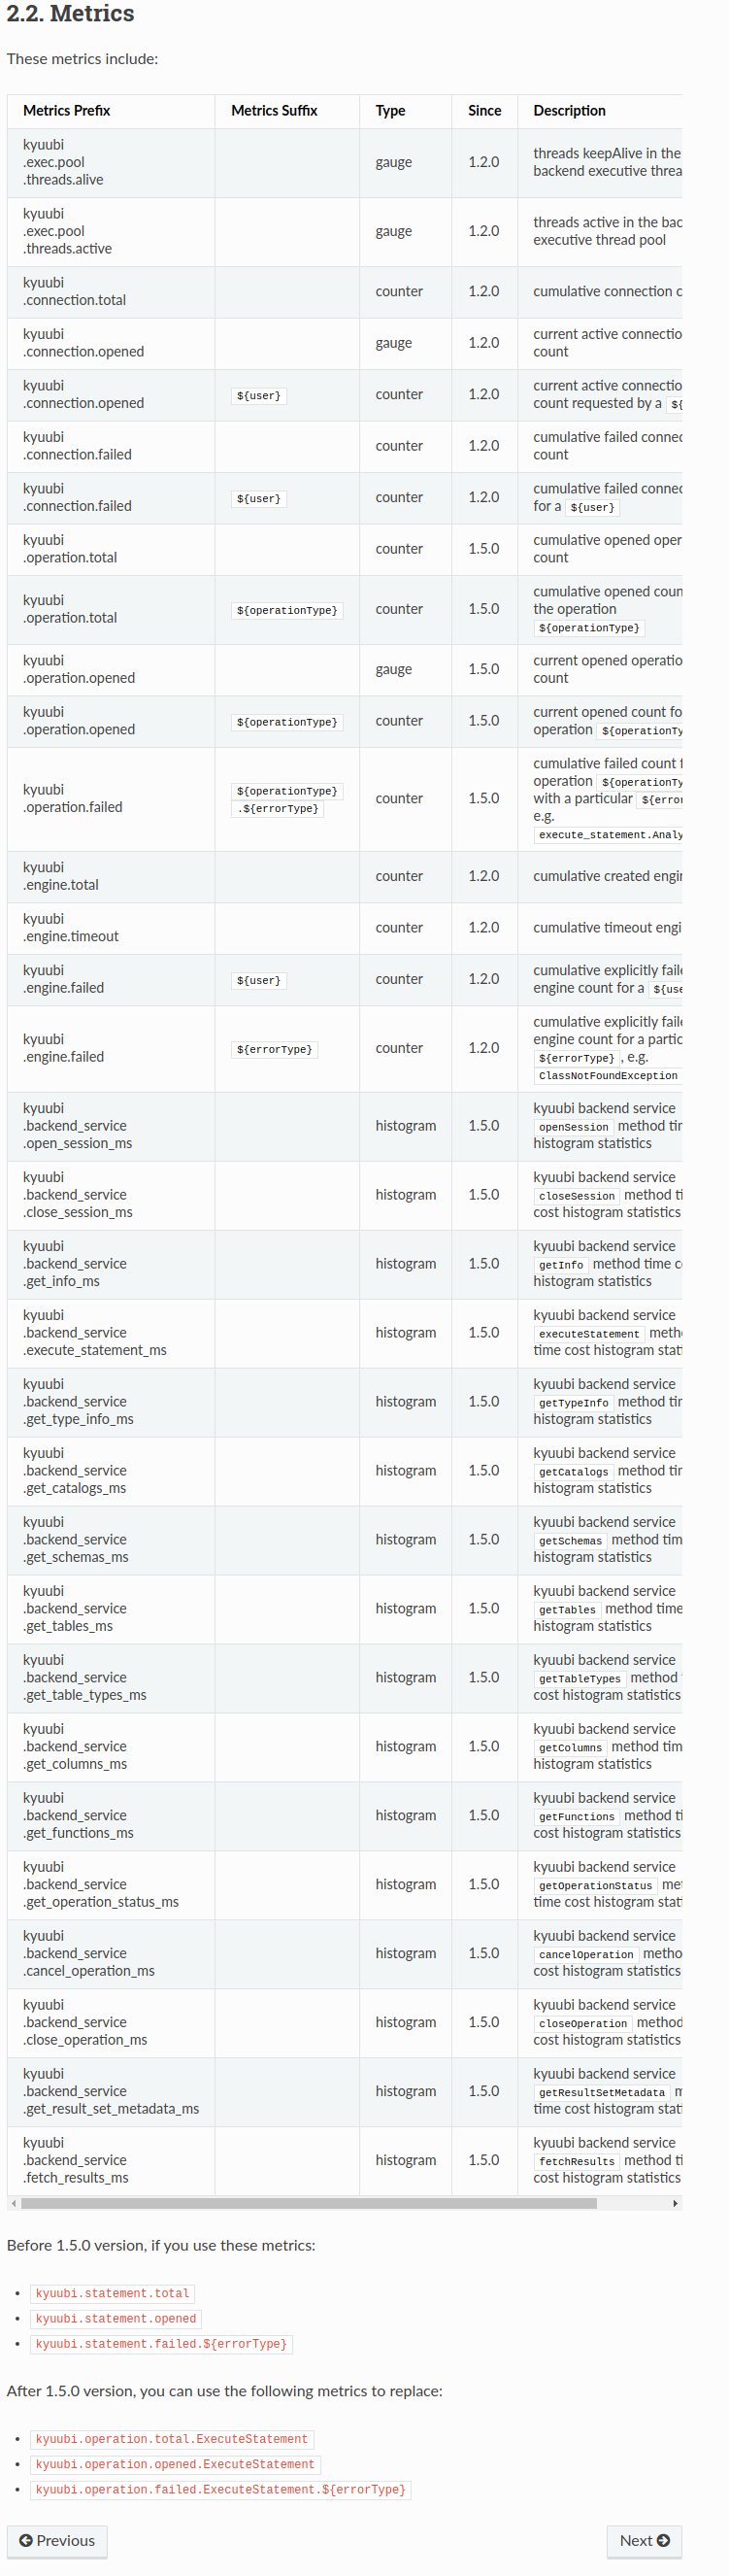
@@ -42,17 +42,45 @@ These metrics include:
Metrics Prefix | Metrics Suffix | Type | Since | Description
---|---|---|---|---
-kyuubi<br/>.exec.pool<br/>.threads.alive ||gauge|1.2.0|<div style='width: 150pt;word-wrap: break-word;white-space: normal'> threads keepAlive in the backend executive thread pool</div>
-kyuubi<br/>.exec.pool<br/>.threads.active ||gauge|1.2.0|<div style='width: 150pt;word-wrap: break-word;white-space: normal'> threads active in the backend executive thread pool</div>
+kyuubi<br/>.exec.pool<br/>.threads.alive | | gauge | 1.2.0 |<div style='width: 150pt;word-wrap: break-word;white-space: normal'> threads keepAlive in the backend executive thread pool</div>
+kyuubi<br/>.exec.pool<br/>.threads.active | | gauge | 1.2.0 |<div style='width: 150pt;word-wrap: break-word;white-space: normal'> threads active in the backend executive thread pool</div>
kyuubi<br/>.connection.total | | counter | 1.2.0 |<div style='width: 150pt;word-wrap: break-word;white-space: normal'> cumulative connection count</div>
kyuubi<br/>.connection.opened | | gauge | 1.2.0 |<div style='width: 150pt;word-wrap: break-word;white-space: normal'> current active connection count</div>
-kyuubi<br/>.connection.opened | `${user}` | counter | 1.2.0 |<div style='width: 150pt;word-wrap: break-word;white-space: normal'> cumulative connections requested by a `${user}`</div>
+kyuubi<br/>.connection.opened | `${user}` | counter | 1.2.0 |<div style='width: 150pt;word-wrap: break-word;white-space: normal'> current active connections count requested by a `${user}`</div>
kyuubi<br/>.connection.failed | | counter | 1.2.0 |<div style='width: 150pt;word-wrap: break-word;white-space: normal'> cumulative failed connection count</div>
-kyuubi<br/>.connection.failed | `${user}` | counter | 1.2.0 |<div style='width: 150pt;word-wrap: break-word;white-space: normal'> cumulative failed connections for a `${user}`</div>
-kyuubi<br/>.statement.total | | counter | 1.2.0 |<div style='width: 150pt;word-wrap: break-word;white-space: normal'> cumulative opened statement count</div>
-kyuubi<br/>.statement.opened | | counter | 1.2.0 |<div style='width: 150pt;word-wrap: break-word;white-space: normal'> current opened statement count</div>
-kyuubi<br/>.statement.failed | `${errorType}` | counter | 1.2.0 |<div style='width: 150pt;word-wrap: break-word;white-space: normal'> cumulative failed statement for a particular `${errorType}`, e.g. `AnalysisException`</div>
+kyuubi<br/>.connection.failed | `${user}` | counter | 1.2.0 |<div style='width: 150pt;word-wrap: break-word;white-space: normal'> cumulative failed connections for a `${user}`</div>
+kyuubi<br/>.operation.total | | counter | 1.5.0 |<div style='width: 150pt;word-wrap: break-word;white-space: normal'> cumulative opened operation count</div>
+kyuubi<br/>.operation.total | `${operationType}` | counter | 1.5.0 |<div style='width: 150pt;word-wrap: break-word;white-space: normal'> cumulative opened count for the operation `${operationType}`</div>
+kyuubi<br/>.operation.opened | | gauge | 1.5.0 |<div style='width: 150pt;word-wrap: break-word;white-space: normal'> current opened operation count</div>
+kyuubi<br/>.operation.opened | `${operationType}` | counter | 1.5.0 |<div style='width: 150pt;word-wrap: break-word;white-space: normal'> current opened count for the operation `${operationType}`</div>
+kyuubi<br/>.operation.failed | `${operationType}`<br/>`.${errorType}` | counter | 1.5.0 |<div style='width: 150pt;word-wrap: break-word;white-space: normal'> cumulative failed count for the operation `${operationType}` with a particular `${errorType}`, e.g. `execute_statement.AnalysisException`</div>
kyuubi<br/>.engine.total | | counter | 1.2.0 |<div style='width: 150pt;word-wrap: break-word;white-space: normal'> cumulative created engines</div>
kyuubi<br/>.engine.timeout | | counter | 1.2.0 |<div style='width: 150pt;word-wrap: break-word;white-space: normal'> cumulative timeout engines</div>
kyuubi<br/>.engine.failed | `${user}` | counter | 1.2.0 |<div style='width: 150pt;word-wrap: break-word;white-space: normal'> cumulative explicitly failed engine count for a `${user}`</div>
kyuubi<br/>.engine.failed | `${errorType}` | counter | 1.2.0 |<div style='width: 150pt;word-wrap: break-word;white-space: normal'> cumulative explicitly failed engine count for a particular `${errorType}`, e.g. `ClassNotFoundException`</div>
+kyuubi<br/>.backend_service<br/>.open_session_ms | | histogram | 1.5.0 |<div style='width: 150pt;word-wrap: break-word;white-space: normal'> kyuubi backend service `openSession` method time cost histogram statistics </div>
+kyuubi<br/>.backend_service<br/>.close_session_ms | | histogram | 1.5.0 |<div style='width: 150pt;word-wrap: break-word;white-space: normal'> kyuubi backend service `closeSession` method time cost histogram statistics </div>
+kyuubi<br/>.backend_service<br/>.get_info_ms | | histogram | 1.5.0 |<div style='width: 150pt;word-wrap: break-word;white-space: normal'> kyuubi backend service `getInfo` method time cost histogram statistics </div>
+kyuubi<br/>.backend_service<br/>.execute_statement_ms | | histogram | 1.5.0 |<div style='width: 150pt;word-wrap: break-word;white-space: normal'> kyuubi backend service `executeStatement` method time cost histogram statistics </div>
+kyuubi<br/>.backend_service<br/>.get_type_info_ms | | histogram | 1.5.0 |<div style='width: 150pt;word-wrap: break-word;white-space: normal'> kyuubi backend service `getTypeInfo` method time cost histogram statistics </div>
+kyuubi<br/>.backend_service<br/>.get_catalogs_ms | | histogram | 1.5.0 |<div style='width: 150pt;word-wrap: break-word;white-space: normal'> kyuubi backend service `getCatalogs` method time cost histogram statistics </div>
+kyuubi<br/>.backend_service<br/>.get_schemas_ms | | histogram | 1.5.0 |<div style='width: 150pt;word-wrap: break-word;white-space: normal'> kyuubi backend service `getSchemas` method time cost histogram statistics </div>
+kyuubi<br/>.backend_service<br/>.get_tables_ms | | histogram | 1.5.0 |<div style='width: 150pt;word-wrap: break-word;white-space: normal'> kyuubi backend service `getTables` method time cost histogram statistics </div>
+kyuubi<br/>.backend_service<br/>.get_table_types_ms | | histogram | 1.5.0 |<div style='width: 150pt;word-wrap: break-word;white-space: normal'> kyuubi backend service `getTableTypes` method time cost histogram statistics </div>
+kyuubi<br/>.backend_service<br/>.get_columns_ms | | histogram | 1.5.0 |<div style='width: 150pt;word-wrap: break-word;white-space: normal'> kyuubi backend service `getColumns` method time cost histogram statistics </div>
+kyuubi<br/>.backend_service<br/>.get_functions_ms | | histogram | 1.5.0 |<div style='width: 150pt;word-wrap: break-word;white-space: normal'> kyuubi backend service `getFunctions` method time cost histogram statistics </div>
+kyuubi<br/>.backend_service<br/>.get_operation_status_ms | | histogram | 1.5.0 |<div style='width: 150pt;word-wrap: break-word;white-space: normal'> kyuubi backend service `getOperationStatus` method time cost histogram statistics </div>
+kyuubi<br/>.backend_service<br/>.cancel_operation_ms | | histogram | 1.5.0 |<div style='width: 150pt;word-wrap: break-word;white-space: normal'> kyuubi backend service `cancelOperation` method time cost histogram statistics </div>
+kyuubi<br/>.backend_service<br/>.close_operation_ms | | histogram | 1.5.0 |<div style='width: 150pt;word-wrap: break-word;white-space: normal'> kyuubi backend service `closeOperation` method time cost histogram statistics </div>
+kyuubi<br/>.backend_service<br/>.get_result_set_metadata_ms | | histogram | 1.5.0 |<div style='width: 150pt;word-wrap: break-word;white-space: normal'> kyuubi backend service `getResultSetMetadata` method time cost histogram statistics </div>
+kyuubi<br/>.backend_service<br/>.fetch_results_ms | | histogram | 1.5.0 |<div style='width: 150pt;word-wrap: break-word;white-space: normal'> kyuubi backend service `fetchResults` method time cost histogram statistics </div>
+
+Before v1.5.0, if you use these metrics:
+- `kyuubi.statement.total`
+- `kyuubi.statement.opened`
+- `kyuubi.statement.failed.${errorType}`
+
+Since v1.5.0, you can use the following metrics to replace:
+- `kyuubi.operation.total.ExecuteStatement`
+- `kyuubi.operation.opened.ExecuteStatement`
+- `kyuubi.operation.failed.ExecuteStatement.${errorType}`