You are viewing a plain text version of this content. The canonical link for it is here.
Posted to commits@echarts.apache.org by GitBox <gi...@apache.org> on 2021/10/27 13:42:12 UTC
[GitHub] [echarts] spoojaj opened a new issue #15960: Create Horizontal Bar chart using both axis as type 'Value'.
spoojaj opened a new issue #15960:
URL: https://github.com/apache/echarts/issues/15960


   ### Version
   5.2.2-rc.1

   ### Steps to reproduce
   1) take any horizontal bar chart example from E-chart examples
   2) make y axis as type 'value'
   3) bars will be verticle.

   ### What is expected?
   should get the horizontal bar chart with y axis as type 'value'.

   ### What is actually happening?
   getting vertical bar chart if we use y axis as type 'value'

   <!-- This issue is generated by echarts-issue-helper. DO NOT REMOVE -->
   <!-- This issue is in English. DO NOT REMOVE -->


--
This is an automated message from the Apache Git Service.
To respond to the message, please log on to GitHub and use the
URL above to go to the specific comment.

To unsubscribe, e-mail: commits-unsubscribe@echarts.apache.org

For queries about this service, please contact Infrastructure at:
users@infra.apache.org


---------------------------------------------------------------------
To unsubscribe, e-mail: commits-unsubscribe@echarts.apache.org
For additional commands, e-mail: commits-help@echarts.apache.org
[GitHub] [echarts] ragava28 commented on issue #15960: Create Horizontal Bar chart using both axis as type 'Value'.
Posted by GitBox <gi...@apache.org>.
ragava28 commented on issue #15960:
URL: https://github.com/apache/echarts/issues/15960#issuecomment-954761169
@Ovilia ,
We are trying to to build some thing like below where x & y axis are continues numbers.
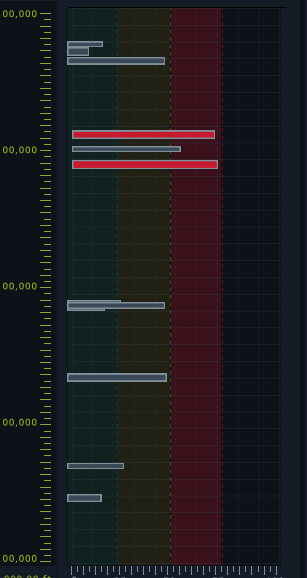
Our data in x & y axis is not discreate (like category) .
So for that we tried below configuration .
==========================
option = {
title: {
text: 'Depth Vs Level Of Concern'
},
tooltip: {
trigger: 'axis',
axisPointer: {
type: 'shadow'
}
},
xAxis: {
type: 'value',
name : 'Level of concern'
},
yAxis: {
type: 'value',
name : 'Depth'
},
series: [
{
type: 'bar',
data: [[40,100], [50,200], [60,500], [60,800]] // [xAxis, yAxis]
}
]
};
==========================
this is drawing bars on xAxis always , how do we change orientation of the these bars so that they are horizontally aligned on Yaxis with out using Category axis .
--
This is an automated message from the Apache Git Service.
To respond to the message, please log on to GitHub and use the
URL above to go to the specific comment.
To unsubscribe, e-mail: commits-unsubscribe@echarts.apache.org
For queries about this service, please contact Infrastructure at:
users@infra.apache.org
---------------------------------------------------------------------
To unsubscribe, e-mail: commits-unsubscribe@echarts.apache.org
For additional commands, e-mail: commits-help@echarts.apache.org
[GitHub] [echarts] Ovilia commented on issue #15960: Create Horizontal Bar chart using both axis as type 'Value'.
Posted by GitBox <gi...@apache.org>.
Ovilia commented on issue #15960:
URL: https://github.com/apache/echarts/issues/15960#issuecomment-954623546


   In your demo, the yAxis is typed in `'category'` rather than value. It has no difference where the data is `data: [1, 5, 10, 40, 55, 59, 60]` or `data: ['1', '5', '10', '40', '55', '59', '60']`. They both give you a category yAxis.


--
This is an automated message from the Apache Git Service.
To respond to the message, please log on to GitHub and use the
URL above to go to the specific comment.

To unsubscribe, e-mail: commits-unsubscribe@echarts.apache.org

For queries about this service, please contact Infrastructure at:
users@infra.apache.org


---------------------------------------------------------------------
To unsubscribe, e-mail: commits-unsubscribe@echarts.apache.org
For additional commands, e-mail: commits-help@echarts.apache.org
[GitHub] [echarts] spoojaj commented on issue #15960: Create Horizontal Bar chart using both axis as type 'Value'.
Posted by GitBox <gi...@apache.org>.
spoojaj commented on issue #15960:
URL: https://github.com/apache/echarts/issues/15960#issuecomment-954631906


   Yes, I want yAxis and xAxis both typed in 'value', n still want horizontal chart.

   lets say , in the below E-chart example yAxis is typed as 'category'

   https://echarts.apache.org/examples/en/editor.html?c=bar-y-category

    yAxis: {
       type: 'category',
       data: ['Brazil', 'Indonesia', 'USA', 'India', 'China', 'World']
     },

   but instead if we change yAxis to

     yAxis: {
       type: 'value',
       data: [1,2,5,7,10]
     },

   Horizontal bars becomes vertical. our requirement is to have both axis typed 'value' n still want horizontal chart.


--
This is an automated message from the Apache Git Service.
To respond to the message, please log on to GitHub and use the
URL above to go to the specific comment.

To unsubscribe, e-mail: commits-unsubscribe@echarts.apache.org

For queries about this service, please contact Infrastructure at:
users@infra.apache.org


---------------------------------------------------------------------
To unsubscribe, e-mail: commits-unsubscribe@echarts.apache.org
For additional commands, e-mail: commits-help@echarts.apache.org
[GitHub] [echarts] echarts-bot[bot] commented on issue #15960: Create Horizontal Bar chart using both axis as type 'Value'.
Posted by GitBox <gi...@apache.org>.
echarts-bot[bot] commented on issue #15960:
URL: https://github.com/apache/echarts/issues/15960#issuecomment-952943228


   Hi! We've received your issue and please be patient to get responded. 🎉
   The average response time is expected to be within one day for weekdays.

   In the meanwhile, please make sure that it contains **a minimum reproducible demo** and necessary **images** to illustrate. Otherwise, our committers will ask you to do so.

   *A minimum reproducible demo* should contain as little data and components as possible but can still illustrate your problem. This is the best way for us to reproduce it and solve the problem faster.

   You may also check out the [API](https://echarts.apache.org/api.html) and [chart option](https://echarts.apache.org/option.html) to get the answer.

   If you don't get helped for a long time (over a week) or have an urgent question to ask, you may also send an email to dev@echarts.apache.org. Please attach the issue link if it's a technical question.

   If you are interested in the project, you may also subscribe to our [mailing list](https://echarts.apache.org/maillist.html).

   Have a nice day! 🍵


--
This is an automated message from the Apache Git Service.
To respond to the message, please log on to GitHub and use the
URL above to go to the specific comment.

To unsubscribe, e-mail: commits-unsubscribe@echarts.apache.org

For queries about this service, please contact Infrastructure at:
users@infra.apache.org


---------------------------------------------------------------------
To unsubscribe, e-mail: commits-unsubscribe@echarts.apache.org
For additional commands, e-mail: commits-help@echarts.apache.org
[GitHub] [echarts] spoojaj commented on issue #15960: Create Horizontal Bar chart using both axis as type 'Value'.
Posted by GitBox <gi...@apache.org>.
spoojaj commented on issue #15960:
URL: https://github.com/apache/echarts/issues/15960#issuecomment-953047626


   Please check the example below in which I am using category axis to get horizontal chart.

   https://codepen.io/sathepooja/pen/PoKjYoe?editors=0010


--
This is an automated message from the Apache Git Service.
To respond to the message, please log on to GitHub and use the
URL above to go to the specific comment.

To unsubscribe, e-mail: commits-unsubscribe@echarts.apache.org

For queries about this service, please contact Infrastructure at:
users@infra.apache.org


---------------------------------------------------------------------
To unsubscribe, e-mail: commits-unsubscribe@echarts.apache.org
For additional commands, e-mail: commits-help@echarts.apache.org
[GitHub] [echarts] ragava28 edited a comment on issue #15960: Create Horizontal Bar chart using both axis as type 'Value'.
Posted by GitBox <gi...@apache.org>.
ragava28 edited a comment on issue #15960:
URL: https://github.com/apache/echarts/issues/15960#issuecomment-954761169
@Ovilia ,
We are trying to to build some thing like below where x & y axis are continues numbers.

Our data in x & y axis is not discreate (like category) .
So for that we tried below configuration .
==========================
>
> option = {
> title: {
> text: 'Depth Vs Level Of Concern'
> },
> tooltip: {
> trigger: 'axis',
> axisPointer: {
> type: 'shadow'
> }
> },
> xAxis: {
> type: 'value',
> name : 'Level of concern'
> },
> yAxis: {
> type: 'value',
> name : 'Depth'
> },
> series: [
> {
> type: 'bar',
> data: [[40,100], [50,200], [60,500], [60,800]] // [xAxis, yAxis]
> }
> ]
> };
==========================
this is drawing bars on xAxis always , how do we change orientation of the these bars so that they are horizontally aligned on Yaxis with out using Category axis .
--
This is an automated message from the Apache Git Service.
To respond to the message, please log on to GitHub and use the
URL above to go to the specific comment.
To unsubscribe, e-mail: commits-unsubscribe@echarts.apache.org
For queries about this service, please contact Infrastructure at:
users@infra.apache.org
---------------------------------------------------------------------
To unsubscribe, e-mail: commits-unsubscribe@echarts.apache.org
For additional commands, e-mail: commits-help@echarts.apache.org
[GitHub] [echarts] Ovilia commented on issue #15960: Create Horizontal Bar chart using both axis as type 'Value'.
Posted by GitBox <gi...@apache.org>.
Ovilia commented on issue #15960:
URL: https://github.com/apache/echarts/issues/15960#issuecomment-955873560


   Custom series is required. See [examples](https://echarts.apache.org/examples/en/index.html#chart-type-custom) and [doc](https://echarts.apache.org/en/option.html#series-custom).


--
This is an automated message from the Apache Git Service.
To respond to the message, please log on to GitHub and use the
URL above to go to the specific comment.

To unsubscribe, e-mail: commits-unsubscribe@echarts.apache.org

For queries about this service, please contact Infrastructure at:
users@infra.apache.org


---------------------------------------------------------------------
To unsubscribe, e-mail: commits-unsubscribe@echarts.apache.org
For additional commands, e-mail: commits-help@echarts.apache.org