You are viewing a plain text version of this content. The canonical link for it is here.
Posted to dev@echarts.apache.org by GitBox <gi...@apache.org> on 2018/07/10 08:44:43 UTC
[GitHub] peacejj edited a comment on issue #7412: 双Y轴柱状+折线图,设置yaxis的min、max后柱状图柱条下边界超越X轴
peacejj edited a comment on issue #7412: 双Y轴柱状+折线图,设置yaxis的min、max后柱状图柱条下边界超越X轴
URL: https://github.com/apache/incubator-echarts/issues/7412#issuecomment-403744300
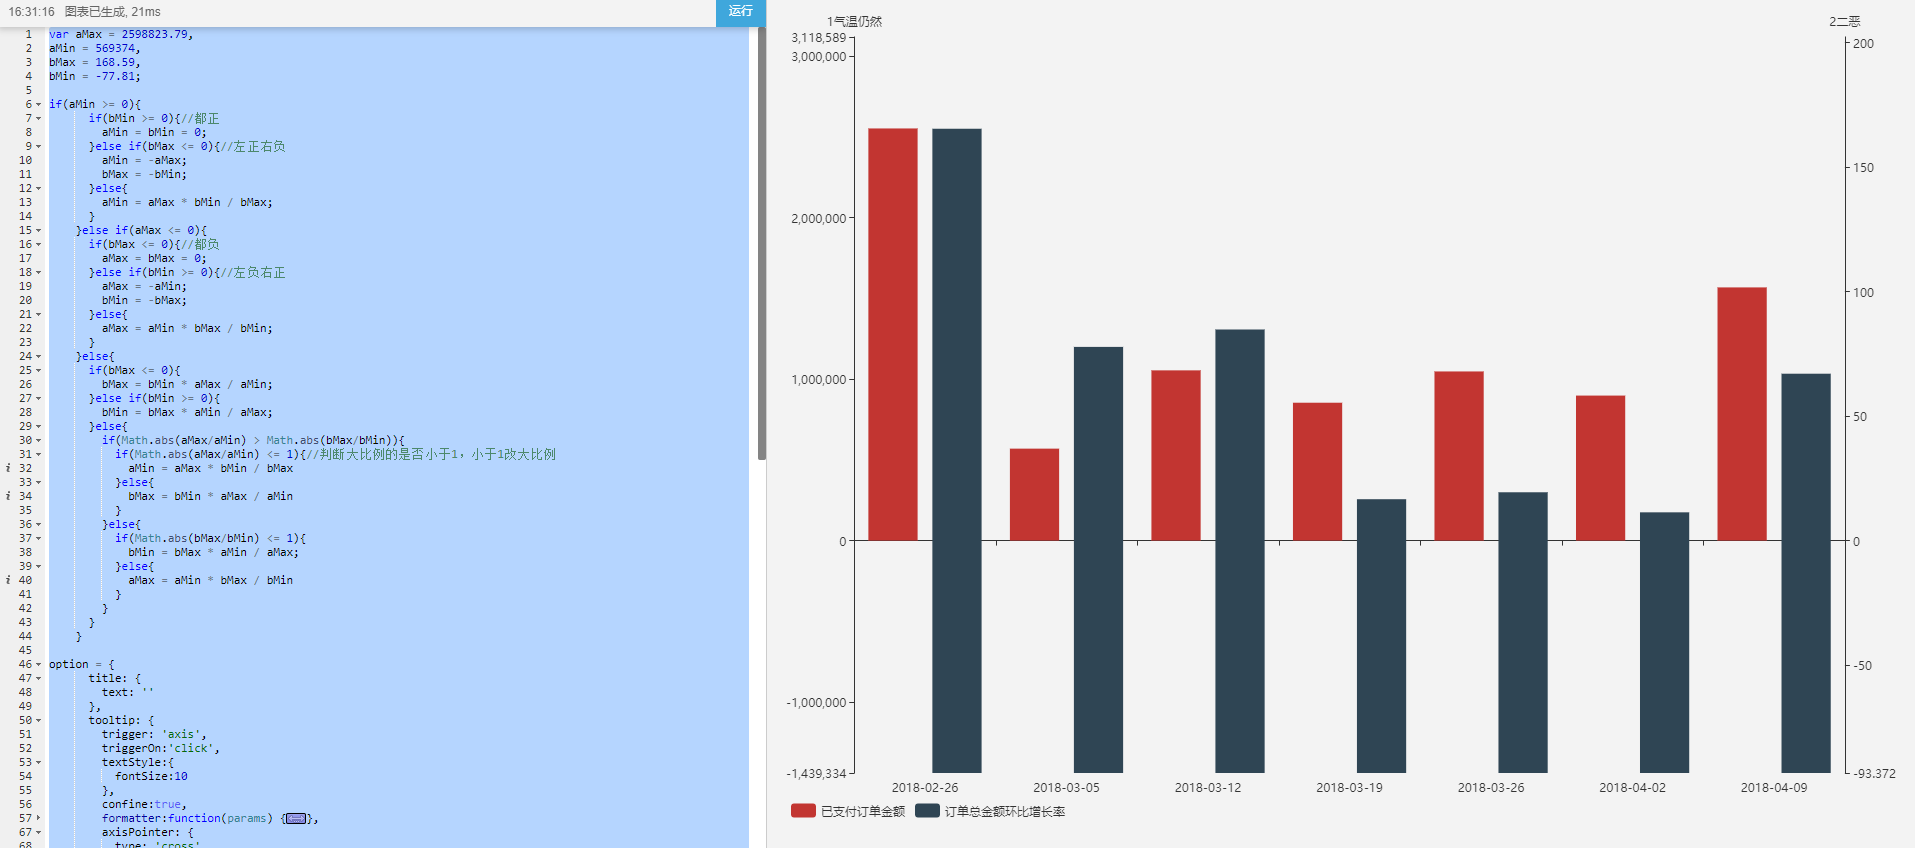
下面这种情况第一个y轴从0开始,第二个是从最底层开始,有误
var aMax = 2598823.79,
aMin = 569374,
bMax = 168.59,
bMin = -77.81;
if(aMin >= 0){
if(bMin >= 0){//都正
aMin = bMin = 0;
}else if(bMax <= 0){//左正右负
aMin = -aMax;
bMax = -bMin;
}else{
aMin = aMax * bMin / bMax;
}
}else if(aMax <= 0){
if(bMax <= 0){//都负
aMax = bMax = 0;
}else if(bMin >= 0){//左负右正
aMax = -aMin;
bMin = -bMax;
}else{
aMax = aMin * bMax / bMin;
}
}else{
if(bMax <= 0){
bMax = bMin * aMax / aMin;
}else if(bMin >= 0){
bMin = bMax * aMin / aMax;
}else{
if(Math.abs(aMax/aMin) > Math.abs(bMax/bMin)){
if(Math.abs(aMax/aMin) <= 1){//判断大比例的是否小于1,小于1改大比例
aMin = aMax * bMin / bMax
}else{
bMax = bMin * aMax / aMin
}
}else{
if(Math.abs(bMax/bMin) <= 1){
bMin = bMax * aMin / aMax;
}else{
aMax = aMin * bMax / bMin
}
}
}
}
option = {
title: {
text: ''
},
tooltip: {
trigger: 'axis',
triggerOn:'click',
textStyle:{
fontSize:10
},
confine:true,
formatter:function(params) {
let relVal = params[0].name;
for (let i = 0, l = params.length; i < l; i++) {
relVal += '<br/>' + params[i].marker + params[i].seriesName + ' : ' + params[i].value;
if(params[i].seriesName.match(RegExp(/率/))){
relVal += "%"
}
}
return relVal;
},
axisPointer: {
type: 'cross',
label: {
precision:2,
},
crossStyle: {
color: '#999'
}
}
},
grid: {
left:'10',
right:'10',
containLabel:true,
bottom: '40',
top:'30'
},
legend: {
bottom:'10',
left:'10',
right:'10',
type:'scroll'
},
dataZoom : [{
show: false,
start: 0,
end: 100,
}, {
type: 'inside',
start: 94,
end: 100
}],
xAxis: [
{
type: 'category',
data: ["2018-02-26", "2018-03-05", "2018-03-12", "2018-03-19", "2018-03-26", "2018-04-02", "2018-04-09"],
axisLabel: {
formatter: function (name) {
return (name.length > 10 ? (name.slice(0,10)+"...") : name );
},
}
}
],
yAxis: [
{
type: 'value',
max:(aMax*1.2).toFixed(0),
min:(aMin*1.2).toFixed(0),
name: '1气温仍然',
splitLine:{show:false},
nameGap:10
},
{
type: 'value',
max:(bMax*1.2).toFixed(4),
min:(bMin*1.2).toFixed(4),
name: '2二恶',
splitLine:{show:false},
axisLine : {onZero: true,onZeroAxisIndex:0},
nameGap:10
}
],
series: [
{name: "已支付订单金额", data: ["2552275.09", "569374.41", "1054162.30", "853733.58", "1047437.88", "897950.59", "1567854.86"], type: "bar", yAxisIndex: 0},
{name: "订单总金额环比增长率", data: ["165.45", "77.81", "84.80", "16.62", "19.41", "11.35", "67.04"], type: "bar", yAxisIndex: 1},
]
};
----------------------------------------------------------------
This is an automated message from the Apache Git Service.
To respond to the message, please log on GitHub and use the
URL above to go to the specific comment.
For queries about this service, please contact Infrastructure at:
users@infra.apache.org
With regards,
Apache Git Services
---------------------------------------------------------------------
To unsubscribe, e-mail: dev-unsubscribe@echarts.apache.org
For additional commands, e-mail: dev-help@echarts.apache.org