You are viewing a plain text version of this content. The canonical link for it is here.
Posted to commits@echarts.apache.org by GitBox <gi...@apache.org> on 2020/08/06 07:23:07 UTC
[GitHub] [incubator-echarts] easonyq commented on issue #13031: toolbox optionToContent 自定义 dataView,点刷新,optionToContent回调中拿到的series数据遗失
easonyq commented on issue #13031:
URL: https://github.com/apache/incubator-echarts/issues/13031#issuecomment-669755948
的确如 @plainheart 所说,实际上 `optionToContent` 和 `contentToOption` 是必须配对使用的,而在你的例子中你只使用了 `optionToContent` 而没有使用 `contentToOption`,使得点击“刷新”时获取不到最新的 dataView 转化而成的 option,因此丢失了一条数据。再往后的一列 undefined 也是相同原因所致。
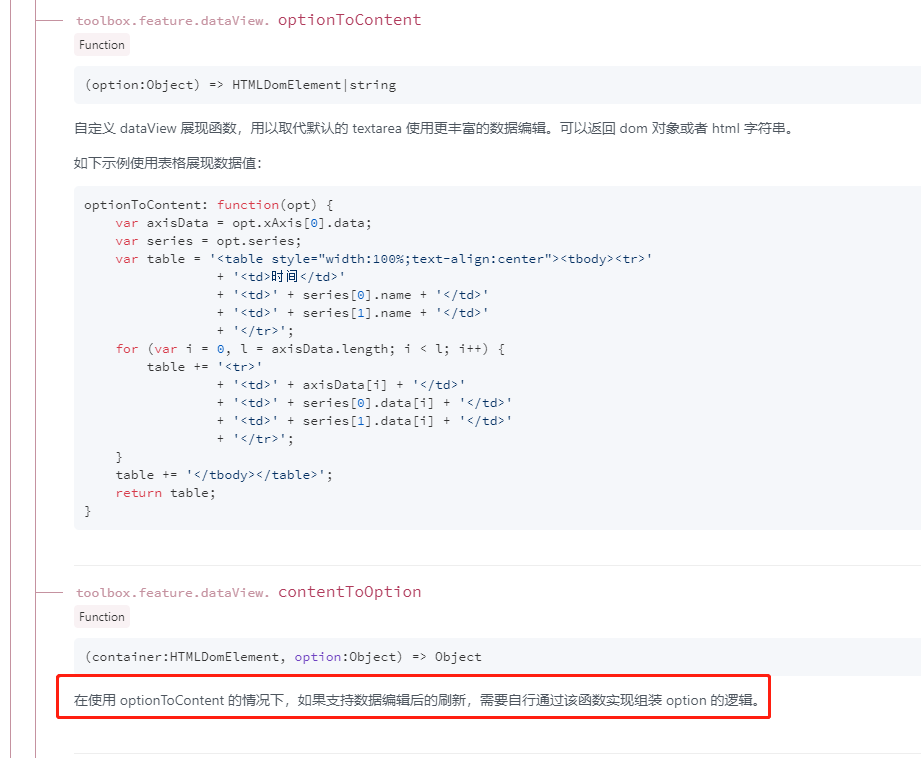
## 修改方法
添加 `contentToOption` 方法。鉴于你给的例子是一个纯输出的 HTML Table (只读),因此实际上直接 `return options` 即可,如下:
(另外我发现,只要你添加了 `contentToOption` 方法,即使不写 `return` 也能工作,但没有这个方法就不行)
```diff
option = {
title: {
text: '未来一周气温变化',
subtext: '纯属虚构'
},
tooltip: {
trigger: 'axis'
},
legend: {
data: ['最高气温', '最低气温']
},
toolbox: {
show: true,
feature: {
dataZoom: {
yAxisIndex: 'none'
},
dataView: {
readOnly: false,
optionToContent: function(opt) {
var axisData = opt.xAxis[0].data;
var series = opt.series;
var table = '<table style="width:100%;text-align:center"><tbody><tr>' +
'<td>时间</td>' +
'<td>' + series[0].name + '</td>' +
'<td>' + series[1].name + '</td>' +
'</tr>';
for (var i = 0, l = axisData.length; i < l; i++) {
table += '<tr>' +
'<td>' + axisData[i] + '</td>' +
'<td>' + series[0].data[i] + '</td>' +
'<td>' + series[1].data[i] + '</td>' +
'</tr>';
}
table += '</tbody></table>';
return table;
},
+ contentToOption: function(container, options) {
+ return options;
+ }
},
magicType: {
type: ['line', 'bar']
},
restore: {},
saveAsImage: {}
}
},
xAxis: {
type: 'category',
boundaryGap: false,
data: ['周一', '周二', '周三', '周四', '周五', '周六', '周日']
},
yAxis: {
type: 'value',
axisLabel: {
formatter: '{value} °C'
}
},
series: [{
name: '最高气温',
type: 'line',
data: [11, 11, 15, 13, 12, 13, 10],
markPoint: {
data: [{
type: 'max',
name: '最大值'
},
{
type: 'min',
name: '最小值'
}
]
},
markLine: {
data: [{
type: 'average',
name: '平均值'
}]
}
},
{
name: '最低气温',
type: 'line',
data: [1, -2, 2, 5, 3, 2, 0],
markPoint: {
data: [{
name: '周最低',
value: -2,
xAxis: 1,
yAxis: -1.5
}]
},
markLine: {
data: [{
type: 'average',
name: '平均值'
},
[{
symbol: 'none',
x: '90%',
yAxis: 'max'
}, {
symbol: 'circle',
label: {
position: 'start',
formatter: '最大值'
},
type: 'max',
name: '最高点'
}]
]
}
}
]
}
```
----------------------------------------------------------------
This is an automated message from the Apache Git Service.
To respond to the message, please log on to GitHub and use the
URL above to go to the specific comment.
For queries about this service, please contact Infrastructure at:
users@infra.apache.org
---------------------------------------------------------------------
To unsubscribe, e-mail: commits-unsubscribe@echarts.apache.org
For additional commands, e-mail: commits-help@echarts.apache.org