You are viewing a plain text version of this content. The canonical link for it is here.
Posted to dev@echarts.apache.org by GitBox <gi...@apache.org> on 2018/11/13 03:27:28 UTC
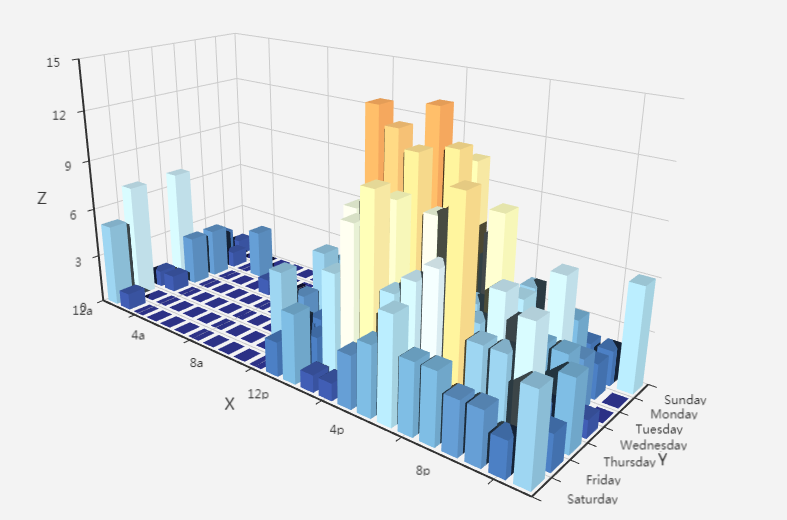
[GitHub] 4074 opened a new issue #9389: echarts-gl中的 grid3D.splitArea 能否设置贴图
4074 opened a new issue #9389: echarts-gl中的 grid3D.splitArea 能否设置贴图
URL: https://github.com/apache/incubator-echarts/issues/9389
### echarts-gl中的 grid3D.splitArea 能否设置贴图
### Version & Environment [版本及环境]
+ ECharts version [4.2.0]:
+ Browser version [Chrome 70.0.3538.67]:
+ OS Version [Windows7]:
----------------------------------------------------------------
This is an automated message from the Apache Git Service.
To respond to the message, please log on GitHub and use the
URL above to go to the specific comment.
For queries about this service, please contact Infrastructure at:
users@infra.apache.org
With regards,
Apache Git Services
---------------------------------------------------------------------
To unsubscribe, e-mail: dev-unsubscribe@echarts.apache.org
For additional commands, e-mail: dev-help@echarts.apache.org