You are viewing a plain text version of this content. The canonical link for it is here.
Posted to commits@echarts.apache.org by GitBox <gi...@apache.org> on 2020/07/31 12:51:13 UTC
[GitHub] [incubator-echarts] 100pah opened a new pull request #13065: Dataset trans
100pah opened a new pull request #13065:
URL: https://github.com/apache/incubator-echarts/pull/13065
<!-- Please fill in the following information to help us review your PR more efficiently. -->
## Brief Information
This pull request is in the type of:
- [ ] bug fixing
- [x] new feature
- [ ] others
Support dataset transform for:
+ Declarable and serializable data process config.
+ Eanble to integrate thrid-party data process tool as a plugin of echarts.
## Details
+ Enable dataset config transforms to generate new data source.
+ Third-party transforms can be registered.
+ A transform might have multiple input and multiple output. But in most cases, only one input and one output.
+ Transforms can be piped.
+ Parameters of transforms are declarable/serializable as possible as we can. Also callback might be supported if necessary.
### General
For example, suppose we have a data:
```js
var SALES_DATA = [
['Product', 'Sales', 'Price', 'Year'],
['Cake', 123, 32, 2011],
['Cereal', 231, 14, 2011],
['Tofu', 235, 5, 2011],
['Dumpling', 341, 25, 2011],
['Biscuit', 122, 29, 2011],
['Cake', 143, 30, 2012],
['Cereal', 201, 19, 2012],
['Tofu', 255, 7, 2012],
['Dumpling', 241, 27, 2012],
['Biscuit', 102, 34, 2012],
['Cake', 153, 28, 2013],
['Cereal', 181, 21, 2013],
['Tofu', 395, 4, 2013],
['Dumpling', 281, 31, 2013],
['Biscuit', 92, 39, 2013],
['Cake', 223, 29, 2014],
['Cereal', 211, 17, 2014],
['Tofu', 345, 3, 2014],
['Dumpling', 211, 35, 2014],
['Biscuit', 72, 24, 2014],
];
```
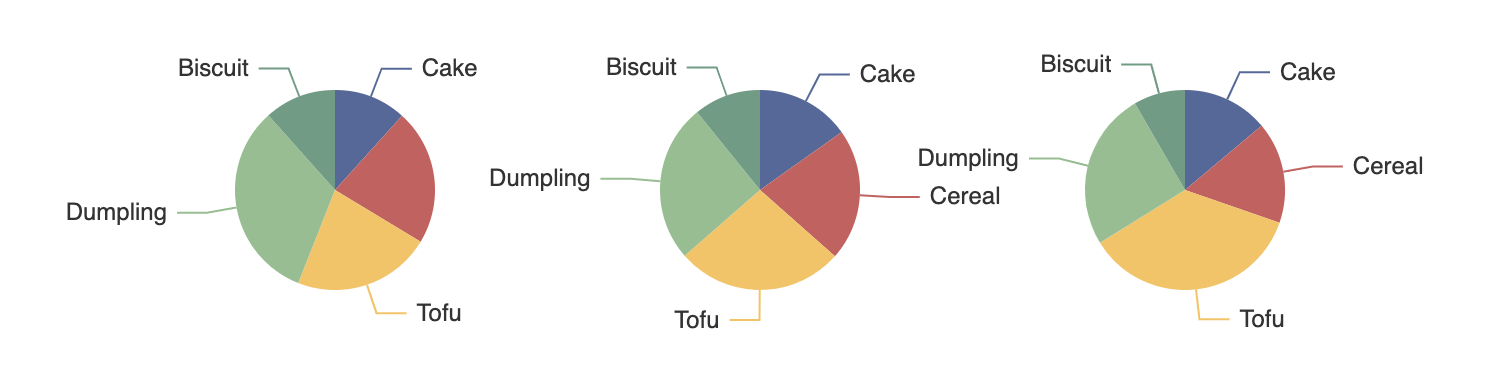
We can make three pies like this:
```js
var option = {
dataset: [{
source: SALES_DATA
}, {
transform: {
type: 'filter',
config: { dimension: 'Year', value: 2011 }
}
}, {
transform: {
type: 'filter',
config: { dimension: 'Year', value: 2012 }
}
}, {
transform: {
type: 'filter',
config: { dimension: 'Year', value: 2013 }
}
}],
series: [{
type: 'pie', radius: 50, center: ['25%', '50%'],
datasetIndex: 1
}, {
type: 'pie', radius: 50, center: ['50%', '50%'],
datasetIndex: 2
}, {
type: 'pie', radius: 50, center: ['75%', '50%'],
datasetIndex: 3
}],
};
```
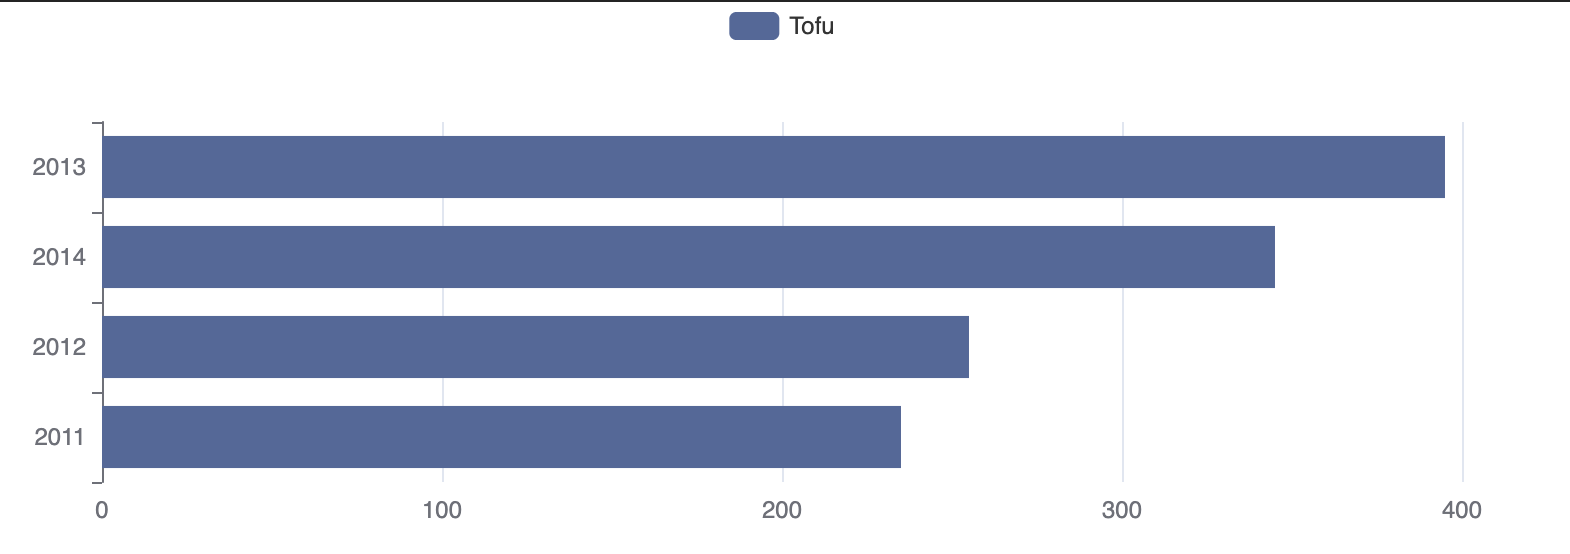
Or:
```js
var option1 = {
dataset: [{
source: SALES_DATA
}, {
// Pipe the transforms (filter and sort). This is a short-cut.
transform: [{
type: 'filter',
config: { dimension: 'Product', value: 'Tofu' }
}, {
type: 'sort',
config: { dimension: 'Sales', order: 'asc' }
}]
}],
legend: {},
xAxis: {},
yAxis: { type: 'category' },
series: [{
type: 'bar',
name: 'Tofu',
encode: { y: 'Year', x: 'Sales' },
datasetIndex: 1
}],
};
```
### Filter transform
```js
transform: {
type: 'filter',
config: {}
},
```
The `config` is a "conditional expression option", can be:
```ts
type ConditionalExpressionOption =
true | false | RelationalExpressionOption | LogicalExpressionOption;
type LogicalExpressionOption = {
and?: LogicalExpressionSubOption[];
or?: LogicalExpressionSubOption[];
not?: LogicalExpressionSubOption;
};
type LogicalExpressionSubOption =
LogicalExpressionOption | RelationalExpressionOption | TrueFalseExpressionOption;
type RelationalExpressionOption = {
dimension?: string | number;
parse?: 'time' | 'trim';
lt?: OptionDataValue; // less than
lte?: OptionDataValue; // less than or equal
gt?: OptionDataValue; // greater than
gte?: OptionDataValue; // greater than or equal
eq?: OptionDataValue; // equal
ne?: OptionDataValue; // not equal
'<'?: OptionDataValue; // lt
'<='?: OptionDataValue; // lte
'>'?: OptionDataValue; // gt
'>='?: OptionDataValue; // gte
'='?: OptionDataValue; // eq
'!='?: OptionDataValue; // ne
'<>'?: OptionDataValue; // ne (SQL style)
reg?: RegExp | string; // RegExp
}
```
For example:
```js
// Parse time and then use arithmetic operators.
config: {
dimension: 'Year', '>=': '2016-02', '<': '2016-03', parse: 'time'
}
// Logical expression option
config: {
and: [{
dimension: 'Sex', eq: 'male'
}, {
or: [{
// support regexp, like SQL `like "%Smith%"` did.
dimension: 'Name', reg: /(\s|^)Su(\s|$)/
}, {
dimension: 'Name', reg: /(\s|^)Smith(\s|$)/
}]
}]
}
```
### Sort transform
```js
transform: {
type: 'sort',
config: { dimension: 'Price', order: 'asc' }
}
// or
transform: {
type: 'sort',
// multiple sort
config: [
{ dimension: 'Price', order: 'asc' },
{ dimension: 'Year', order: 'desc', parse: 'time' }
]
}
```
By default, compare the raw value by JS relational operator.
If specify `parse: 'time'`, compare with parsed value.
### How to output multiple result
```js
dataset: [{
source: rawData
}, {
transform: {
type: 'echarts-extension:boxplot'
}
// This transform output two results.
// The first result is so-called the "main result",
// Can be referenced directly
}, {
fromDatasetIndex: 1,
fromTransformResult: 1
// Use `fromTransformResult` to retrieve the extra result from
// the pre dataset.
}],
series: [{
name: 'boxplot',
type: 'boxplot',
// Reference the dataset 1
datasetIndex: 1
}, {
name: 'outlier',
type: 'scatter',
// Reference the dataset 2
datasetIndex: 2
}]
```
### Register third-party transform
```js
echarts.registerTransform(myTransform);
```
```ts
const myTransform = {
// Name space is required (my).
type: 'my:regression',
transform: function (params) {
// If using multiple upstream dataset.
const upstreamSourceList = params.sourceList;
// The first upstream dataset.
const upstreamSource = params.source;
const dimensionInfoAll = upstreamSource.getDimensionInfoAll();
const dimensionInfo = upstreamSource.getDimensionInfo('Year');
const dataItem = upstreamSource.getRawDataItem(4);
const headerItem = upstreamSource.getRawHeaderItem(1);
const resultData = [
[...],
[...],
...
];
// ...
return { data: resultData };
}
};
```
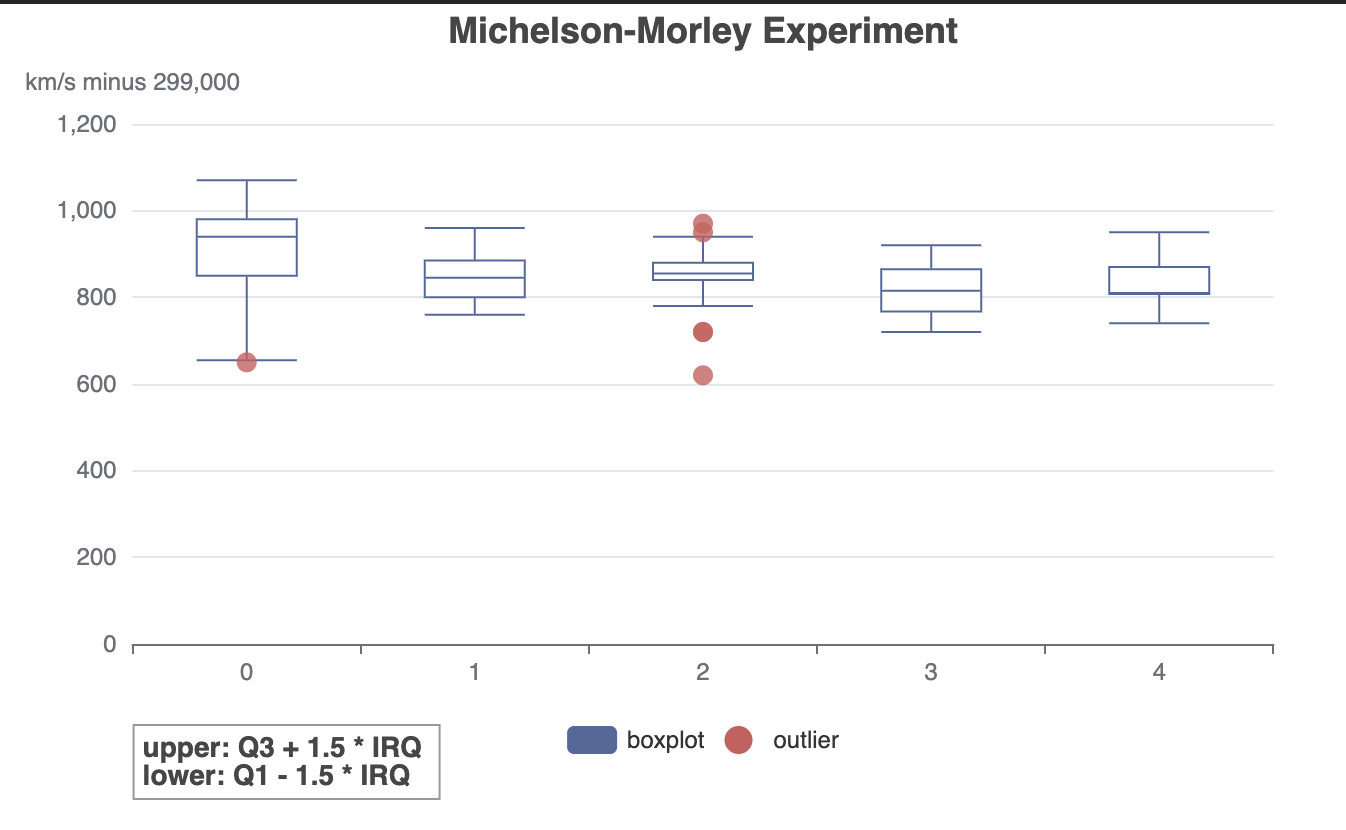
### Boxplot case currently
```js
echarts.registerTransform(dataTool.boxplotTransform);
var option = {
dataset: [{
source: rawData
}, {
transform: {
// Is the name OK?
type: 'echarts-extension:boxplot'
}
}, {
fromDatasetIndex: 1,
fromTransformResult: 1
}],
series: [{
name: 'boxplot',
type: 'boxplot',
datasetIndex: 1
}, {
name: 'outlier',
type: 'scatter',
datasetIndex: 2
}],
...
};
```
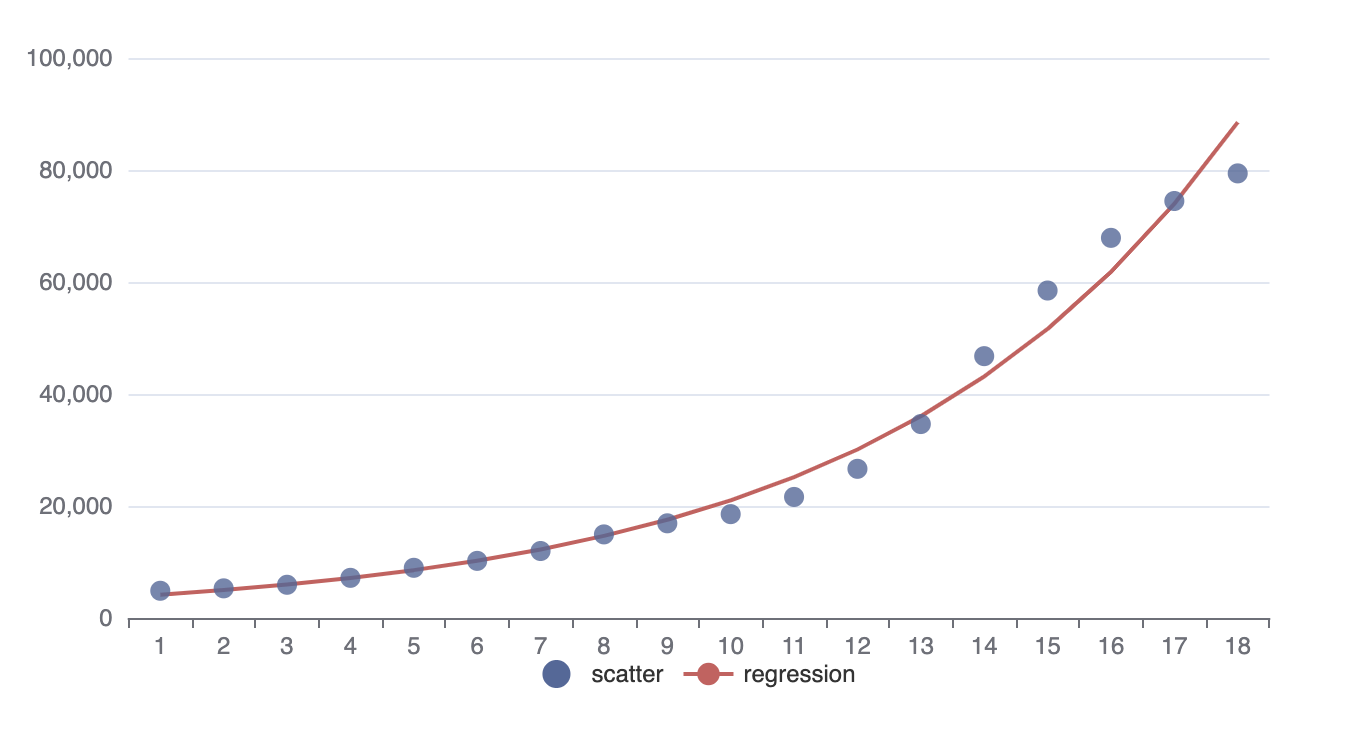
### ecStat case currently
```js
echarts.registerTransform(...);
// Regression:
var option = {
dataset: [{
source: rawData
}, {
transform: {
type: 'ecStat:regression',
config: {
method: 'exponential'
}
}
}, {
fromDatasetIndex: 1,
fromTransformResult: 1
}],
legend: {
bottom: 20
},
tooltip: {
},
xAxis: {
type: 'category',
},
yAxis: {
},
series: [{
name: 'scatter',
type: 'scatter',
datasetIndex: 0
}, {
name: 'regression',
type: 'line',
symbol: 'none',
datasetIndex: 1
}]
};
```
### Debug for users
Set `print: true` to print transform result data in browser console.
This feature only work in dev mode.
```js
dataset: {
transform: {
type: 'filter',
config: { ... },
print: true
}
}
```
### New option
```ts
type DatasetOption = {
fromDatasetIndex?: number;
fromDatasetId?: string;
transform?: DataTransformOption | PipedDataTransformOption;
// When a transform result more than on results, the results can be referenced only by:
// Using `fromDatasetIndex`/`fromDatasetId` and `transfromResultIndex` to retrieve
// the results from other dataset.
fromTransformResult?: number;
};
interface DataTransformOption {
type: DataTransformType;
config: DataTransformConfig;
// Print the result via `console.log` when transform performed. Only work in dev mode for debug.
print?: boolean;
}
```
## TODO
+ How to handle the numeric-like string and '-' representing no value?
+ Add more demos.
+ Upgrade ecStat to encapsulate as transforms for easy usage.
+ Add built-in transforms: aggregate, map/convert, merge/concat, expand, pivot, tree.
+ Add callback support for filter transform if needed.
+ Optimize filter transform if needed.
+ Integrate with some built-in component like legend.
+ Progressive-friendly consideration.
## Memo
**DO NOT** expose the concept "data filter processor" to end users unless we really make sure that concept will not be changed any more forever.
Consider these cases that may tempt us to expose the concept of "data filter processor":
+ Use legend to control data items or series in bar/line/scatter under custom rules.
+ Issue: how about the hover state?
+ Do "count"/"group by" after dataZoom changed the window.
+ Issue: dataZoom filter is not always be used (see `filterMode`) and may be not reliable (consider if we want to left some more points out of the window to make the line go through the edge of the cartesian)
Drawback of expose the concept:
+ May bring great burden on future refactor (either for functionality or performance). Do we really ensure that the data process stage will never be modified in future?
+ May be rarely used, if introducing a new concept that not friendly for junior users.
The solution for that scenario above:
+ Introduce new features within the scope of "legend component". Enhance "legend" to support more flexible control. And if some senior users intend to build their own legend UI outside or use API to implement the legend functionality, provide a "headless legend" for them.
## Test cases
Currently:
test/data-transform.html
test/data-transform-external.html
test/data-transform-ecStat.html
----------------------------------------------------------------
This is an automated message from the Apache Git Service.
To respond to the message, please log on to GitHub and use the
URL above to go to the specific comment.
For queries about this service, please contact Infrastructure at:
users@infra.apache.org
---------------------------------------------------------------------
To unsubscribe, e-mail: commits-unsubscribe@echarts.apache.org
For additional commands, e-mail: commits-help@echarts.apache.org
[GitHub] [incubator-echarts] echarts-bot[bot] commented on pull request #13065: Dataset trans
Posted by GitBox <gi...@apache.org>.
echarts-bot[bot] commented on pull request #13065:
URL: https://github.com/apache/incubator-echarts/pull/13065#issuecomment-667103694


   Thanks for your contribution!
   The community will review it ASAP. In the meanwhile, please checkout [the coding standard](https://echarts.apache.org/en/coding-standard.html) and Wiki about [How to make a pull request](https://github.com/apache/incubator-echarts/wiki/How-to-make-a-pull-request).

   The pull request is marked to be `PR: author is committer` because you are a committer of this project.


----------------------------------------------------------------
This is an automated message from the Apache Git Service.
To respond to the message, please log on to GitHub and use the
URL above to go to the specific comment.

For queries about this service, please contact Infrastructure at:
users@infra.apache.org


---------------------------------------------------------------------
To unsubscribe, e-mail: commits-unsubscribe@echarts.apache.org
For additional commands, e-mail: commits-help@echarts.apache.org
[GitHub] [incubator-echarts] pissang merged pull request #13065: Dataset trans
Posted by GitBox <gi...@apache.org>.
pissang merged pull request #13065:
URL: https://github.com/apache/incubator-echarts/pull/13065


----------------------------------------------------------------
This is an automated message from the Apache Git Service.
To respond to the message, please log on to GitHub and use the
URL above to go to the specific comment.

For queries about this service, please contact Infrastructure at:
users@infra.apache.org


---------------------------------------------------------------------
To unsubscribe, e-mail: commits-unsubscribe@echarts.apache.org
For additional commands, e-mail: commits-help@echarts.apache.org
[GitHub] [incubator-echarts] echarts-bot[bot] commented on pull request #13065: Dataset trans
Posted by GitBox <gi...@apache.org>.
echarts-bot[bot] commented on pull request #13065:
URL: https://github.com/apache/incubator-echarts/pull/13065#issuecomment-667118436


   Congratulations! Your PR has been merged. Thanks for your contribution! 👍


----------------------------------------------------------------
This is an automated message from the Apache Git Service.
To respond to the message, please log on to GitHub and use the
URL above to go to the specific comment.

For queries about this service, please contact Infrastructure at:
users@infra.apache.org


---------------------------------------------------------------------
To unsubscribe, e-mail: commits-unsubscribe@echarts.apache.org
For additional commands, e-mail: commits-help@echarts.apache.org