You are viewing a plain text version of this content. The canonical link for it is here.
Posted to dev@skywalking.apache.org by GitBox <gi...@apache.org> on 2020/05/22 15:02:15 UTC
[GitHub] [skywalking-rocketbot-ui] wu-sheng edited a comment on pull request #297: Feat: New metrics and custom configurations in dashboard
wu-sheng edited a comment on pull request #297:
URL: https://github.com/apache/skywalking-rocketbot-ui/pull/297#issuecomment-632731224
The multiple metrics linear visualization doesn't show the correct backend result.
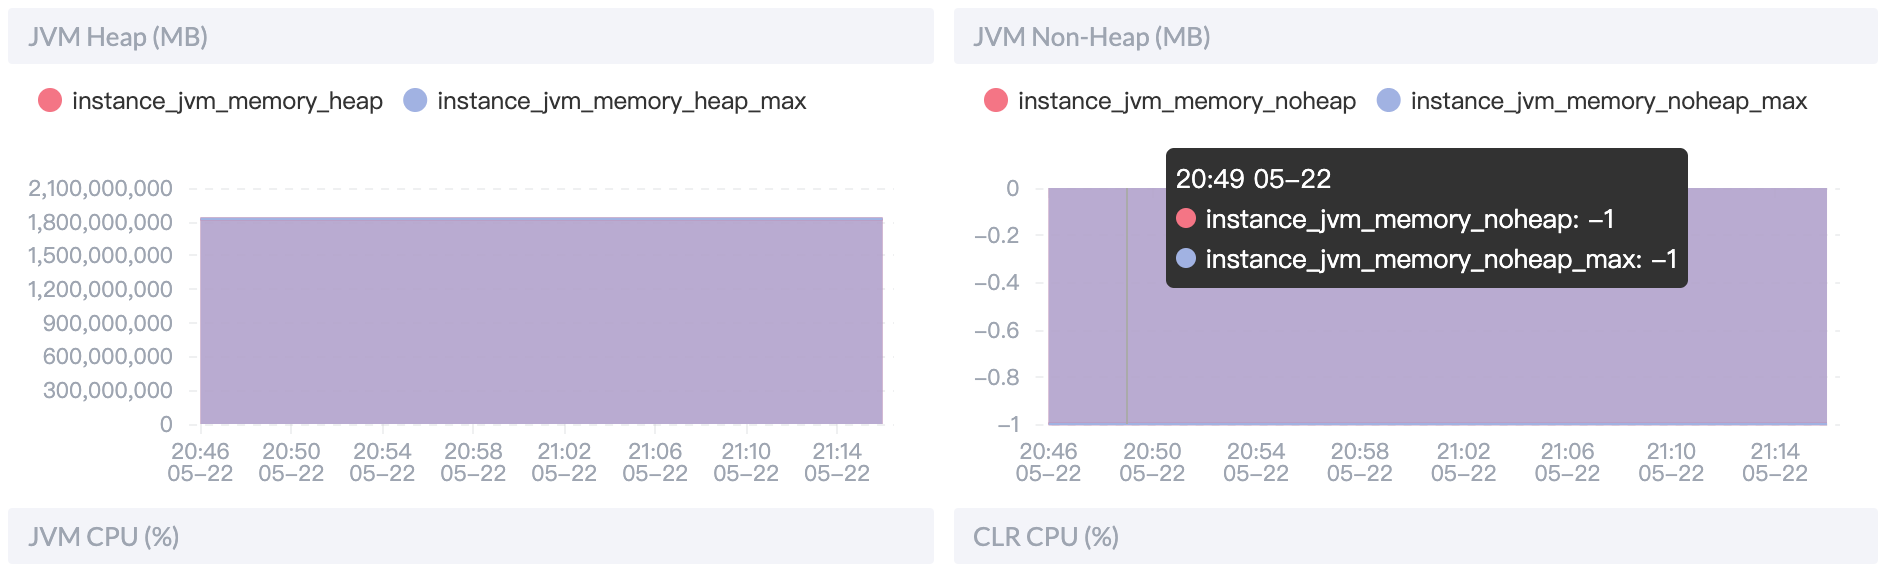

Also, there are not metrics simple calculations, such as `$value / 1000` to format the value in a more reasonable way.
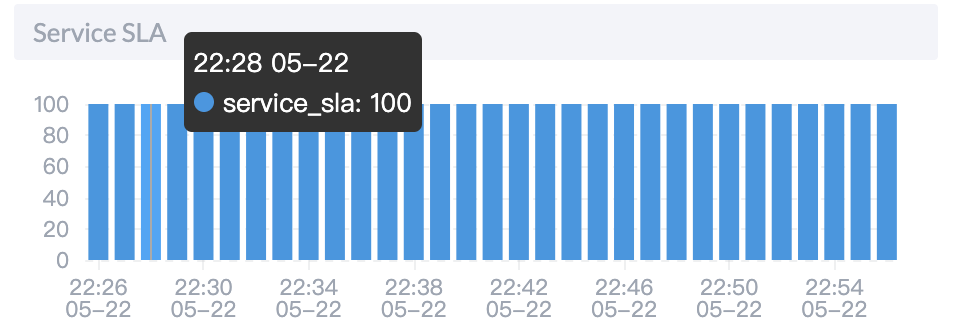
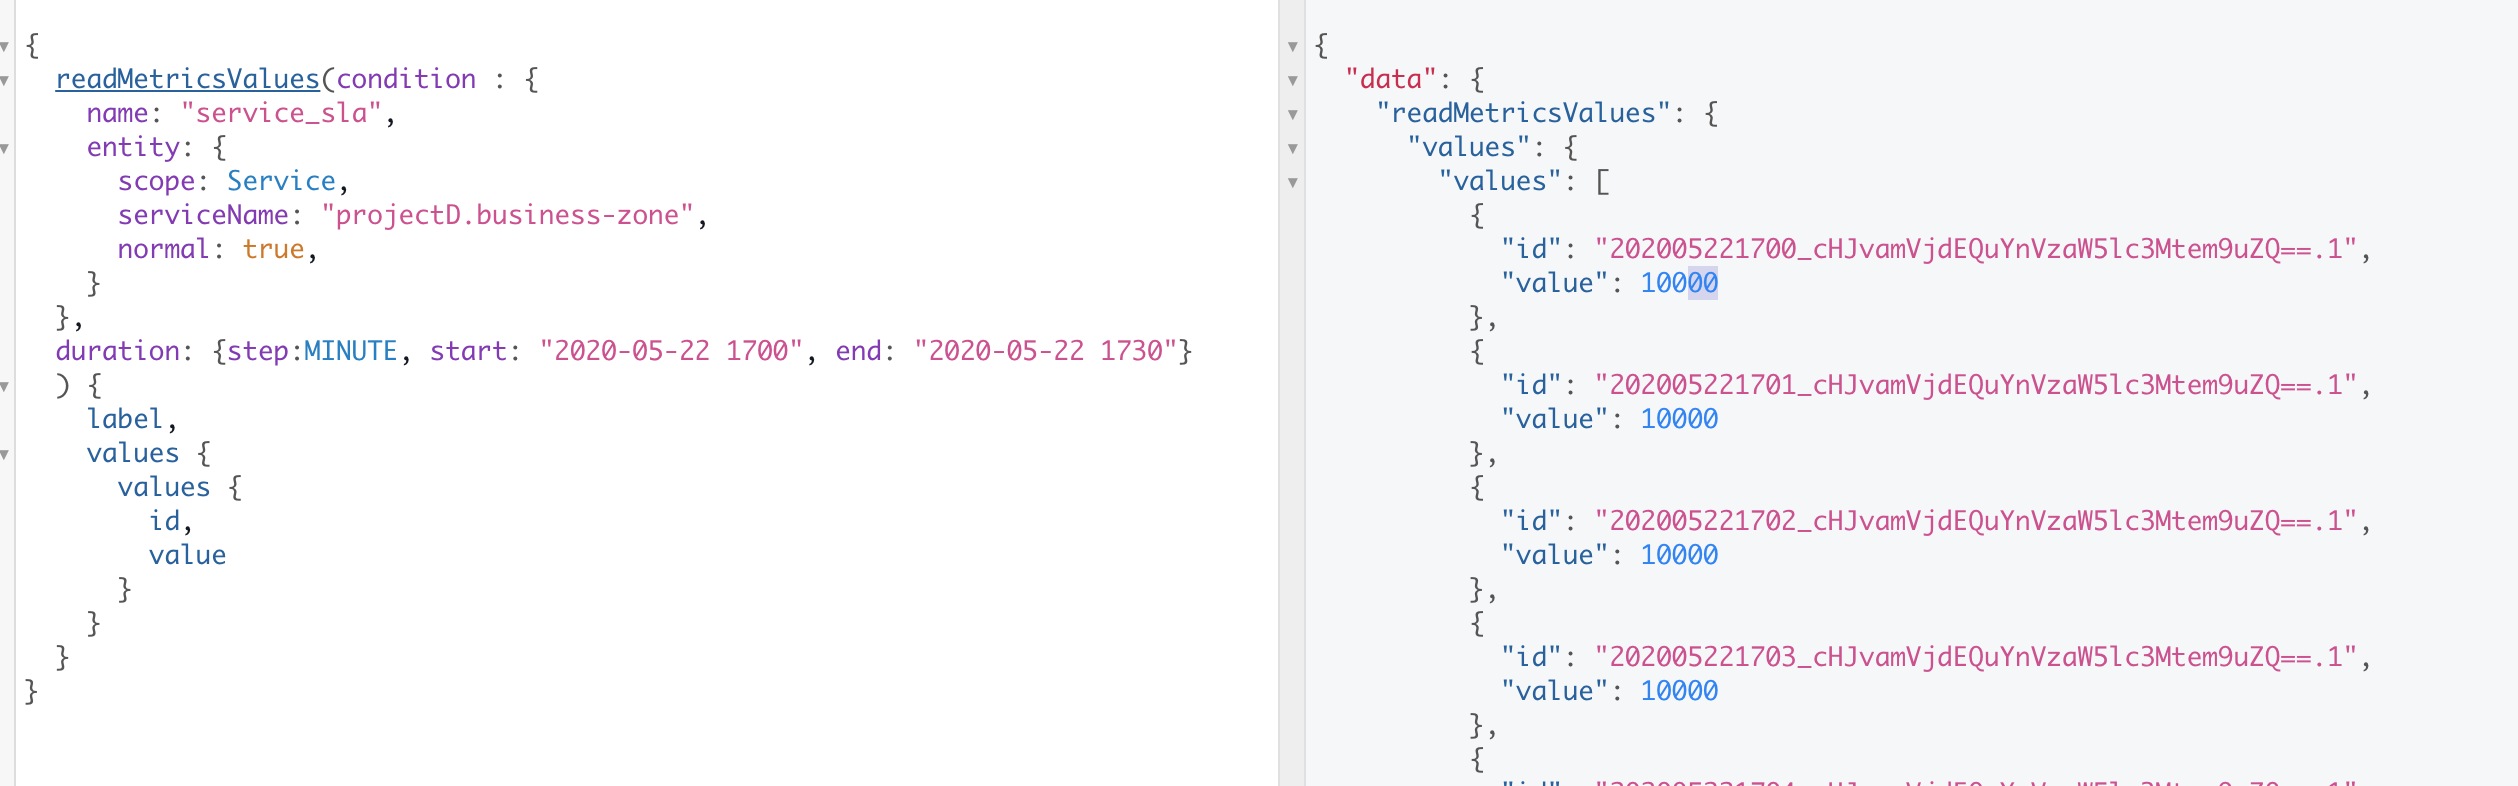
But once you don't have this, how do you make the successful rate look right, which should not be right. Do you hard code anything? Otherwise, we should show 10000, because the backend query returns 10000.
----------------------------------------------------------------
This is an automated message from the Apache Git Service.
To respond to the message, please log on to GitHub and use the
URL above to go to the specific comment.
For queries about this service, please contact Infrastructure at:
users@infra.apache.org