You are viewing a plain text version of this content. The canonical link for it is here.
Posted to commits@echarts.apache.org by GitBox <gi...@apache.org> on 2022/11/22 23:31:23 UTC
[GitHub] [echarts] aleixtusetbadia opened a new issue, #17956: Two Axis linked with multiple Axis
aleixtusetbadia opened a new issue, #17956:
URL: https://github.com/apache/echarts/issues/17956

   ### What problem does this feature solve?

   I want to have a functionality which allows to have the same values on every parallel axis. Actually the function alignticks don't fit what I'm looking for.

   Here a sample code:

   `option = {

     tooltip: {
       trigger: 'axis',
       axisPointer: {
         type: 'cross',
         animation: false
       }
     },
     legend: {
       data: ['Value', 'Price'],
       left: 'center',
       icon: 'circle',
       itemGap: 30
     },
     xAxis: {
       type: 'category',
       data: ['00:00', '01:15', '02:30', '03:45', '05:00', '06:15', '07:30', '08:45', '10:00', '11:15', '12:30', '13:45', '15:00', '16:15', '17:30', '18:45', '20:00', '21:15', '22:30', '23:45']
     },
     yAxis: [
       {
         name: 'Valor',
         type: 'log',
         scale: true
       },
       {
         name: 'Price',
         alignTicks:true,
         type: 'log',
         scale: true,
         logBase: 10
       }
     ],
     series: [
         {
         name: 'Valor',
         type: 'line',
         lineStyle: { color: '#0066ff', width: 1.5 },
         itemStyle: { color: '#0066ff' },
         showSymbol: false,
         z: 10,
         data: [500, 780, 750, 760, 770, 2000, 3500, 1500, 30000, 3900, 7800, 7900, 8000, 9000, 7000, 8500, 8000, 7000, 6000, 4000]
       },
       {
         name: 'Price',
         type: 'line',
         yAxisIndex: 1,
         lineStyle: { color: '#000', width: 1.5 },
         itemStyle: { color: '#000' },
         showSymbol: false,
         z: 20,
         data: [300, 280, 250, 260, 270, 300, 550, 1000, 4000, 3900, 380, 390, 400, 500, 600, 750, 800, 700, 600, 400]
       }
     ],
   };`

   My request is based on the [HighCharts](https://www.highcharts.com/) library, which provides an API called [linkedTo](https://api.highcharts.com/highcharts/yAxis.linkedTo), which does the same thing as I described here.

   Here a example of highcharts: [jsfiddle](https://jsfiddle.net/nogz0j2b/)

   ### What does the proposed API look like?

   Let's say we have a boolean attribute yAxis.linkedTo. By setting it to 0, its ticks will get aligned with every other axis in the yAxis array which has the same value. That way, if one of the axis has a value of 100, all the other axis will also have a value of 100 and get aligned altogether.


--
This is an automated message from the Apache Git Service.
To respond to the message, please log on to GitHub and use the
URL above to go to the specific comment.

To unsubscribe, e-mail: commits-unsubscribe@echarts.apache.org.apache.org

For queries about this service, please contact Infrastructure at:
users@infra.apache.org


---------------------------------------------------------------------
To unsubscribe, e-mail: commits-unsubscribe@echarts.apache.org
For additional commands, e-mail: commits-help@echarts.apache.org
[GitHub] [echarts] miguelgilmartinez commented on issue #17956: Two Axis linked with multiple Axis
Posted by GitBox <gi...@apache.org>.
miguelgilmartinez commented on issue #17956:
URL: https://github.com/apache/echarts/issues/17956#issuecomment-1324979731

   We need this feature too!


--
This is an automated message from the Apache Git Service.
To respond to the message, please log on to GitHub and use the
URL above to go to the specific comment.

To unsubscribe, e-mail: commits-unsubscribe@echarts.apache.org

For queries about this service, please contact Infrastructure at:
users@infra.apache.org


---------------------------------------------------------------------
To unsubscribe, e-mail: commits-unsubscribe@echarts.apache.org
For additional commands, e-mail: commits-help@echarts.apache.org
[GitHub] [echarts] aleixtusetbadia commented on issue #17956: Two Axis linked with multiple Axis
Posted by GitBox <gi...@apache.org>.
aleixtusetbadia commented on issue #17956:
URL: https://github.com/apache/echarts/issues/17956#issuecomment-1327718552

   I tried already with min and max, also setting a functions for min and max and with log charts anything works.
   Highcharts provide this option with [linkedto](https://api.highcharts.com/highcharts/yAxis.linkedTo) plotly, tableau, and other chart providers do it aswell.

   Would be great to implment some similar solution, the main idea would be to set one of the Y axis as master and the other that take the axis values from master and align with them.

   Someone ask the same here [https://github.com/apache/echarts/issues/16154](url), so is a feature that would be great to implement.


--
This is an automated message from the Apache Git Service.
To respond to the message, please log on to GitHub and use the
URL above to go to the specific comment.

To unsubscribe, e-mail: commits-unsubscribe@echarts.apache.org

For queries about this service, please contact Infrastructure at:
users@infra.apache.org


---------------------------------------------------------------------
To unsubscribe, e-mail: commits-unsubscribe@echarts.apache.org
For additional commands, e-mail: commits-help@echarts.apache.org
[GitHub] [echarts] Ovilia commented on issue #17956: Two Axis linked with multiple Axis
Posted by GitBox <gi...@apache.org>.
Ovilia commented on issue #17956:
URL: https://github.com/apache/echarts/issues/17956#issuecomment-1326166439

   Well, this feature seems a little unexpected to me. If two axes should always have the same extremes, why do you need a second axis for the first place?


--
This is an automated message from the Apache Git Service.
To respond to the message, please log on to GitHub and use the
URL above to go to the specific comment.

To unsubscribe, e-mail: commits-unsubscribe@echarts.apache.org

For queries about this service, please contact Infrastructure at:
users@infra.apache.org


---------------------------------------------------------------------
To unsubscribe, e-mail: commits-unsubscribe@echarts.apache.org
For additional commands, e-mail: commits-help@echarts.apache.org
[GitHub] [echarts] aleixtusetbadia commented on issue #17956: Two Axis linked with multiple Axis
Posted by GitBox <gi...@apache.org>.
aleixtusetbadia commented on issue #17956:
URL: https://github.com/apache/echarts/issues/17956#issuecomment-1326641094
This first image is do it in tableau software, we linked first Y axis and second Yaxis so the values are the same in both Y axis. We want to know when the black line is below the orange line.
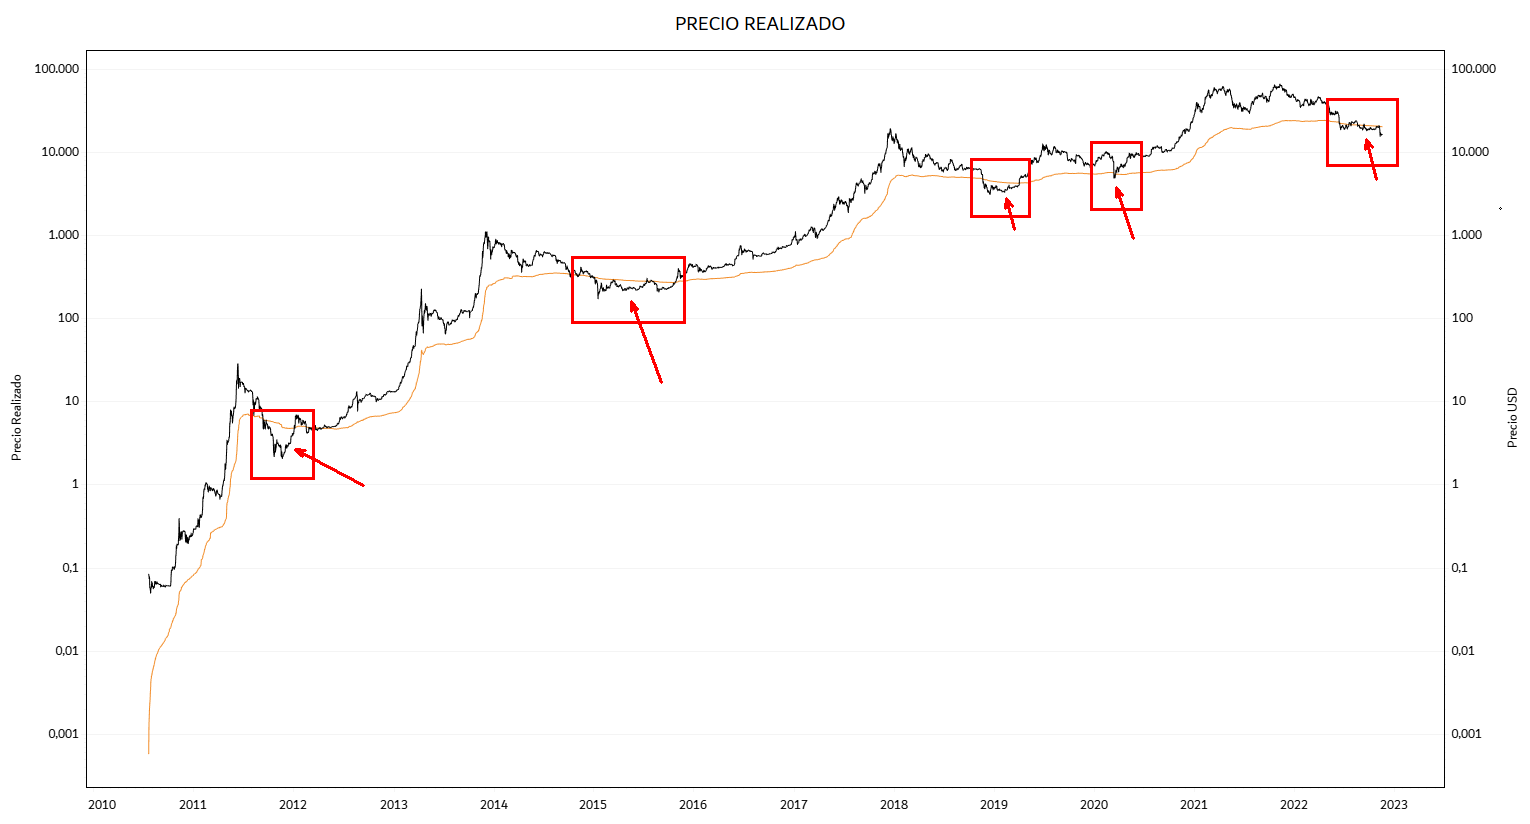
We are bringing everything developed in tableau into production and we find that we cannot synchronize the Y axis values. As you can see we have given colors to the two Y axes, so the user can know which colors the value represents. Visually it is much more intuitive

--
This is an automated message from the Apache Git Service.
To respond to the message, please log on to GitHub and use the
URL above to go to the specific comment.
To unsubscribe, e-mail: commits-unsubscribe@echarts.apache.org
For queries about this service, please contact Infrastructure at:
users@infra.apache.org
---------------------------------------------------------------------
To unsubscribe, e-mail: commits-unsubscribe@echarts.apache.org
For additional commands, e-mail: commits-help@echarts.apache.org
[GitHub] [echarts] Ovilia commented on issue #17956: Two Axis linked with multiple Axis
Posted by GitBox <gi...@apache.org>.
Ovilia commented on issue #17956:
URL: https://github.com/apache/echarts/issues/17956#issuecomment-1324479499

   The demo you provided using ECharts and HighCharts looks quite similar to me. Can you further explain what is needed? It seems to me the axes are already aligned with ECharts.


--
This is an automated message from the Apache Git Service.
To respond to the message, please log on to GitHub and use the
URL above to go to the specific comment.

To unsubscribe, e-mail: commits-unsubscribe@echarts.apache.org

For queries about this service, please contact Infrastructure at:
users@infra.apache.org


---------------------------------------------------------------------
To unsubscribe, e-mail: commits-unsubscribe@echarts.apache.org
For additional commands, e-mail: commits-help@echarts.apache.org
[GitHub] [echarts] aleixtusetbadia commented on issue #17956: Two Axis linked with multiple Axis
Posted by GitBox <gi...@apache.org>.
aleixtusetbadia commented on issue #17956:
URL: https://github.com/apache/echarts/issues/17956#issuecomment-1324738668
The axis are aligned but not the values

@Ovilia
--
This is an automated message from the Apache Git Service.
To respond to the message, please log on to GitHub and use the
URL above to go to the specific comment.
To unsubscribe, e-mail: commits-unsubscribe@echarts.apache.org
For queries about this service, please contact Infrastructure at:
users@infra.apache.org
---------------------------------------------------------------------
To unsubscribe, e-mail: commits-unsubscribe@echarts.apache.org
For additional commands, e-mail: commits-help@echarts.apache.org
[GitHub] [echarts] Ovilia commented on issue #17956: Two Axis linked with multiple Axis
Posted by GitBox <gi...@apache.org>.
Ovilia commented on issue #17956:
URL: https://github.com/apache/echarts/issues/17956#issuecomment-1327071852

   I'm afraid this cannot be done. You may try to set `min/max` manually.


--
This is an automated message from the Apache Git Service.
To respond to the message, please log on to GitHub and use the
URL above to go to the specific comment.

To unsubscribe, e-mail: commits-unsubscribe@echarts.apache.org

For queries about this service, please contact Infrastructure at:
users@infra.apache.org


---------------------------------------------------------------------
To unsubscribe, e-mail: commits-unsubscribe@echarts.apache.org
For additional commands, e-mail: commits-help@echarts.apache.org
[GitHub] [echarts] Ovilia commented on issue #17956: Two Axis linked with multiple Axis
Posted by GitBox <gi...@apache.org>.
Ovilia commented on issue #17956:
URL: https://github.com/apache/echarts/issues/17956#issuecomment-1327986191

   @aleixtusetbadia A pull request is welcomed. You may checkout [how we aligned ticks of multiple axes](https://github.com/apache/echarts/pull/16300) with ECharts and [how to debug](https://github.com/apache/echarts/wiki/How-to-setup-the-dev-environment).


--
This is an automated message from the Apache Git Service.
To respond to the message, please log on to GitHub and use the
URL above to go to the specific comment.

To unsubscribe, e-mail: commits-unsubscribe@echarts.apache.org

For queries about this service, please contact Infrastructure at:
users@infra.apache.org


---------------------------------------------------------------------
To unsubscribe, e-mail: commits-unsubscribe@echarts.apache.org
For additional commands, e-mail: commits-help@echarts.apache.org