You are viewing a plain text version of this content. The canonical link for it is here.
Posted to commits@echarts.apache.org by GitBox <gi...@apache.org> on 2022/05/26 07:03:26 UTC
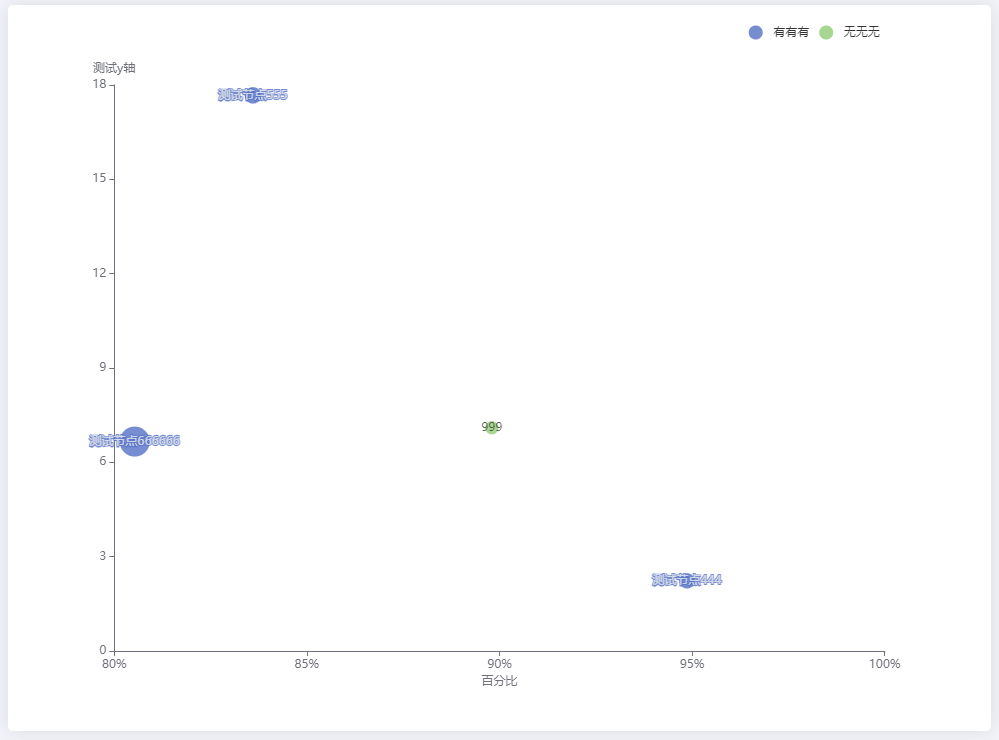
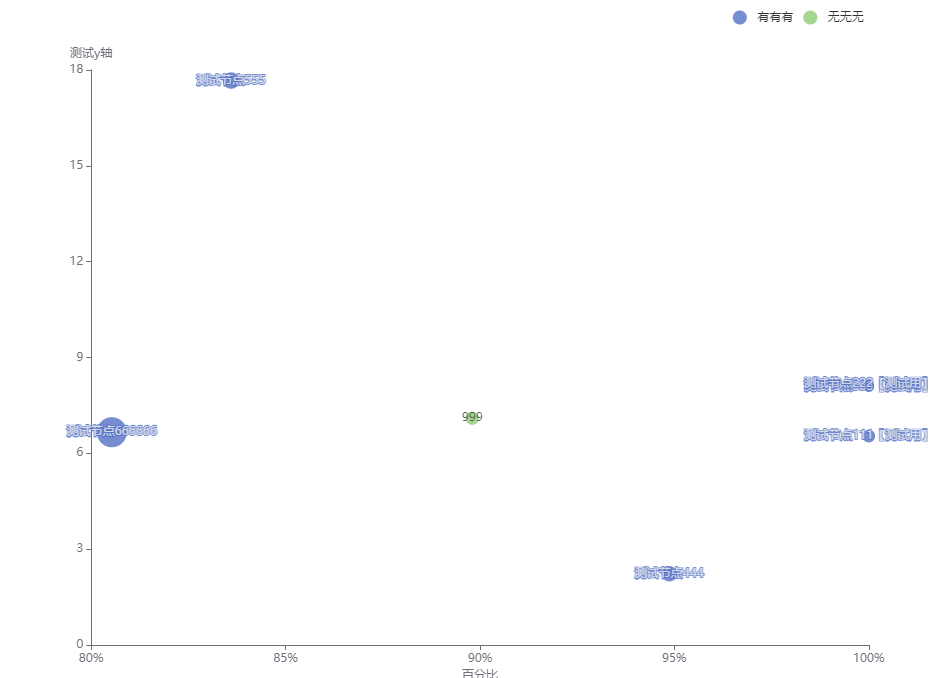
[GitHub] [echarts] echarts-bot[bot] commented on issue #17113: [Bug] Scatter dots sometimes disappear after resizing window
echarts-bot[bot] commented on issue #17113:
URL: https://github.com/apache/echarts/issues/17113#issuecomment-1138230003
@kayoch1n It seems you are not using English, I've helped translate the content automatically. To make your issue understood by more people and get helped, we'd like to suggest using English next time. 🤗
<details><summary><b>TRANSLATED</b></summary><br>
**BODY**
### Version
5.2.1
### Link to Minimal Reproduction
_No response_
### Steps to Reproduce
1. The maximum value of the coordinate axis is 100, and the value of some data points is exactly 100
2. Occasionally after resizing the window, or disappearing in the case of a certain window size
````js
option = option = {
xAxis: {
type: 'value',
scale: true,
splitLine: { show: false },
nameLocation: 'middle',
nameGap: 25,
axisLine: { onZero: false },
name: 'percent',
axisLabel: { formatter: '{value}%', rotate: 0 },
max: 100,
min: 80
},
yAxis: {
scale: true,
splitLine: { show: false },
nameGap: 10,
axisLine: { onZero: false },
name: 'Test y-axis',
axisLabel: { rotate: 0 }
},
legend: { right: '10%', width: '80%', top: 5, type: 'scroll' },
series: [
{
name: 'Yes, yes, yes',
type: 'scatter',
data: [
[80.53, 6.66, 570, 'Yes, yes', 'Test node 666666'],
[100, 8.08, 14, 'Yes, yes', 'Test node 333 [for testing]'],
[77.78, 9.01, 72, 'Yes, yes', 'Test node 888 [for testing]'],
[83.6, 17.67, 189, 'Yes yes yes', 'Test node 555'],
[94.87, 2.23, 156, 'Yes yes yes', 'Test node 444'],
[100, 8.16, 7, 'Yes, yes', 'Test node 222 [for testing]'],
[100, 6.54, 81, 'Yes, yes', 'Test node 111 [for testing]']
],
label: { show: true, position: 'inside', formatter: '{@[4]}' },
},
{
name: 'No no no no',
type: 'scatter',
data: [
[89.8, 7.1, 98, 'no no no no', '999'],
[0, 3.33, 170, 'no no no no', 'test']
],
label: { show: true, position: 'inside', formatter: '{@[4]}' }
}
],
visualMap: {
show: false,
dimension: 2,
outOfRange: { symbolSize: 10, color: ['rgb(217,217,217)'] },
inRange: { symbolSize: [10, 30] },
min: 7,
max: 570
},
grid: { top: 70, left: '10%', right: '10%', bottom: 70 }
};
````
### Current Behavior
1. After resizing the window, the data points disappear, as shown below
### Expected Behavior
1. Display data points normally, as shown below
### Environment
````markdown
- OS: windows
- Browser: chrome 100
- Framework: vue2
````
### Any additional comments?
_No response_
</details>
--
This is an automated message from the Apache Git Service.
To respond to the message, please log on to GitHub and use the
URL above to go to the specific comment.
To unsubscribe, e-mail: commits-unsubscribe@echarts.apache.org
For queries about this service, please contact Infrastructure at:
users@infra.apache.org
---------------------------------------------------------------------
To unsubscribe, e-mail: commits-unsubscribe@echarts.apache.org
For additional commands, e-mail: commits-help@echarts.apache.org