You are viewing a plain text version of this content. The canonical link for it is here.
Posted to commits@iotdb.apache.org by ha...@apache.org on 2023/04/03 08:17:46 UTC
[iotdb] branch master updated: feat(docs):site img move to alioss (#9505)
This is an automated email from the ASF dual-hosted git repository.
haonan pushed a commit to branch master
in repository https://gitbox.apache.org/repos/asf/iotdb.git
The following commit(s) were added to refs/heads/master by this push:
new 1df73ab327 feat(docs):site img move to alioss (#9505)
1df73ab327 is described below
commit 1df73ab3275bd874f2d5866c5fa75fd3aac382a1
Author: CritasWang <cr...@outlook.com>
AuthorDate: Mon Apr 3 16:17:38 2023 +0800
feat(docs):site img move to alioss (#9505)
---
docs/UserGuide/API/InfluxDB-Protocol.md | 10 +--
docs/UserGuide/API/Programming-MQTT.md | 4 +-
.../UserGuide/API/Programming-Python-Native-API.md | 2 +-
docs/UserGuide/Cluster/Cluster-Concept.md | 4 +-
docs/UserGuide/Cluster/Cluster-Maintenance.md | 2 +-
.../Data-Concept/Data-Model-and-Terminology.md | 4 +-
docs/UserGuide/Data-Concept/Schema-Template.md | 6 +-
docs/UserGuide/Data-Concept/Time-Partition.md | 2 +-
docs/UserGuide/Ecosystem-Integration/DBeaver.md | 16 ++---
.../Ecosystem-Integration/Grafana-Connector.md | 6 +-
.../Ecosystem-Integration/Grafana-Plugin.md | 58 +++++++--------
.../UserGuide/Ecosystem-Integration/Spark-IoTDB.md | 2 +-
.../Ecosystem-Integration/Spark-TsFile.md | 4 +-
.../Ecosystem-Integration/Writing-Data-on-HDFS.md | 2 +-
.../Ecosystem-Integration/Zeppelin-IoTDB.md | 8 +--
.../Edge-Cloud-Collaboration/Sync-Tool.md | 2 +-
docs/UserGuide/IoTDB-Introduction/Architecture.md | 2 +-
docs/UserGuide/IoTDB-Introduction/Scenario.md | 14 ++--
docs/UserGuide/Maintenance-Tools/JMX-Tool.md | 4 +-
docs/UserGuide/Maintenance-Tools/Log-Tool.md | 6 +-
docs/UserGuide/Monitor-Alert/Alerting.md | 2 +-
docs/UserGuide/Monitor-Alert/Metric-Tool.md | 10 +--
.../Operate-Metadata/Auto-Create-MetaData.md | 2 +-
docs/UserGuide/Operate-Metadata/Timeseries.md | 2 +-
docs/UserGuide/Operators-Functions/Sample.md | 6 +-
.../Operators-Functions/User-Defined-Function.md | 10 +--
docs/UserGuide/Query-Data/Continuous-Query.md | 8 +--
docs/UserGuide/Query-Data/Group-By.md | 6 +-
.../UserGuide/QuickStart/Command-Line-Interface.md | 24 +++----
docs/UserGuide/Reference/TSDB-Comparison.md | 16 ++---
docs/zh/UserGuide/API/InfluxDB-Protocol.md | 10 +--
docs/zh/UserGuide/API/Programming-MQTT.md | 4 +-
.../UserGuide/API/Programming-Python-Native-API.md | 2 +-
docs/zh/UserGuide/Cluster/Cluster-Concept.md | 4 +-
.../Data-Concept/Data-Model-and-Terminology.md | 4 +-
docs/zh/UserGuide/Data-Concept/Schema-Template.md | 6 +-
docs/zh/UserGuide/Data-Concept/Time-Partition.md | 2 +-
docs/zh/UserGuide/Ecosystem-Integration/DBeaver.md | 16 ++---
.../Ecosystem-Integration/Grafana-Connector.md | 6 +-
.../Ecosystem-Integration/Grafana-Plugin.md | 58 +++++++--------
.../UserGuide/Ecosystem-Integration/Workbench.md | 82 +++++++++++-----------
.../Ecosystem-Integration/Writing-Data-on-HDFS.md | 2 +-
.../Ecosystem-Integration/Zeppelin-IoTDB.md | 8 +--
.../Edge-Cloud-Collaboration/Sync-Tool.md | 2 +-
.../UserGuide/IoTDB-Introduction/Architecture.md | 2 +-
docs/zh/UserGuide/IoTDB-Introduction/Scenario.md | 14 ++--
docs/zh/UserGuide/Maintenance-Tools/JMX-Tool.md | 4 +-
docs/zh/UserGuide/Maintenance-Tools/Log-Tool.md | 6 +-
docs/zh/UserGuide/Monitor-Alert/Alerting.md | 2 +-
docs/zh/UserGuide/Monitor-Alert/Metric-Tool.md | 6 +-
docs/zh/UserGuide/Operate-Metadata/Timeseries.md | 2 +-
docs/zh/UserGuide/Operators-Functions/Sample.md | 6 +-
.../Operators-Functions/User-Defined-Function.md | 2 +-
docs/zh/UserGuide/Query-Data/Continuous-Query.md | 8 +--
docs/zh/UserGuide/Query-Data/Group-By.md | 6 +-
.../UserGuide/QuickStart/Command-Line-Interface.md | 24 +++----
docs/zh/UserGuide/Reference/TSDB-Comparison.md | 14 ++--
docs/zh/UserGuide/Trigger/Implement-Trigger.md | 4 +-
58 files changed, 275 insertions(+), 275 deletions(-)
diff --git a/docs/UserGuide/API/InfluxDB-Protocol.md b/docs/UserGuide/API/InfluxDB-Protocol.md
index 2530c655e4..1bb0a5a15e 100644
--- a/docs/UserGuide/API/InfluxDB-Protocol.md
+++ b/docs/UserGuide/API/InfluxDB-Protocol.md
@@ -51,9 +51,9 @@ InfluxDB influxDB = IoTDBInfluxDBFactory.connect(openurl, username, password);
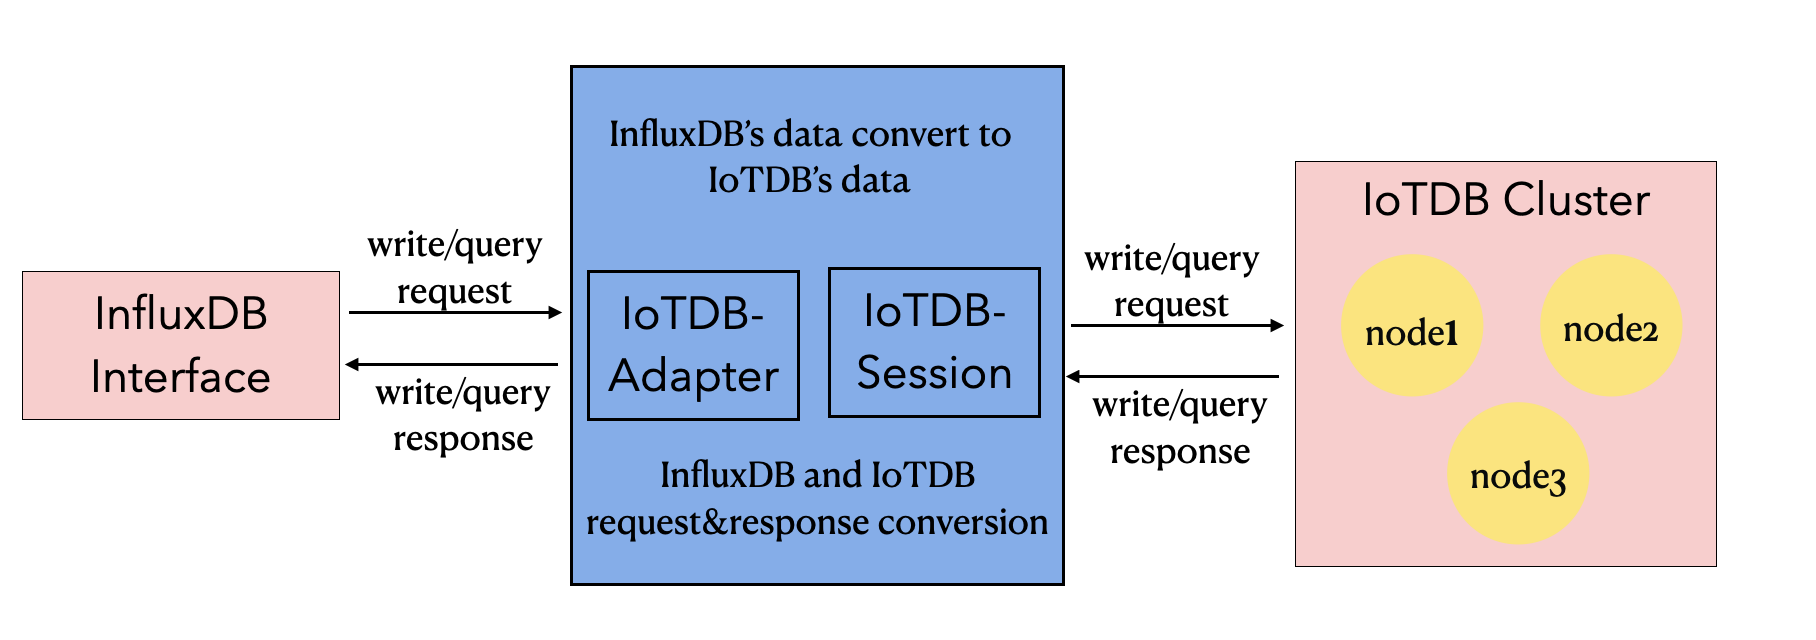
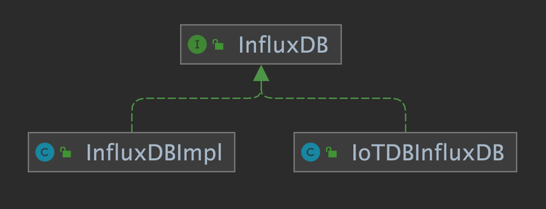
Based on the IoTDB Java ServiceProvider interface, the adapter implements the 'interface InfluxDB' of the java interface of InfluxDB, and provides users with all the interface methods of InfluxDB. End users can use the InfluxDB protocol to initiate write and read requests to IoTDB without perception.
-
+
-
+
### 2.2 Metadata Format Conversion
@@ -66,7 +66,7 @@ The metadata of InfluxDB is tag field model, and the metadata of IoTDB is tree m
3. tags: various indexed attributes.
4. fields: various record values(attributes without index).
-
+
#### 2.2.2 IoTDB Metadata
@@ -74,7 +74,7 @@ The metadata of InfluxDB is tag field model, and the metadata of IoTDB is tree m
2. path(time series ID): storage path.
3. measurement: physical quantity.
-
+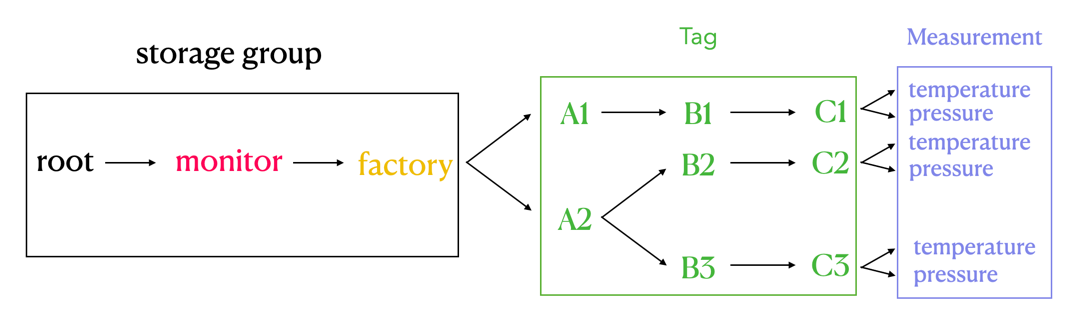
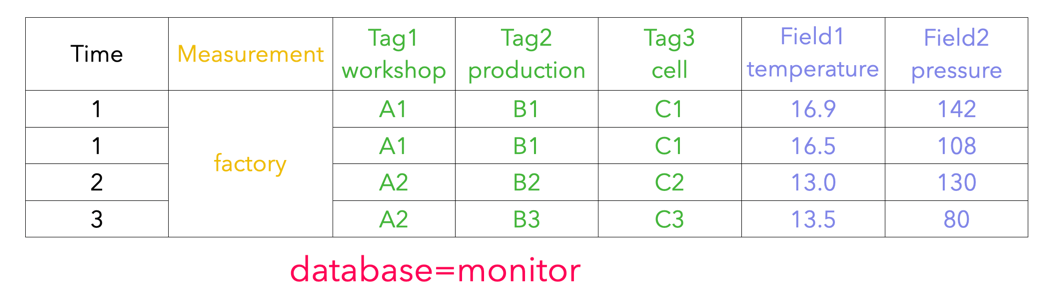
#### 2.2.3 Mapping relationship between the two
@@ -87,7 +87,7 @@ The transformation relationship from InfluxDB metadata to IoTDB metadata can be
`root.{database}.{measurement}.{tag value 1}.{tag value 2}...{tag value N-1}.{tag value N}.{field key}`
-
+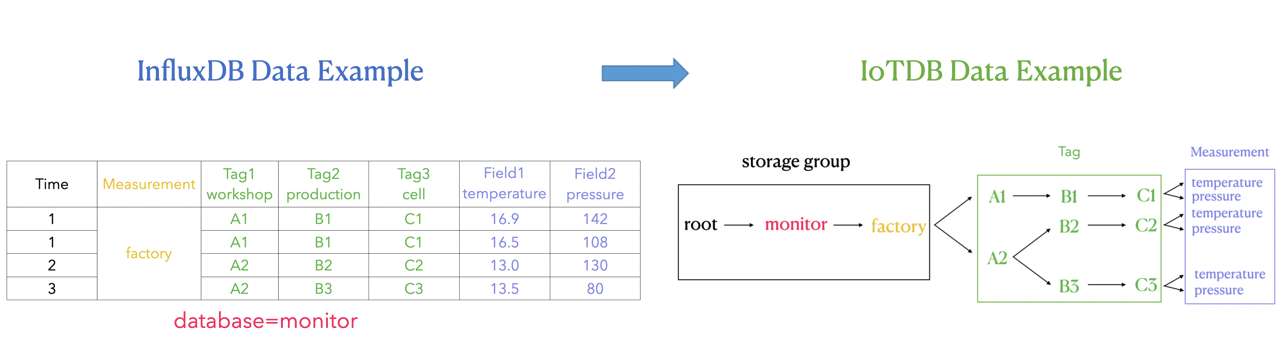
As shown in the figure above, it can be seen that:
diff --git a/docs/UserGuide/API/Programming-MQTT.md b/docs/UserGuide/API/Programming-MQTT.md
index 84838a5ec1..ffd8b5778e 100644
--- a/docs/UserGuide/API/Programming-MQTT.md
+++ b/docs/UserGuide/API/Programming-MQTT.md
@@ -27,7 +27,7 @@ It is useful for connections with remote locations where a small code footprint
IoTDB supports the MQTT v3.1(an OASIS Standard) protocol.
IoTDB server includes a built-in MQTT service that allows remote devices send messages into IoTDB server directly.
-<img style="width:100%; max-width:800px; max-height:600px; margin-left:auto; margin-right:auto; display:block;" src="/img/github/78357432-0c71cf80-75e4-11ea-98aa-c43a54d469ce.png">
+<img style="width:100%; max-width:800px; max-height:600px; margin-left:auto; margin-right:auto; display:block;" src="https://alioss.timecho.com/docs/img/github/78357432-0c71cf80-75e4-11ea-98aa-c43a54d469ce.png">
### Built-in MQTT Service
@@ -56,7 +56,7 @@ or
```
or json array of the above two.
-<img style="width:100%; max-width:800px; max-height:600px; margin-left:auto; margin-right:auto; display:block;" src="/img/github/78357469-1bf11880-75e4-11ea-978f-a53996667a0d.png">
+<img style="width:100%; max-width:800px; max-height:600px; margin-left:auto; margin-right:auto; display:block;" src="https://alioss.timecho.com/docs/img/github/78357469-1bf11880-75e4-11ea-978f-a53996667a0d.png">
### MQTT Configurations
The IoTDB MQTT service load configurations from `${IOTDB_HOME}/${IOTDB_CONF}/iotdb-datanode.properties` by default.
diff --git a/docs/UserGuide/API/Programming-Python-Native-API.md b/docs/UserGuide/API/Programming-Python-Native-API.md
index 3eafe54b34..1233a071dd 100644
--- a/docs/UserGuide/API/Programming-Python-Native-API.md
+++ b/docs/UserGuide/API/Programming-Python-Native-API.md
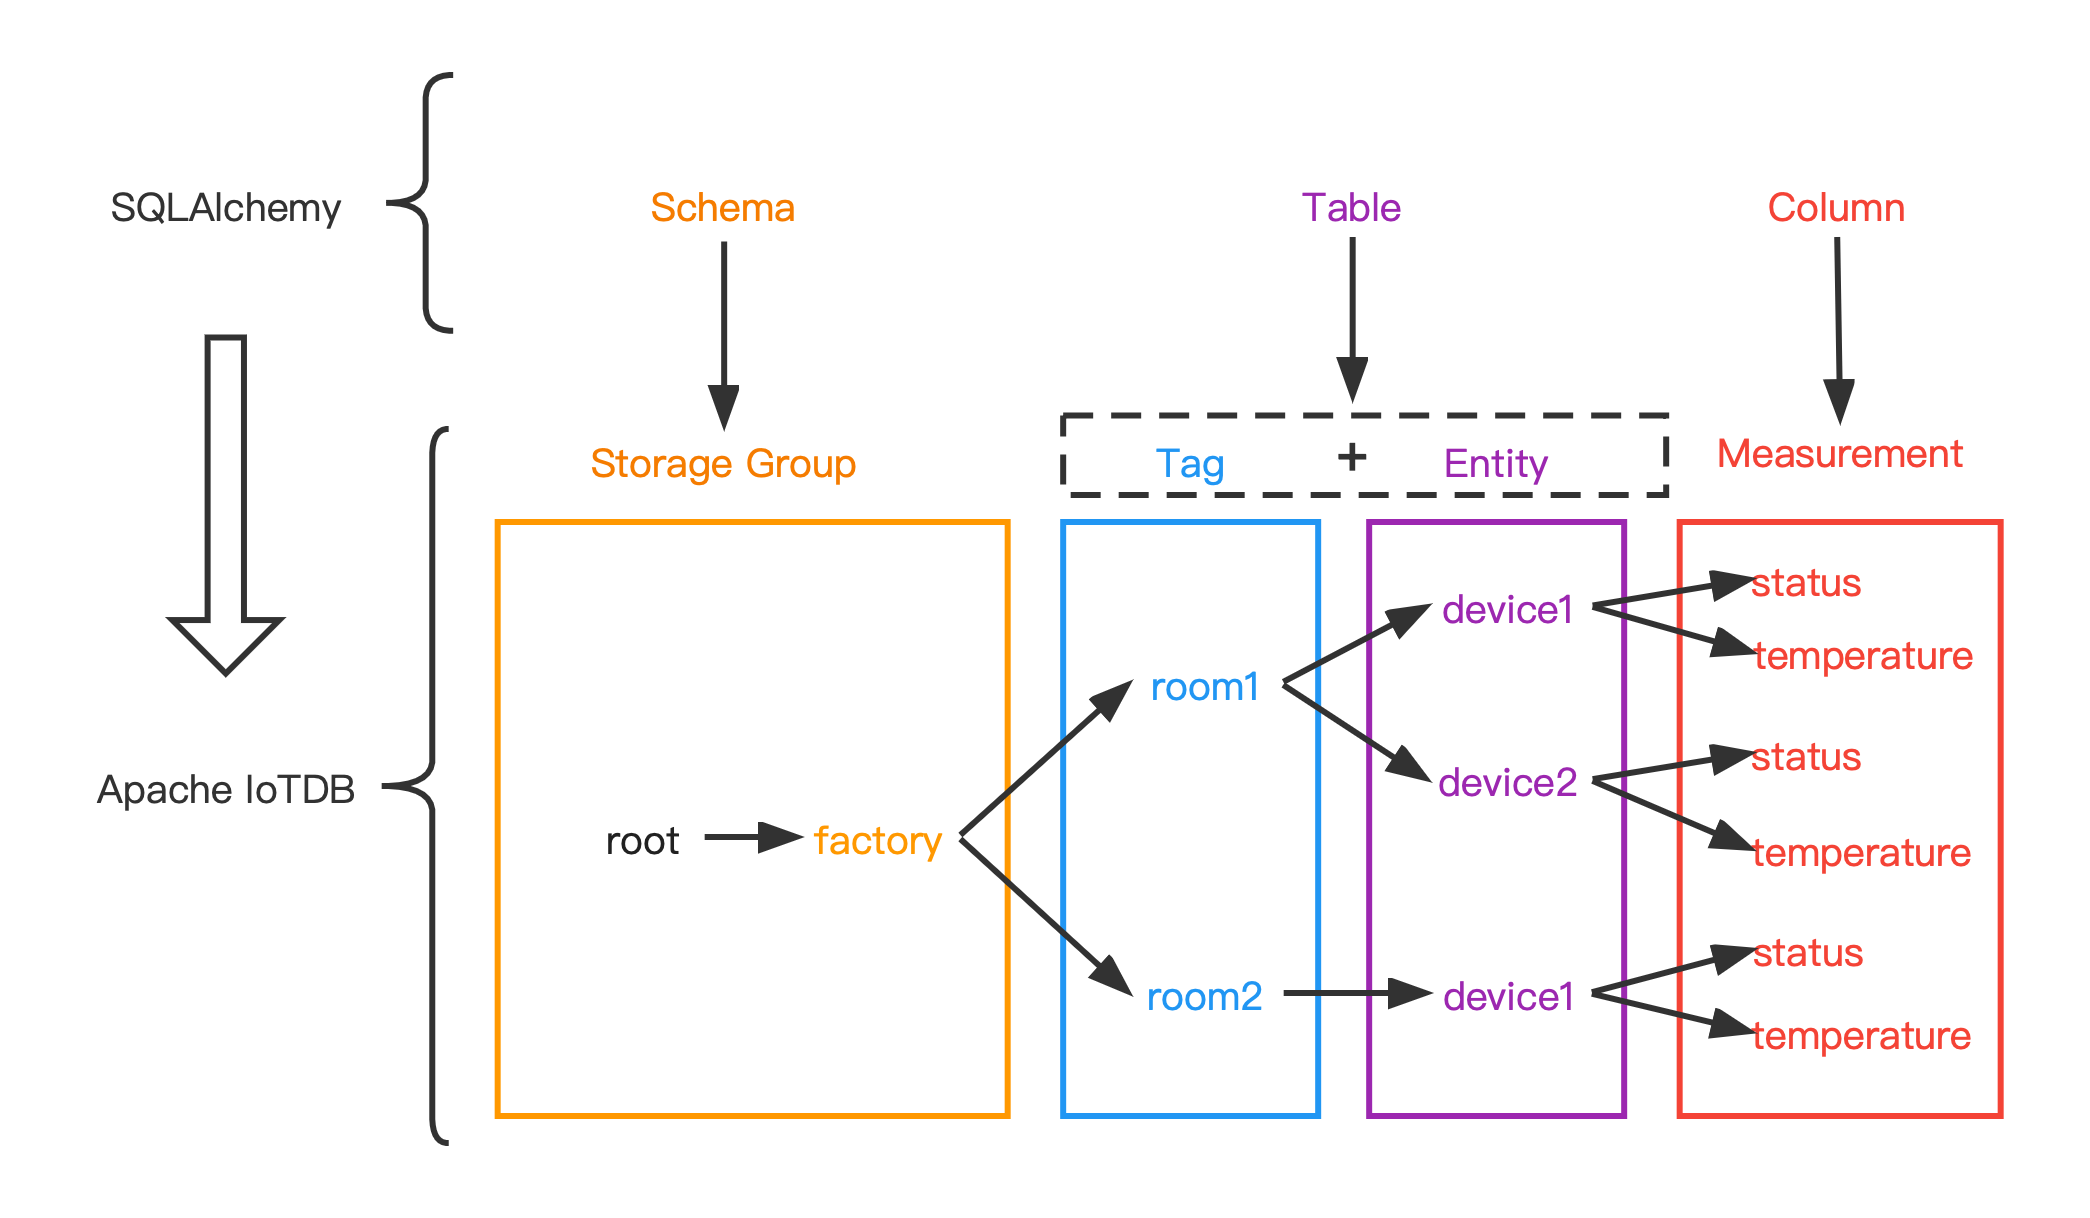
@@ -529,7 +529,7 @@ The mapping relationship between them is:
The following figure shows the relationship between the two more intuitively:
-
+
#### Data type mapping
| data type in IoTDB | data type in SQLAlchemy |
diff --git a/docs/UserGuide/Cluster/Cluster-Concept.md b/docs/UserGuide/Cluster/Cluster-Concept.md
index 5131adc865..aa9bc127ac 100644
--- a/docs/UserGuide/Cluster/Cluster-Concept.md
+++ b/docs/UserGuide/Cluster/Cluster-Concept.md
@@ -27,7 +27,7 @@ Apache IoTDB Cluster contains two types of nodes: ConfigNode and DataNode, each
An illustration of the cluster architecture:
-<img style="width:100%; max-width:500px; max-height:400px; margin-left:auto; margin-right:auto; display:block;" src="/img/UserGuide/Cluster/Architecture.png?raw=true">
+<img style="width:100%; max-width:500px; max-height:400px; margin-left:auto; margin-right:auto; display:block;" src="https://alioss.timecho.com/docs/img/UserGuide/Cluster/Architecture.png?raw=true">
ConfigNode is the control node of the cluster, which manages the cluster's node status, partition information, etc. All ConfigNodes in the cluster form a highly available group, which is fully replicated.
@@ -98,7 +98,7 @@ A region is the basic unit of replication. Multiple replicas of a region constru
An illustration of the partition allocation in cluster:
-<img style="width:100%; max-width:500px; max-height:500px; margin-left:auto; margin-right:auto; display:block;" src="/img/UserGuide/Cluster/Data-Partition.png?raw=true">
+<img style="width:100%; max-width:500px; max-height:500px; margin-left:auto; margin-right:auto; display:block;" src="https://alioss.timecho.com/docs/img/UserGuide/Cluster/Data-Partition.png?raw=true">
The figure contains 1 SchemaRegionGroup, and the schema_replication_factor is 3, so the 3 white SchemaRegion-0s form a replication group.
diff --git a/docs/UserGuide/Cluster/Cluster-Maintenance.md b/docs/UserGuide/Cluster/Cluster-Maintenance.md
index 8c3ab7c809..708c85f7b3 100644
--- a/docs/UserGuide/Cluster/Cluster-Maintenance.md
+++ b/docs/UserGuide/Cluster/Cluster-Maintenance.md
@@ -125,7 +125,7 @@ It costs 0.006s
### DataNode status definition
The state machine of DataNode is shown in the figure below:
-<img style="width:100%; max-width:500px; max-height:500px; margin-left:auto; margin-right:auto; display:block;" src="/img/UserGuide/Cluster/DataNode-StateMachine-EN.jpg?raw=true">
+<img style="width:100%; max-width:500px; max-height:500px; margin-left:auto; margin-right:auto; display:block;" src="https://alioss.timecho.com/docs/img/UserGuide/Cluster/DataNode-StateMachine-EN.jpg?raw=true">
The DataNode statuses are defined as follows:
diff --git a/docs/UserGuide/Data-Concept/Data-Model-and-Terminology.md b/docs/UserGuide/Data-Concept/Data-Model-and-Terminology.md
index 482bfded97..3f4c41510b 100644
--- a/docs/UserGuide/Data-Concept/Data-Model-and-Terminology.md
+++ b/docs/UserGuide/Data-Concept/Data-Model-and-Terminology.md
@@ -25,7 +25,7 @@ A wind power IoT scenario is taken as an example to illustrate how to creat a co
According to the enterprise organization structure and equipment entity hierarchy, it is expressed as an attribute hierarchy structure, as shown below. The hierarchical from top to bottom is: power group layer - power plant layer - entity layer - measurement layer. ROOT is the root node, and each node of measurement layer is a leaf node. In the process of using IoTDB, the attributes on the path from ROOT node is directly connected to each leaf node with ".", thus forming the name of a ti [...]
-<center><img style="width:100%; max-width:800px; max-height:600px; margin-left:auto; margin-right:auto; display:block;" src="/img/github/122668849-b1c69280-d1ec-11eb-83cb-3b73c40bdf72.png"></center>
+<center><img style="width:100%; max-width:800px; max-height:600px; margin-left:auto; margin-right:auto; display:block;" src="https://alioss.timecho.com/docs/img/github/122668849-b1c69280-d1ec-11eb-83cb-3b73c40bdf72.png"></center>
Here are the basic concepts of the model involved in IoTDB.
@@ -132,7 +132,7 @@ When querying, you can query each timeseries separately.
When inserting data, it is allowed to insert null value in the aligned timeseries.
-<img style="width:100%; max-width:800px; max-height:600px; margin-left:auto; margin-right:auto; display:block;" src="/img/github/114125919-f4850800-9929-11eb-8211-81d4c04af1ec.png">
+<img style="width:100%; max-width:800px; max-height:600px; margin-left:auto; margin-right:auto; display:block;" src="https://alioss.timecho.com/docs/img/github/114125919-f4850800-9929-11eb-8211-81d4c04af1ec.png">
In the following chapters of data definition language, data operation language and Java Native Interface, various operations related to aligned timeseries will be introduced one by one.
diff --git a/docs/UserGuide/Data-Concept/Schema-Template.md b/docs/UserGuide/Data-Concept/Schema-Template.md
index 2285ca330c..a5fe6c47fa 100644
--- a/docs/UserGuide/Data-Concept/Schema-Template.md
+++ b/docs/UserGuide/Data-Concept/Schema-Template.md
@@ -29,7 +29,7 @@ In order to enable different entities of the same type to share metadata, reduce
The following picture illustrates the data model of petrol vehicle scenario. The velocity, fuel amount, acceleration, and angular velocity of each petrol vehicle spread over cities will be collected. Obviously, the measurements of single petrol vehicle are the same as those of another.
-<img style="width:100%; max-width:800px; max-height:600px; margin-left:auto; margin-right:auto; display:block;" src="/img/UserGuide/Data-Concept/Measurement-Template/example_without_template.png" alt="example without template">
+<img style="width:100%; max-width:800px; max-height:600px; margin-left:auto; margin-right:auto; display:block;" src="https://alioss.timecho.com/docs/img/UserGuide/Data-Concept/Measurement-Template/example_without_template.png" alt="example without template">
## Concept
@@ -45,7 +45,7 @@ In the following chapters of data definition language, data operation language a
After applying schema template, the following picture illustrates the new data model of petrol vehicle scenario. All petrol vehicles share the schemas defined in template. There are no redundancy storage of measurement schemas.
-<img style="width:100%; max-width:800px; max-height:600px; margin-left:auto; margin-right:auto; display:block;" src="/img/UserGuide/Data-Concept/Measurement-Template/example_with_template.png" alt="example with template">
+<img style="width:100%; max-width:800px; max-height:600px; margin-left:auto; margin-right:auto; display:block;" src="https://alioss.timecho.com/docs/img/UserGuide/Data-Concept/Measurement-Template/example_with_template.png" alt="example with template">
### Lifetime of Schema Template
@@ -60,7 +60,7 @@ The term about lifetime of schema template may help you utilize it in a better w
It should be complemented that the distinction between SET and ACTIVATE is meant to serve an ubiquitous scenario where massive nodes with a common ancestor may need to apply the template. Under this circumstance, it is more feasible to SET the template on the common ancestor rather than all those descendant. For those who needs to apply the template, ACTIVATE is a more appropriate arrangement.
-<img style="width:100%; max-width:800px; margin-left:auto; margin-right:auto; display:block;" src="/img/UserGuide/Data-Concept/Measurement-Template/example_template_lifetime.png" alt="example with template">
+<img style="width:100%; max-width:800px; margin-left:auto; margin-right:auto; display:block;" src="https://alioss.timecho.com/docs/img/UserGuide/Data-Concept/Measurement-Template/example_template_lifetime.png" alt="example with template">
## Usage
diff --git a/docs/UserGuide/Data-Concept/Time-Partition.md b/docs/UserGuide/Data-Concept/Time-Partition.md
index f67919e1e9..736c1e7020 100644
--- a/docs/UserGuide/Data-Concept/Time-Partition.md
+++ b/docs/UserGuide/Data-Concept/Time-Partition.md
@@ -38,7 +38,7 @@ Time partition divides data according to time, and a time partition is used to s
Enable time partition and set partition_interval to 86400000 (one day), then the data distribution is shown as the following figure:
-<img style="width:100%; max-width:800px; max-height:600px; margin-left:auto; margin-right:auto; display:block;" src="/img/UserGuide/Data-Concept/Time-Partition/time_partition_example.png?raw=true" alt="time partition example">
+<img style="width:100%; max-width:800px; max-height:600px; margin-left:auto; margin-right:auto; display:block;" src="https://alioss.timecho.com/docs/img/UserGuide/Data-Concept/Time-Partition/time_partition_example.png?raw=true" alt="time partition example">
* Insert one datapoint with timestamp 0, calculate 0/86400000 = 0, then this datapoint will be stored in TsFile under folder 0
diff --git a/docs/UserGuide/Ecosystem-Integration/DBeaver.md b/docs/UserGuide/Ecosystem-Integration/DBeaver.md
index 5392b50c59..327c92adeb 100644
--- a/docs/UserGuide/Ecosystem-Integration/DBeaver.md
+++ b/docs/UserGuide/Ecosystem-Integration/DBeaver.md
@@ -45,11 +45,11 @@ DBeaver is a SQL client software application and a database administration tool.
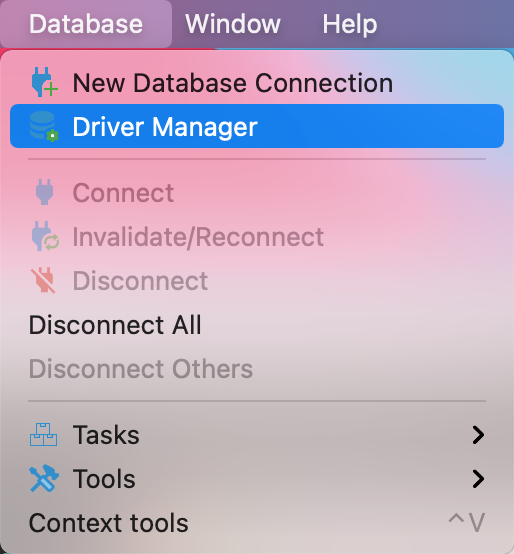
2. Start DBeaver
3. Open Driver Manager
- 
+ 
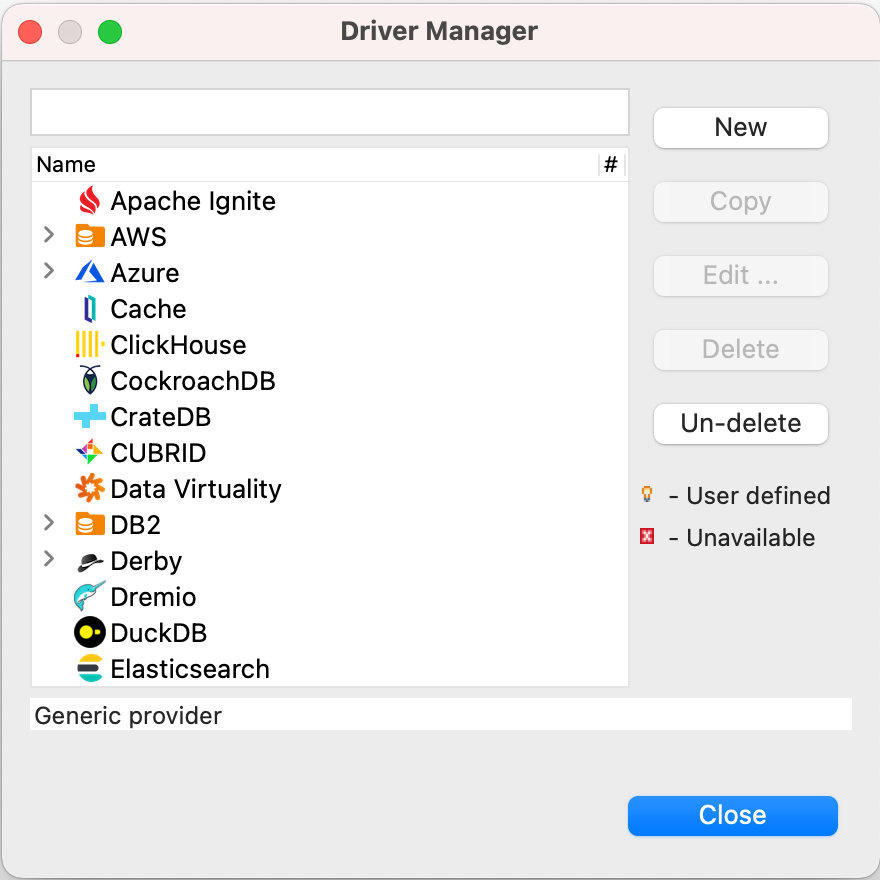
4. Create a new driver type for IoTDB
- 
+ 
5. Download [Sources](https://iotdb.apache.org/Download/),unzip it and compile jdbc driver by the following command
@@ -58,15 +58,15 @@ DBeaver is a SQL client software application and a database administration tool.
```
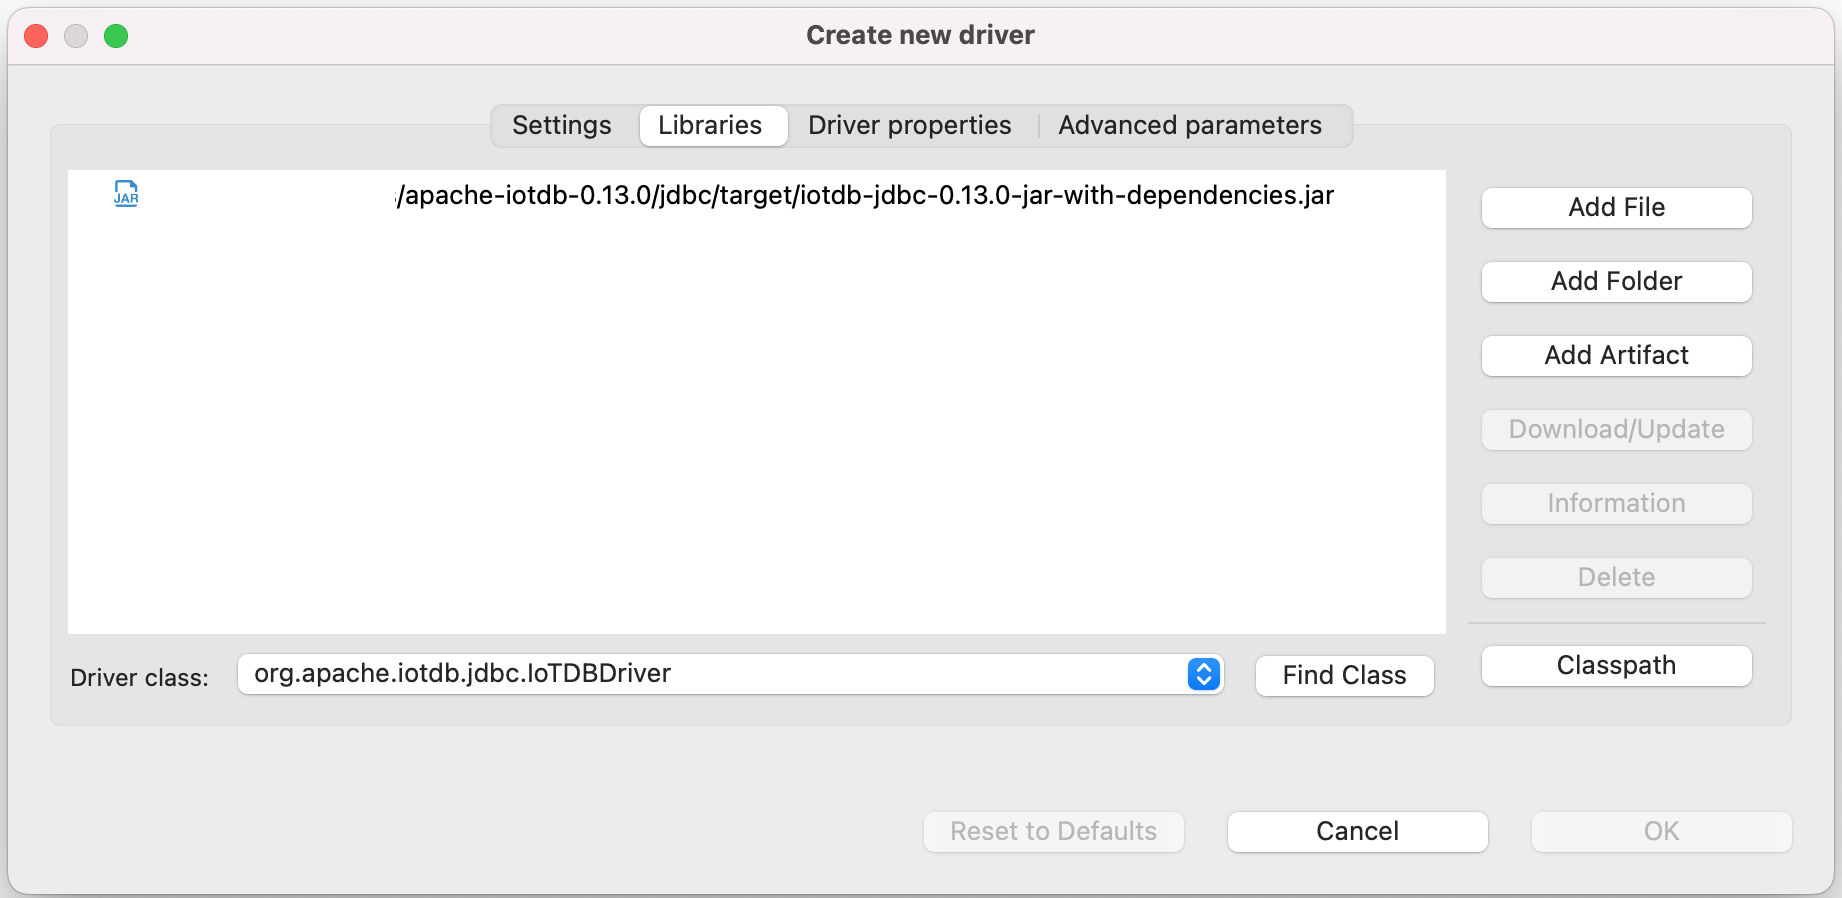
6. Find and add a lib named `apache-iotdb-jdbc-{version}-jar-with-dependencies.jar`, which should be under `jdbc/target/`, then select `Find Class`.
- 
+ 
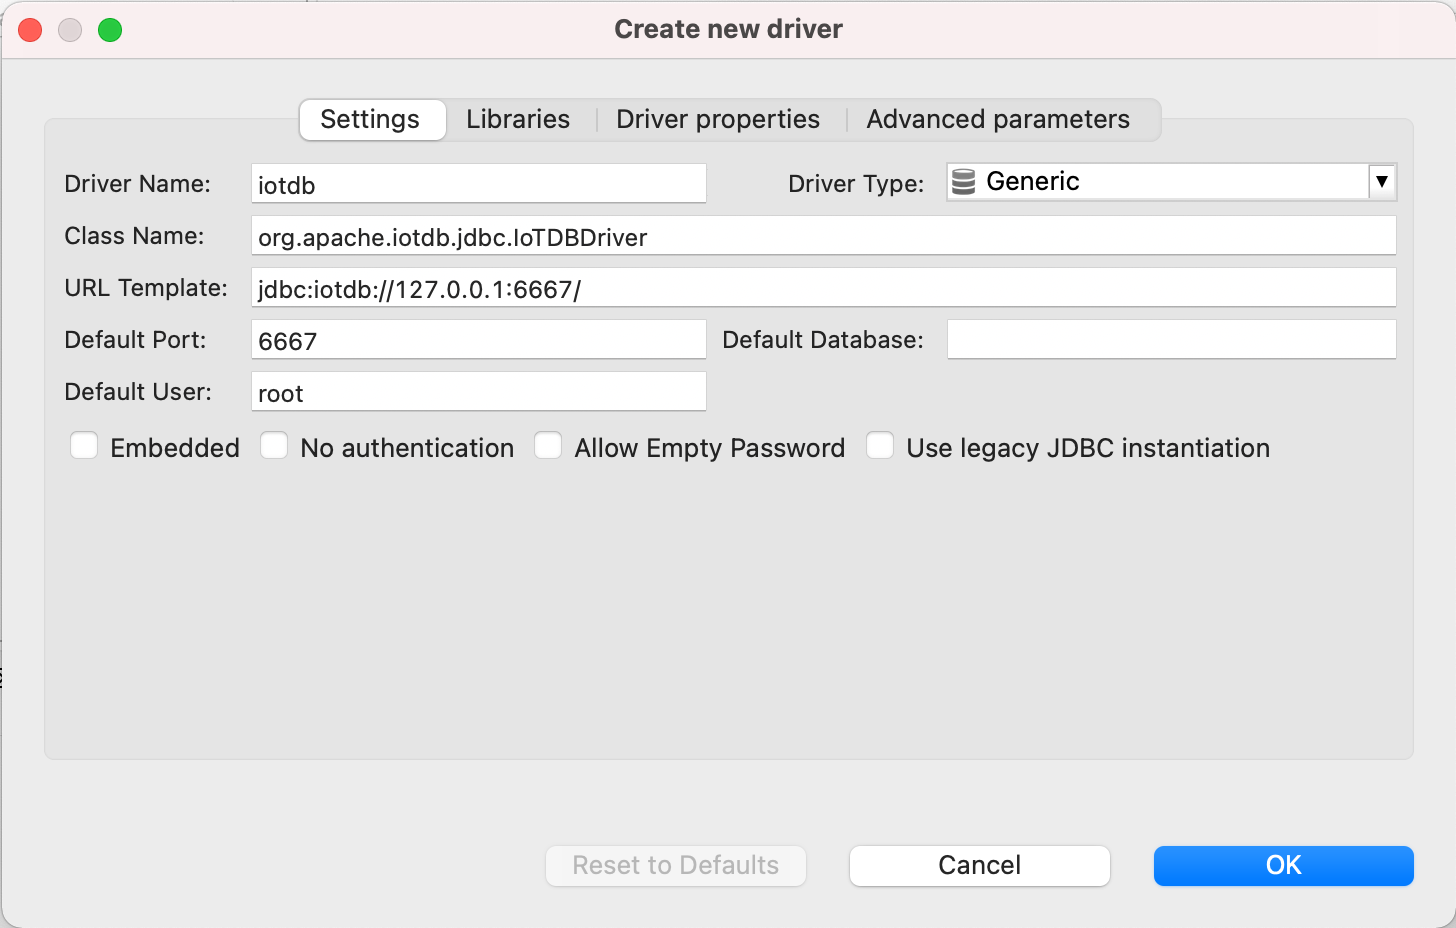
8. Edit the driver Settings
- 
+ 
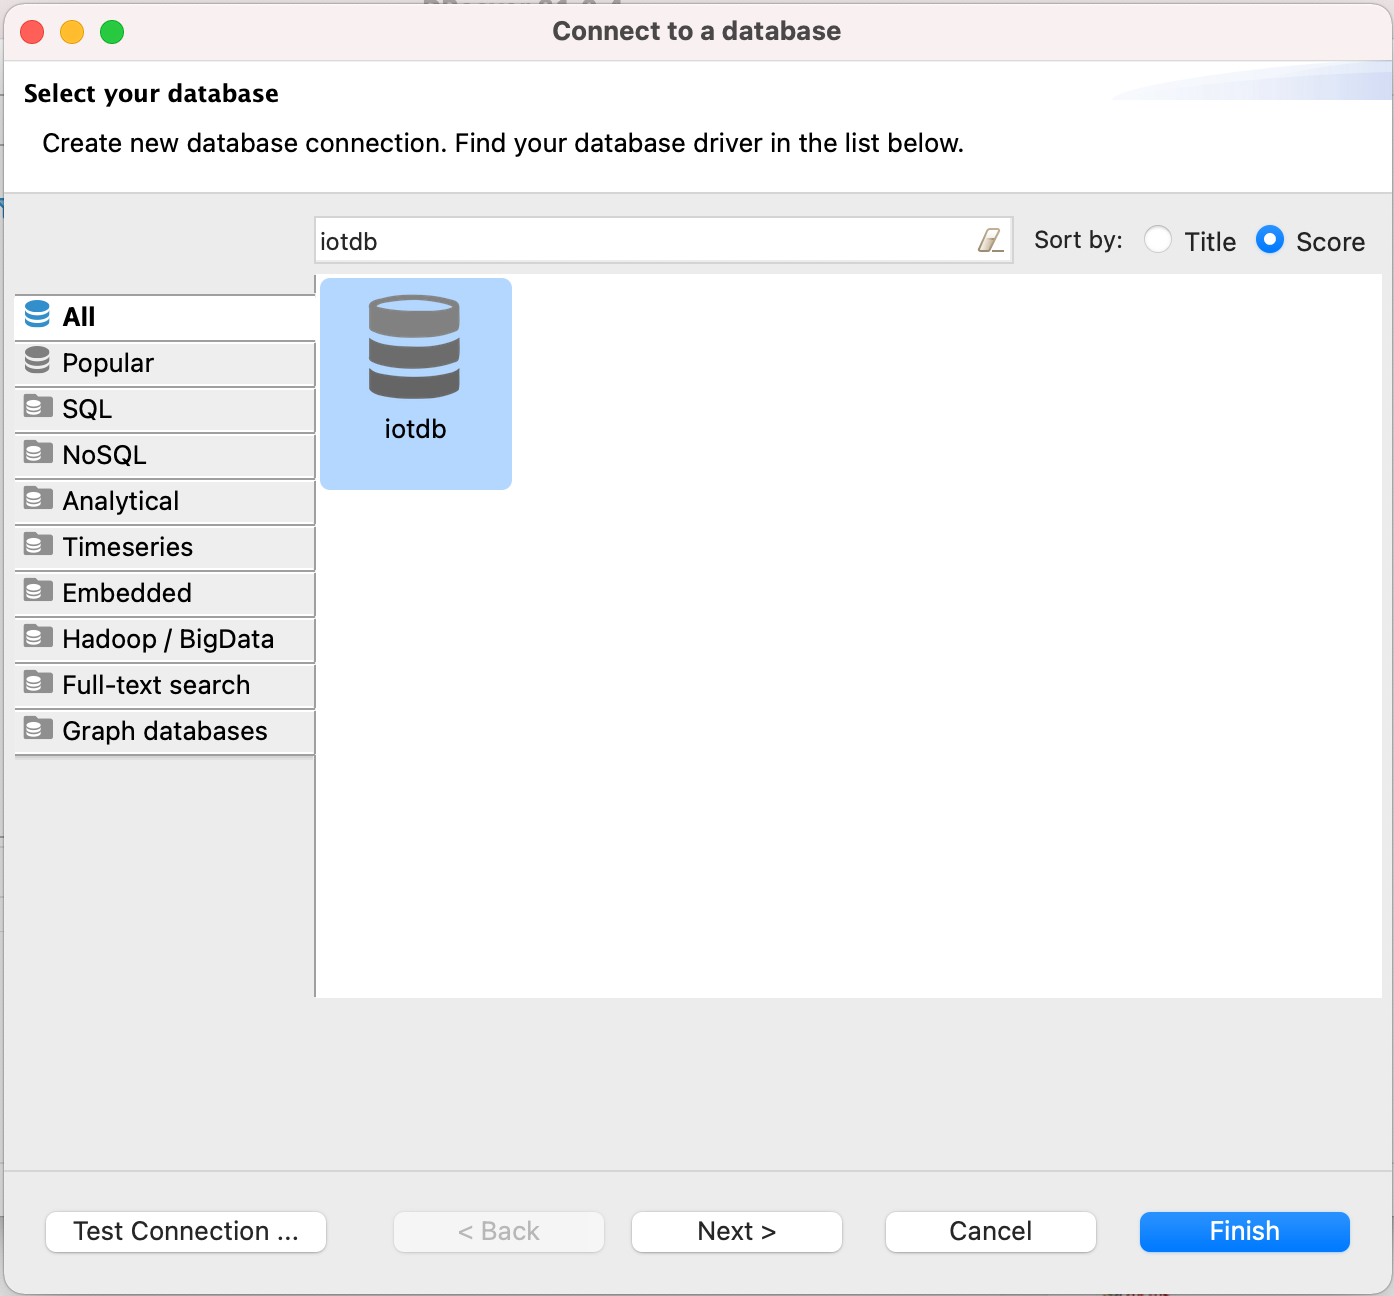
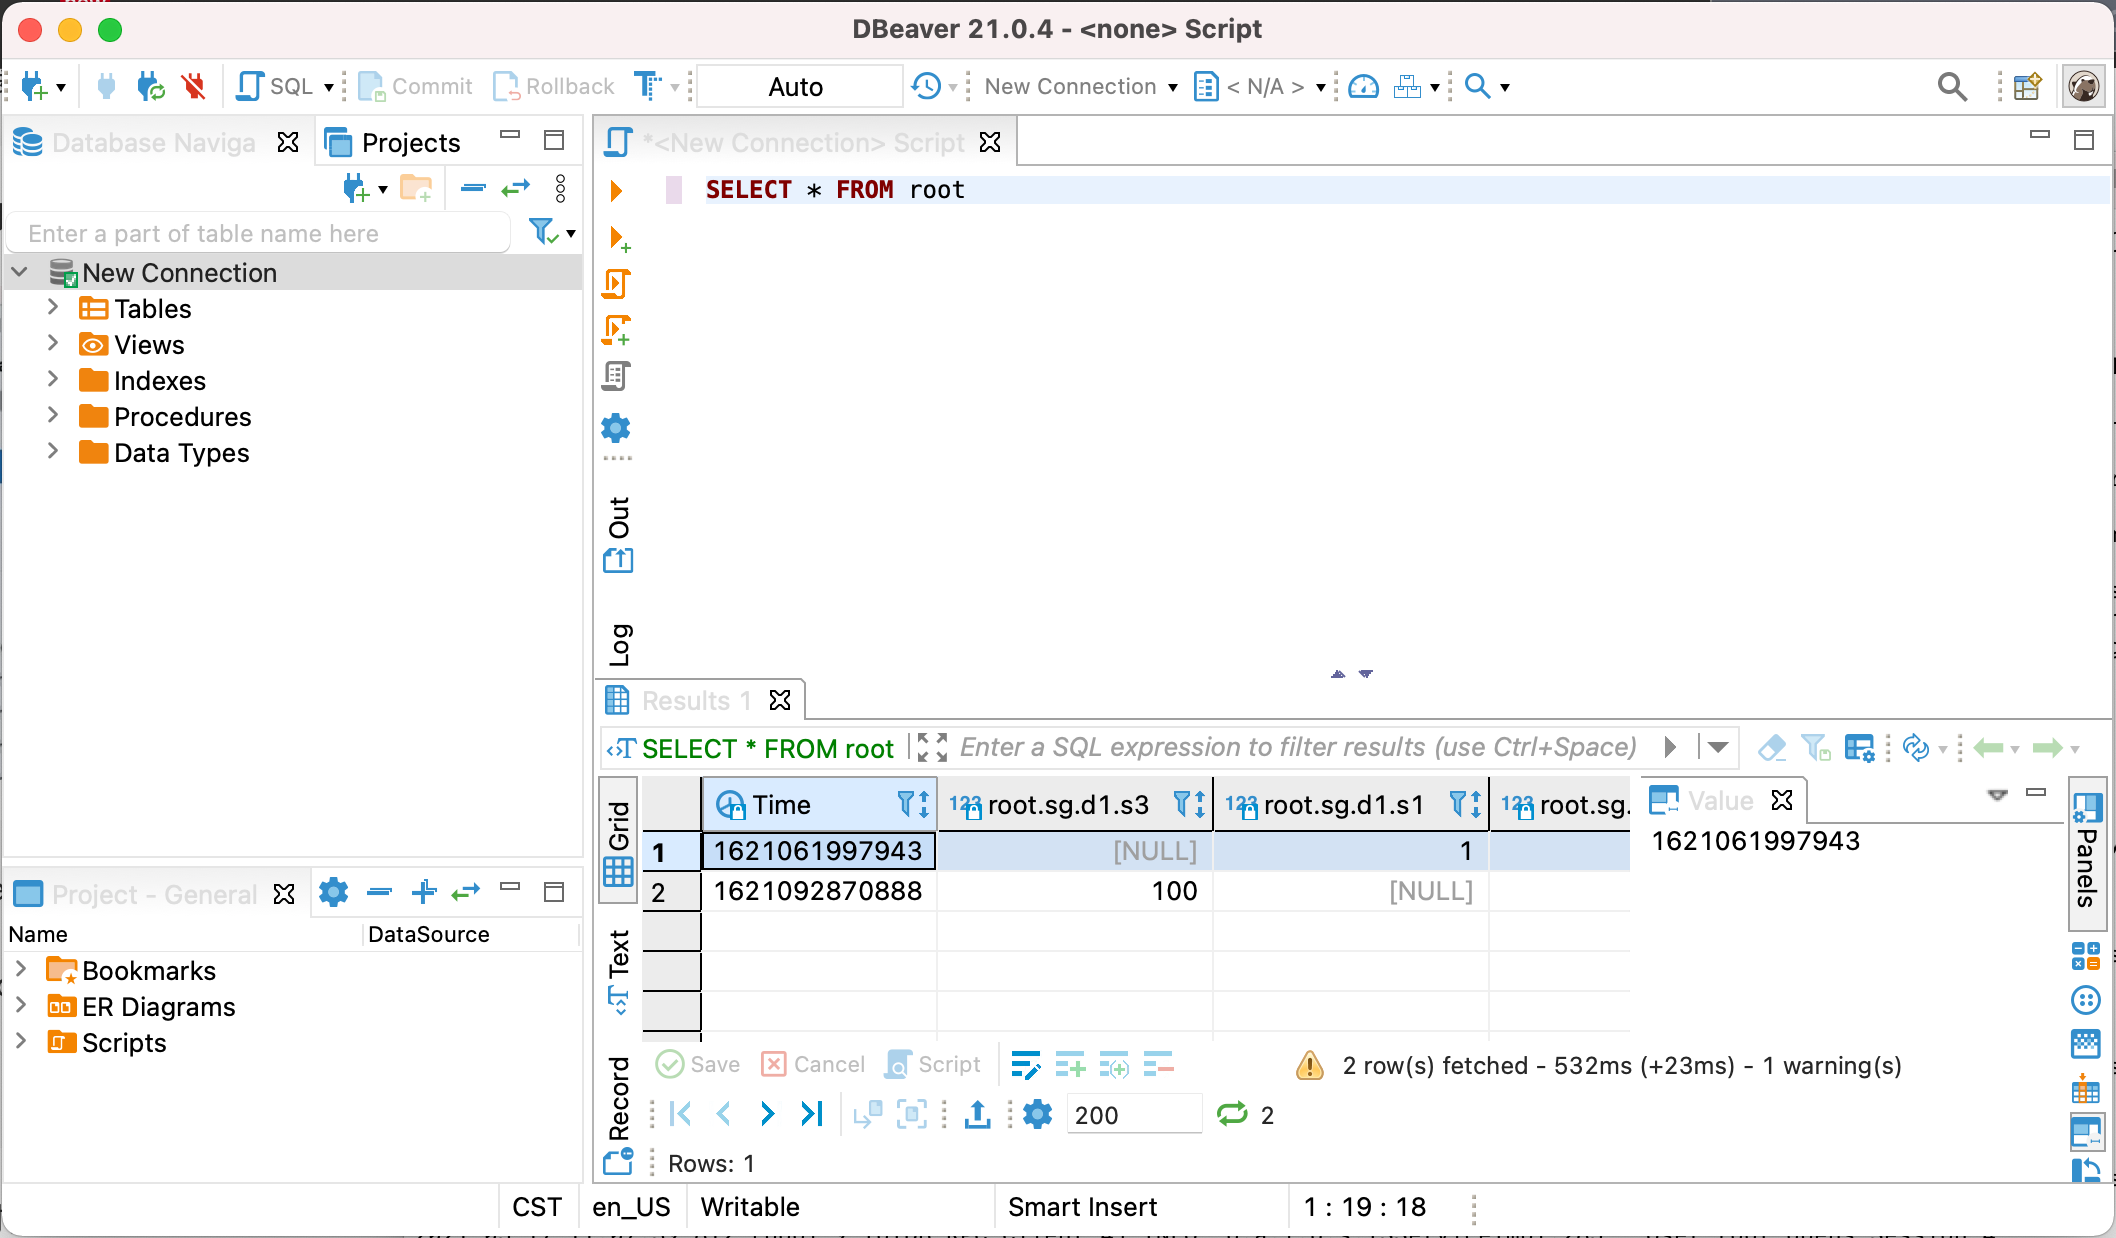
9. Open New DataBase Connection and select iotdb
- 
+ 
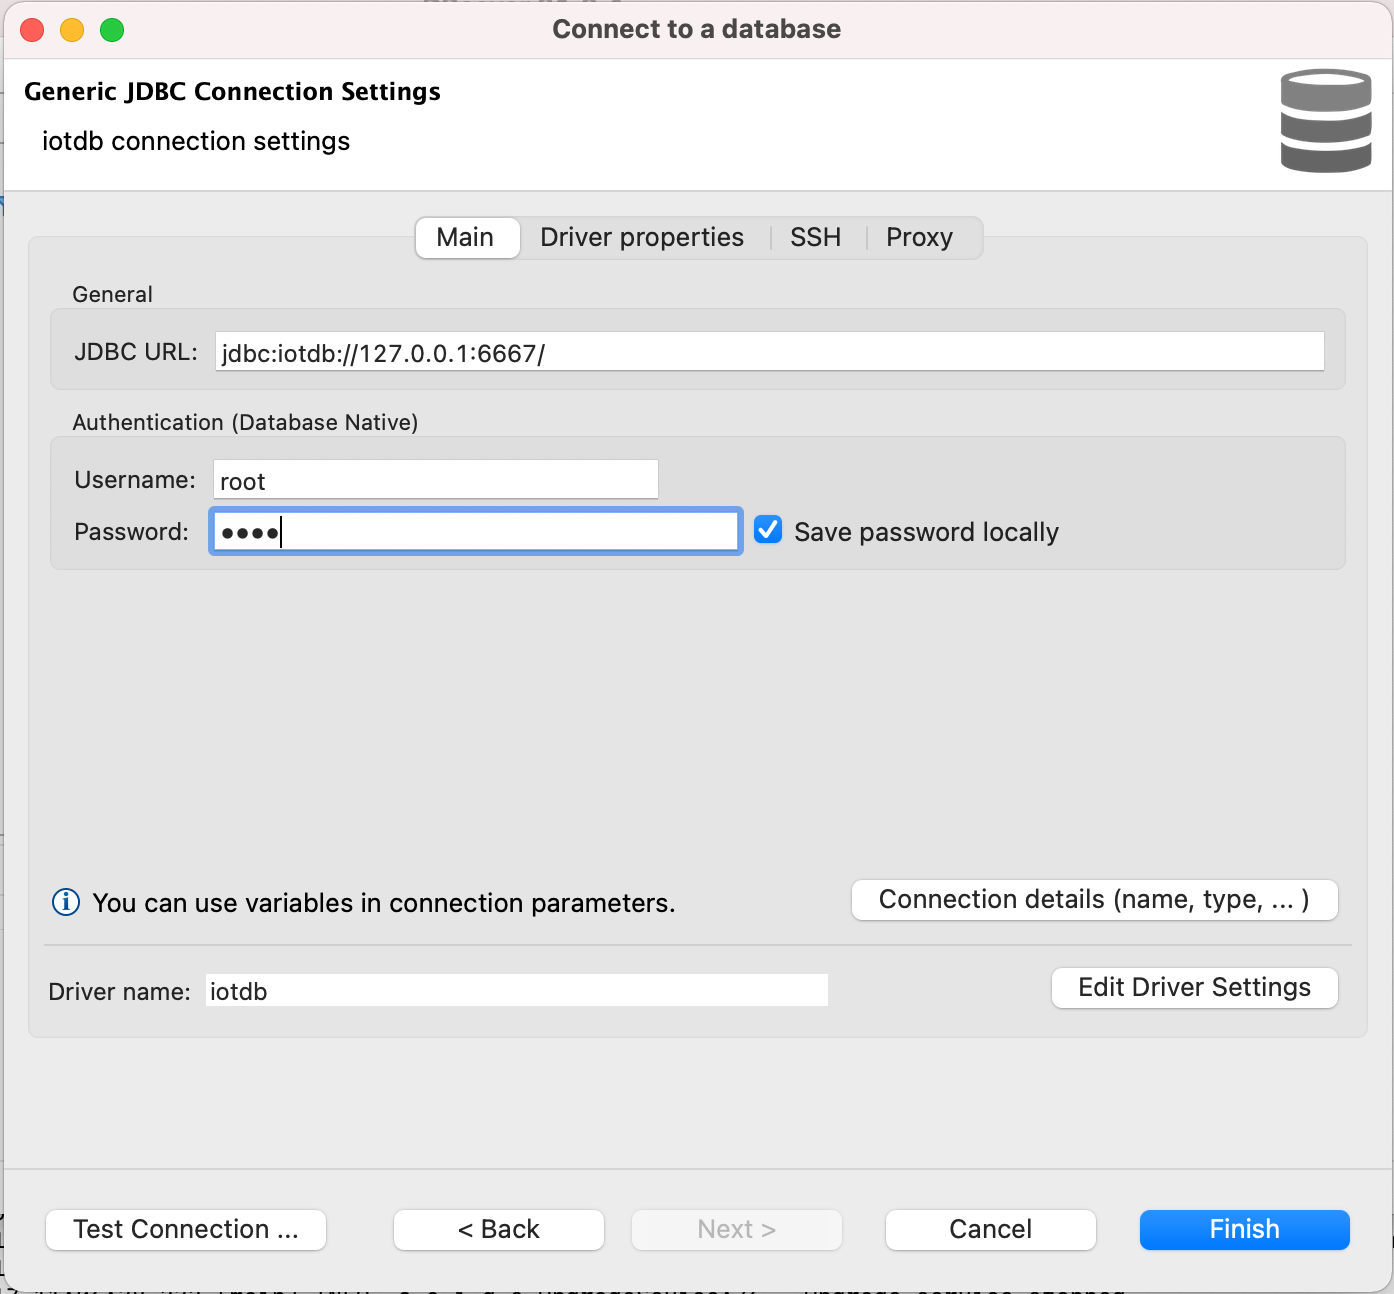
10. Edit JDBC Connection Settings
@@ -75,12 +75,12 @@ DBeaver is a SQL client software application and a database administration tool.
Username: root
Password: root
```
- 
+ 
11. Test Connection
- 
+ 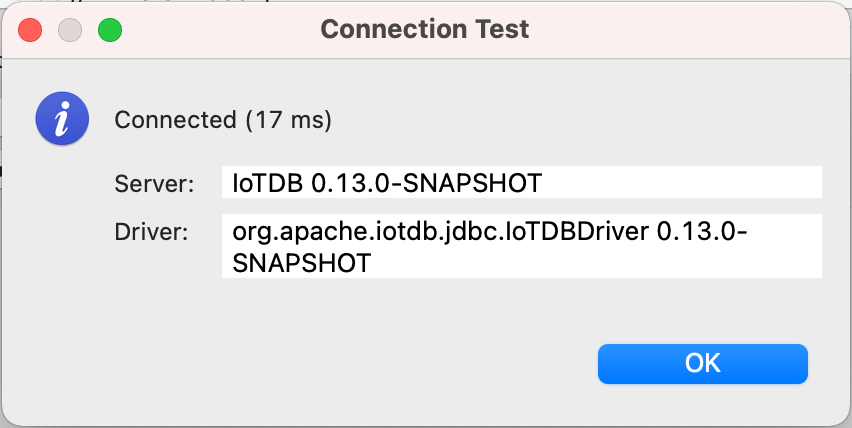
12. Enjoy IoTDB with DBeaver
- 
+ 
diff --git a/docs/UserGuide/Ecosystem-Integration/Grafana-Connector.md b/docs/UserGuide/Ecosystem-Integration/Grafana-Connector.md
index 72d26ca401..6e35dd6ec2 100644
--- a/docs/UserGuide/Ecosystem-Integration/Grafana-Connector.md
+++ b/docs/UserGuide/Ecosystem-Integration/Grafana-Connector.md
@@ -128,15 +128,15 @@ Username and password are both "admin" by default.
Select `Data Sources` and then `Add data source`, select `SimpleJson` in `Type` and `URL` is http://localhost:8888.
After that, make sure IoTDB has been started, click "Save & Test", and "Data Source is working" will be shown to indicate successful configuration.
-<img style="width:100%; max-width:800px; max-height:600px; margin-left:auto; margin-right:auto; display:block;" src="/img/github/51664777-2766ae00-1ff5-11e9-9d2f-7489f8ccbfc2.png">
+<img style="width:100%; max-width:800px; max-height:600px; margin-left:auto; margin-right:auto; display:block;" src="https://alioss.timecho.com/docs/img/github/51664777-2766ae00-1ff5-11e9-9d2f-7489f8ccbfc2.png">
-<img style="width:100%; max-width:800px; max-height:600px; margin-left:auto; margin-right:auto; display:block;" src="/img/github/51664842-554bf280-1ff5-11e9-97d2-54eebe0b2ca1.png">
+<img style="width:100%; max-width:800px; max-height:600px; margin-left:auto; margin-right:auto; display:block;" src="https://alioss.timecho.com/docs/img/github/51664842-554bf280-1ff5-11e9-97d2-54eebe0b2ca1.png">
#### Design in dashboard
Add diagrams in dashboard and customize your query. See http://docs.grafana.org/guides/getting_started/
-<img style="width:100%; max-width:800px; max-height:600px; margin-left:auto; margin-right:auto; display:block;" src="/img/github/51664878-6e54a380-1ff5-11e9-9718-4d0e24627fa8.png">
+<img style="width:100%; max-width:800px; max-height:600px; margin-left:auto; margin-right:auto; display:block;" src="https://alioss.timecho.com/docs/img/github/51664878-6e54a380-1ff5-11e9-9718-4d0e24627fa8.png">
### config grafana
diff --git a/docs/UserGuide/Ecosystem-Integration/Grafana-Plugin.md b/docs/UserGuide/Ecosystem-Integration/Grafana-Plugin.md
index 1b63767f9e..df76cb4f90 100644
--- a/docs/UserGuide/Ecosystem-Integration/Grafana-Plugin.md
+++ b/docs/UserGuide/Ecosystem-Integration/Grafana-Plugin.md
@@ -80,7 +80,7 @@ go get: module github.com/grafana/grafana-plugin-sdk-go: Get "https://proxy.gola
If compiling successful, you can see the `dist` directory , which contains the compiled Grafana-Plugin:
-<img style="width:100%; max-width:333px; max-height:545px; margin-left:auto; margin-right:auto; display:block;" src="/img/UserGuide/Ecosystem-Integration/Grafana-plugin/grafana-plugin-build.png?raw=true">
+<img style="width:100%; max-width:333px; max-height:545px; margin-left:auto; margin-right:auto; display:block;" src="https://alioss.timecho.com/docs/img/UserGuide/Ecosystem-Integration/Grafana-plugin/grafana-plugin-build.png?raw=true">
##### Method 3: The distribution package of IoTDB is fully compiled
@@ -94,7 +94,7 @@ Execute following command in the IoTDB root directory:
If compiling successful, you can see that the `distribution/target` directory contains the compiled Grafana-Plugin:
-<img style="width:100%; max-width:333px; max-height:545px; margin-left:auto; margin-right:auto; display:block;" src="/img/UserGuide/Ecosystem-Integration/Grafana-plugin/distribution.png?raw=true">
+<img style="width:100%; max-width:333px; max-height:545px; margin-left:auto; margin-right:auto; display:block;" src="https://alioss.timecho.com/docs/img/UserGuide/Ecosystem-Integration/Grafana-plugin/distribution.png?raw=true">
#### Install Grafana-Plugin
@@ -171,9 +171,9 @@ Grafana displays data in a web page dashboard. Please open your browser and visi
Click the `Settings` icon on the left, select the `Data Source` option, and then click `Add data source`.
-<img style="width:100%; max-width:800px; max-height:600px; margin-left:auto; margin-right:auto; display:block;" src="/img/UserGuide/Ecosystem-Integration/Grafana-plugin/datasource_1.png?raw=true">
+<img style="width:100%; max-width:800px; max-height:600px; margin-left:auto; margin-right:auto; display:block;" src="https://alioss.timecho.com/docs/img/UserGuide/Ecosystem-Integration/Grafana-plugin/datasource_1.png?raw=true">
-<img style="width:100%; max-width:800px; max-height:600px; margin-left:auto; margin-right:auto; display:block;" src="/img/UserGuide/Ecosystem-Integration/Grafana-plugin/datasource_2.png?raw=true">
+<img style="width:100%; max-width:800px; max-height:600px; margin-left:auto; margin-right:auto; display:block;" src="https://alioss.timecho.com/docs/img/UserGuide/Ecosystem-Integration/Grafana-plugin/datasource_2.png?raw=true">
Select the `Apache IoTDB` data source.
@@ -184,22 +184,22 @@ Select the `Apache IoTDB` data source.
Click `Save & Test`, and `Success` will appear.
-<img style="width:100%; max-width:800px; max-height:600px; margin-left:auto; margin-right:auto; display:block;" src="/img/UserGuide/Ecosystem-Integration/Grafana-plugin/datasource_3.png?raw=true">
+<img style="width:100%; max-width:800px; max-height:600px; margin-left:auto; margin-right:auto; display:block;" src="https://alioss.timecho.com/docs/img/UserGuide/Ecosystem-Integration/Grafana-plugin/datasource_3.png?raw=true">
#### Create a new Panel
Click the `Dashboards` icon on the left, and select `Manage` option.
-<img style="width:100%; max-width:800px; max-height:600px; margin-left:auto; margin-right:auto; display:block;" src="/img/UserGuide/Ecosystem-Integration/Grafana-plugin/manage.png?raw=true">
+<img style="width:100%; max-width:800px; max-height:600px; margin-left:auto; margin-right:auto; display:block;" src="https://alioss.timecho.com/docs/img/UserGuide/Ecosystem-Integration/Grafana-plugin/manage.png?raw=true">
Click the `New Dashboard` icon on the top right, and select `Add an empty panel` option.
-<img style="width:100%; max-width:800px; max-height:600px; margin-left:auto; margin-right:auto; display:block;" src="/img/UserGuide/Ecosystem-Integration/Grafana-plugin/add-empty-panel.png?raw=true">
+<img style="width:100%; max-width:800px; max-height:600px; margin-left:auto; margin-right:auto; display:block;" src="https://alioss.timecho.com/docs/img/UserGuide/Ecosystem-Integration/Grafana-plugin/add-empty-panel.png?raw=true">
Grafana plugin supports SQL: Full Customized mode and SQL: Drop-down List mode, and the default mode is SQL: Full Customized mode.
-<img style="width:100%; max-width:800px; max-height:600px; margin-left:auto; margin-right:auto; display:block;" src="/img/UserGuide/Ecosystem-Integration/Grafana-plugin/grafana_input_style.png?raw=true">
+<img style="width:100%; max-width:800px; max-height:600px; margin-left:auto; margin-right:auto; display:block;" src="https://alioss.timecho.com/docs/img/UserGuide/Ecosystem-Integration/Grafana-plugin/grafana_input_style.png?raw=true">
##### SQL: Full Customized input method
@@ -207,7 +207,7 @@ Enter content in the SELECT, FROM , WHERE and CONTROL input box, where the WHERE
If a query involves multiple expressions, we can click `+` on the right side of the SELECT input box to add expressions in the SELECT clause, or click `+` on the right side of the FROM input box to add a path prefix:
-<img style="width:100%; max-width:800px; max-height:600px; margin-left:auto; margin-right:auto; display:block;" src="/img/UserGuide/Ecosystem-Integration/Grafana-plugin/grafana_input.png?raw=true">
+<img style="width:100%; max-width:800px; max-height:600px; margin-left:auto; margin-right:auto; display:block;" src="https://alioss.timecho.com/docs/img/UserGuide/Ecosystem-Integration/Grafana-plugin/grafana_input.png?raw=true">
SELECT input box: contents can be the time series suffix, function, udf, arithmetic expression, or nested expressions. You can also use the as clause to rename the result.
@@ -245,7 +245,7 @@ Tip: Statements like `select * from root.xx.**` are not recommended because thos
Select a time series in the TIME-SERIES selection box, select a function in the FUNCTION option, and enter the contents in the SAMPLING INTERVAL、SLIDING STEP、LEVEL、FILL input boxes, where TIME-SERIES is a required item and the rest are non required items.
-<img style="width:100%; max-width:800px; max-height:600px; margin-left:auto; margin-right:auto; display:block;" src="/img/UserGuide/Ecosystem-Integration/Grafana-plugin/grafana_input2.png?raw=true">
+<img style="width:100%; max-width:800px; max-height:600px; margin-left:auto; margin-right:auto; display:block;" src="https://alioss.timecho.com/docs/img/UserGuide/Ecosystem-Integration/Grafana-plugin/grafana_input2.png?raw=true">
#### Support for variables and template functions
@@ -253,34 +253,34 @@ Both SQL: Full Customized and SQL: Drop-down List input methods support the vari
After creating a new Panel, click the Settings button in the upper right corner:
-<img style="width:100%; max-width:800px; max-height:600px; margin-left:auto; margin-right:auto; display:block;" src="/img/UserGuide/Ecosystem-Integration/Grafana-plugin/setconf.png?raw=true">
+<img style="width:100%; max-width:800px; max-height:600px; margin-left:auto; margin-right:auto; display:block;" src="https://alioss.timecho.com/docs/img/UserGuide/Ecosystem-Integration/Grafana-plugin/setconf.png?raw=true">
Select `Variables`, click `Add variable`:
-<img style="width:100%; max-width:800px; max-height:600px; margin-left:auto; margin-right:auto; display:block;" src="/img/UserGuide/Ecosystem-Integration/Grafana-plugin/addvaribles.png?raw=true">
+<img style="width:100%; max-width:800px; max-height:600px; margin-left:auto; margin-right:auto; display:block;" src="https://alioss.timecho.com/docs/img/UserGuide/Ecosystem-Integration/Grafana-plugin/addvaribles.png?raw=true">
Example 1:Enter `Name`, `Label`, and `Query`, and then click the `Update` button:
-<img style="width:100%; max-width:800px; max-height:600px; margin-left:auto; margin-right:auto; display:block;" src="/img/UserGuide/Ecosystem-Integration/Grafana-plugin/variblesinput.png?raw=true">
+<img style="width:100%; max-width:800px; max-height:600px; margin-left:auto; margin-right:auto; display:block;" src="https://alioss.timecho.com/docs/img/UserGuide/Ecosystem-Integration/Grafana-plugin/variblesinput.png?raw=true">
Apply Variables, enter the variable in the `grafana panel` and click the `save` button:
-<img style="width:100%; max-width:800px; max-height:600px; margin-left:auto; margin-right:auto; display:block;" src="/img/UserGuide/Ecosystem-Integration/Grafana-plugin/applyvariables.png?raw=true">
+<img style="width:100%; max-width:800px; max-height:600px; margin-left:auto; margin-right:auto; display:block;" src="https://alioss.timecho.com/docs/img/UserGuide/Ecosystem-Integration/Grafana-plugin/applyvariables.png?raw=true">
Example 2: Nested use of variables:
-<img style="width:100%; max-width:800px; max-height:600px; margin-left:auto; margin-right:auto; display:block;" src="/img/UserGuide/Ecosystem-Integration/Grafana-plugin/variblesinput2.png?raw=true">
+<img style="width:100%; max-width:800px; max-height:600px; margin-left:auto; margin-right:auto; display:block;" src="https://alioss.timecho.com/docs/img/UserGuide/Ecosystem-Integration/Grafana-plugin/variblesinput2.png?raw=true">
-<img style="width:100%; max-width:800px; max-height:600px; margin-left:auto; margin-right:auto; display:block;" src="/img/UserGuide/Ecosystem-Integration/Grafana-plugin/variblesinput2-1.png?raw=true">
+<img style="width:100%; max-width:800px; max-height:600px; margin-left:auto; margin-right:auto; display:block;" src="https://alioss.timecho.com/docs/img/UserGuide/Ecosystem-Integration/Grafana-plugin/variblesinput2-1.png?raw=true">
-<img style="width:100%; max-width:800px; max-height:600px; margin-left:auto; margin-right:auto; display:block;" src="/img/UserGuide/Ecosystem-Integration/Grafana-plugin/variblesinput2-2.png?raw=true">
+<img style="width:100%; max-width:800px; max-height:600px; margin-left:auto; margin-right:auto; display:block;" src="https://alioss.timecho.com/docs/img/UserGuide/Ecosystem-Integration/Grafana-plugin/variblesinput2-2.png?raw=true">
Example 3: using function variables
-<img style="width:100%; max-width:800px; max-height:600px; margin-left:auto; margin-right:auto; display:block;" src="/img/UserGuide/Ecosystem-Integration/Grafana-plugin/variablesinput3.png?raw=true">
+<img style="width:100%; max-width:800px; max-height:600px; margin-left:auto; margin-right:auto; display:block;" src="https://alioss.timecho.com/docs/img/UserGuide/Ecosystem-Integration/Grafana-plugin/variablesinput3.png?raw=true">
-<img style="width:100%; max-width:800px; max-height:600px; margin-left:auto; margin-right:auto; display:block;" src="/img/UserGuide/Ecosystem-Integration/Grafana-plugin/variablesinput3-1.png?raw=true">
+<img style="width:100%; max-width:800px; max-height:600px; margin-left:auto; margin-right:auto; display:block;" src="https://alioss.timecho.com/docs/img/UserGuide/Ecosystem-Integration/Grafana-plugin/variablesinput3-1.png?raw=true">
The Name in the above figure is the variable name and the variable name we will use in the panel in the future. Label is the display name of the variable. If it is empty, the variable of Name will be displayed. Otherwise, the name of the Label will be displayed.
There are Query, Custom, Text box, Constant, DataSource, Interval, Ad hoc filters, etc. in the Type drop-down, all of which can be used in IoTDB's Grafana Plugin
@@ -304,30 +304,30 @@ This plugin supports Grafana alert function.
1. In the Grafana sidebar, hover over the `Alerting` icon and click `Notification channels`.
-<img style="width:100%; max-width:800px; max-height:600px; margin-left:auto; margin-right:auto; display:block;" src="/img/UserGuide/Ecosystem-Integration/Grafana-plugin/alerting1.png?raw=true">
+<img style="width:100%; max-width:800px; max-height:600px; margin-left:auto; margin-right:auto; display:block;" src="https://alioss.timecho.com/docs/img/UserGuide/Ecosystem-Integration/Grafana-plugin/alerting1.png?raw=true">
2. Click Add Channel.
-<img style="width:100%; max-width:800px; max-height:600px; margin-left:auto; margin-right:auto; display:block;" src="/img/UserGuide/Ecosystem-Integration/Grafana-plugin/alerting2.png?raw=true">
+<img style="width:100%; max-width:800px; max-height:600px; margin-left:auto; margin-right:auto; display:block;" src="https://alioss.timecho.com/docs/img/UserGuide/Ecosystem-Integration/Grafana-plugin/alerting2.png?raw=true">
3. Fill in the fields described below or select options. There are many types of Type, including DingDing, Email, Slack, WebHook, Prometheus Alertmanager, etc.
This sample Type uses `Prometheus Alertmanager`. Prometheus Alertmanager needs to be installed in advance. For more detailed configuration and parameter introduction, please refer to the official documentation: https://grafana.com/docs/grafana/v8.0/alerting/old- alerting/notifications/.
-<img style="width:100%; max-width:800px; max-height:600px; margin-left:auto; margin-right:auto; display:block;" src="/img/UserGuide/Ecosystem-Integration/Grafana-plugin/alerting3.png?raw=true">
+<img style="width:100%; max-width:800px; max-height:600px; margin-left:auto; margin-right:auto; display:block;" src="https://alioss.timecho.com/docs/img/UserGuide/Ecosystem-Integration/Grafana-plugin/alerting3.png?raw=true">
4. Click the `Test` button, the `Test notification sent` appears, click the `Save` button to save
-<img style="width:100%; max-width:800px; max-height:600px; margin-left:auto; margin-right:auto; display:block;" src="/img/UserGuide/Ecosystem-Integration/Grafana-plugin/alerting4.png?raw=true">
+<img style="width:100%; max-width:800px; max-height:600px; margin-left:auto; margin-right:auto; display:block;" src="https://alioss.timecho.com/docs/img/UserGuide/Ecosystem-Integration/Grafana-plugin/alerting4.png?raw=true">
5. After creating a new Panel, enter the query parameters and click Save, then select `Alert` and click `Create Alert`, as shown in the following figure:
-<img style="width:100%; max-width:800px; max-height:600px; margin-left:auto; margin-right:auto; display:block;" src="/img/UserGuide/Ecosystem-Integration/Grafana-plugin/alertpanle1.png?raw=true">
+<img style="width:100%; max-width:800px; max-height:600px; margin-left:auto; margin-right:auto; display:block;" src="https://alioss.timecho.com/docs/img/UserGuide/Ecosystem-Integration/Grafana-plugin/alertpanle1.png?raw=true">
6、Fill out the fields described below or select an option, `Name`- Enter a descriptive name. The name will be displayed in the Alert Rules list. This field supports templating.
`Evaluate every` - Specify how often the scheduler should evaluate the alert rule. This is referred to as the evaluation interval.
`For` - Specify how long the query needs to violate the configured thresholds before the alert notification triggers.。`Conditions`- Represents query criteria. Multiple combined query criteria can be configured.
-<img style="width:100%; max-width:800px; max-height:600px; margin-left:auto; margin-right:auto; display:block;" src="/img/UserGuide/Ecosystem-Integration/Grafana-plugin/alertpanle2.jpg?raw=true">
+<img style="width:100%; max-width:800px; max-height:600px; margin-left:auto; margin-right:auto; display:block;" src="https://alioss.timecho.com/docs/img/UserGuide/Ecosystem-Integration/Grafana-plugin/alertpanle2.jpg?raw=true">
Query conditions in the figure:avg() OF query(A,5m,now) IS ABOVE -1
@@ -344,19 +344,19 @@ More details can be found in the official documents:https://grafana.com/docs/gra
7、Click the `Test rule` button and the `firing: true` appears, the configuration is successful, click the `save` button
-<img style="width:100%; max-width:800px; max-height:600px; margin-left:auto; margin-right:auto; display:block;" src="/img/UserGuide/Ecosystem-Integration/Grafana-plugin/alertpanel3.png?raw=true">
+<img style="width:100%; max-width:800px; max-height:600px; margin-left:auto; margin-right:auto; display:block;" src="https://alioss.timecho.com/docs/img/UserGuide/Ecosystem-Integration/Grafana-plugin/alertpanel3.png?raw=true">
8、The following figure shows the alarm displayed in the grafana panel
-<img style="width:100%; max-width:800px; max-height:600px; margin-left:auto; margin-right:auto; display:block;" src="/img/UserGuide/Ecosystem-Integration/Grafana-plugin/alertpanel4.png?raw=true">
+<img style="width:100%; max-width:800px; max-height:600px; margin-left:auto; margin-right:auto; display:block;" src="https://alioss.timecho.com/docs/img/UserGuide/Ecosystem-Integration/Grafana-plugin/alertpanel4.png?raw=true">
9、View alert rules
-<img style="width:100%; max-width:800px; max-height:600px; margin-left:auto; margin-right:auto; display:block;" src="/img/UserGuide/Ecosystem-Integration/Grafana-plugin/alertPanel5.png?raw=true">
+<img style="width:100%; max-width:800px; max-height:600px; margin-left:auto; margin-right:auto; display:block;" src="https://alioss.timecho.com/docs/img/UserGuide/Ecosystem-Integration/Grafana-plugin/alertPanel5.png?raw=true">
10、View alert records in promehthus alertmanager
-<img style="width:100%; max-width:800px; max-height:600px; margin-left:auto; margin-right:auto; display:block;" src="/img/UserGuide/Ecosystem-Integration/Grafana-plugin/alertpanel6.png?raw=true">
+<img style="width:100%; max-width:800px; max-height:600px; margin-left:auto; margin-right:auto; display:block;" src="https://alioss.timecho.com/docs/img/UserGuide/Ecosystem-Integration/Grafana-plugin/alertpanel6.png?raw=true">
### More Details about Grafana
diff --git a/docs/UserGuide/Ecosystem-Integration/Spark-IoTDB.md b/docs/UserGuide/Ecosystem-Integration/Spark-IoTDB.md
index f7c987e178..3872721fc0 100644
--- a/docs/UserGuide/Ecosystem-Integration/Spark-IoTDB.md
+++ b/docs/UserGuide/Ecosystem-Integration/Spark-IoTDB.md
@@ -93,7 +93,7 @@ Take the following TsFile structure as an example: There are three Measurements
The existing data in the TsFile is as follows:
-<img width="517" alt="SI " src="/img/github/98197835-99a64980-1f62-11eb-84af-8301b8a6aad5.png">
+<img width="517" alt="SI " src="https://alioss.timecho.com/docs/img/github/98197835-99a64980-1f62-11eb-84af-8301b8a6aad5.png">
The wide(default) table form is as follows:
diff --git a/docs/UserGuide/Ecosystem-Integration/Spark-TsFile.md b/docs/UserGuide/Ecosystem-Integration/Spark-TsFile.md
index 2d0becf7f9..3278f31df9 100644
--- a/docs/UserGuide/Ecosystem-Integration/Spark-TsFile.md
+++ b/docs/UserGuide/Ecosystem-Integration/Spark-TsFile.md
@@ -94,7 +94,7 @@ The way to display TsFile is dependent on the schema. Take the following TsFile
The existing data in the TsFile are:
-<img width="519" alt="ST 1" src="/img/github/98197920-be9abc80-1f62-11eb-9efb-027f0590031c.png">
+<img width="519" alt="ST 1" src="https://alioss.timecho.com/docs/img/github/98197920-be9abc80-1f62-11eb-9efb-027f0590031c.png">
The corresponding SparkSQL table is:
@@ -239,7 +239,7 @@ The way to display TsFile is related to TsFile Schema. Take the following TsFile
The existing data in the file are:
-<img width="817" alt="ST 2" src="/img/github/98197948-cf4b3280-1f62-11eb-9c8c-c97d1adf032c.png">
+<img width="817" alt="ST 2" src="https://alioss.timecho.com/docs/img/github/98197948-cf4b3280-1f62-11eb-9c8c-c97d1adf032c.png">
A set of time-series data
diff --git a/docs/UserGuide/Ecosystem-Integration/Writing-Data-on-HDFS.md b/docs/UserGuide/Ecosystem-Integration/Writing-Data-on-HDFS.md
index 646aae78f1..5113ec29b3 100644
--- a/docs/UserGuide/Ecosystem-Integration/Writing-Data-on-HDFS.md
+++ b/docs/UserGuide/Ecosystem-Integration/Writing-Data-on-HDFS.md
@@ -29,7 +29,7 @@ Currently, TsFiles(including both TsFile and related data files) are supported t
When you config to store TSFile on HDFS, your data files will be in distributed storage. The system architecture is as below:
-<img style="width:100%; max-width:700px; max-height:600px; margin-left:auto; margin-right:auto; display:block;" src="/img/github/66922722-35180400-f05a-11e9-8ff0-7dd51716e4a8.png">
+<img style="width:100%; max-width:700px; max-height:600px; margin-left:auto; margin-right:auto; display:block;" src="https://alioss.timecho.com/docs/img/github/66922722-35180400-f05a-11e9-8ff0-7dd51716e4a8.png">
#### Config and usage
diff --git a/docs/UserGuide/Ecosystem-Integration/Zeppelin-IoTDB.md b/docs/UserGuide/Ecosystem-Integration/Zeppelin-IoTDB.md
index c5f509f3e7..455ee59715 100644
--- a/docs/UserGuide/Ecosystem-Integration/Zeppelin-IoTDB.md
+++ b/docs/UserGuide/Ecosystem-Integration/Zeppelin-IoTDB.md
@@ -25,7 +25,7 @@
Zeppelin is a web-based notebook that enables interactive data analytics. You can connect to data sources and perform interactive operations with SQL, Scala, etc. The operations can be saved as documents, just like Jupyter. Zeppelin has already supported many data sources, including Spark, ElasticSearch, Cassandra, and InfluxDB. Now, we have enabled Zeppelin to operate IoTDB via SQL.
-
+
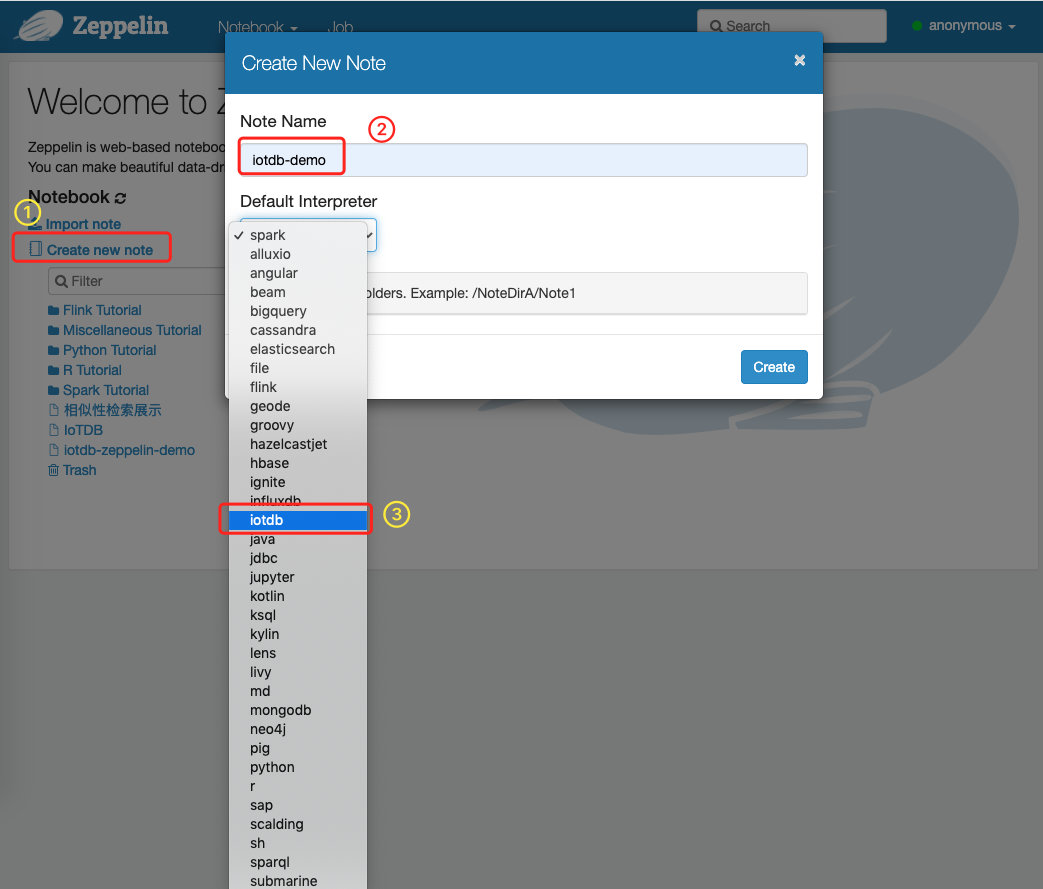
@@ -113,7 +113,7 @@ In the interpreter page:
Now you are ready to use your interpreter.
-
+
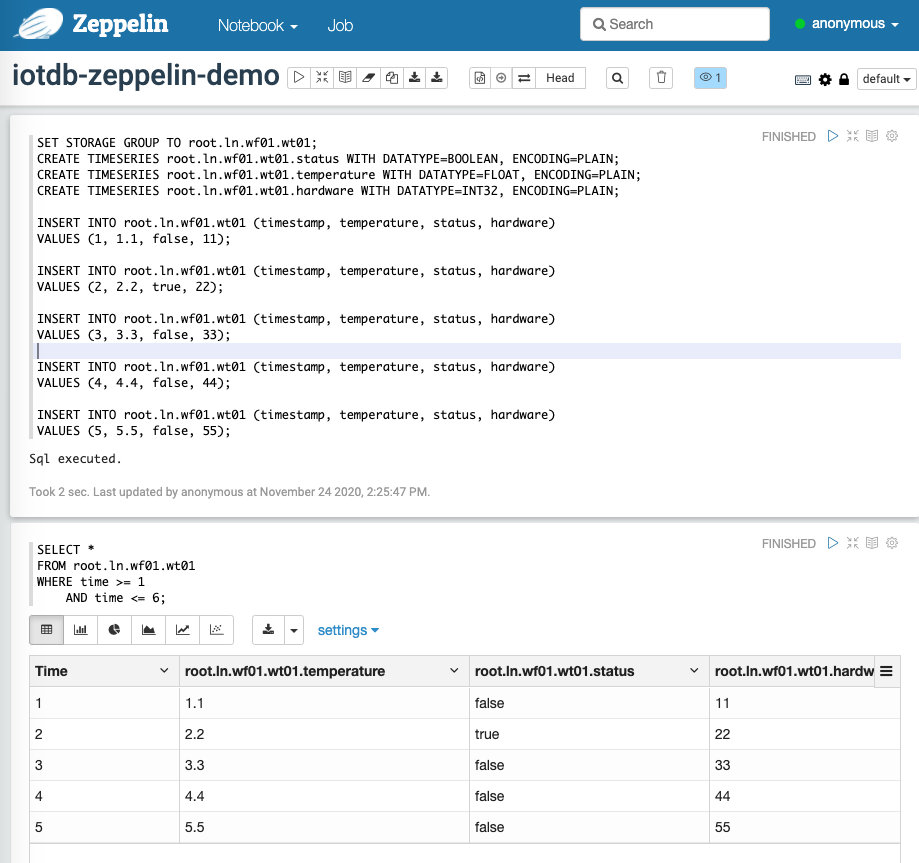
We provide some simple SQL to show the use of Zeppelin-IoTDB interpreter:
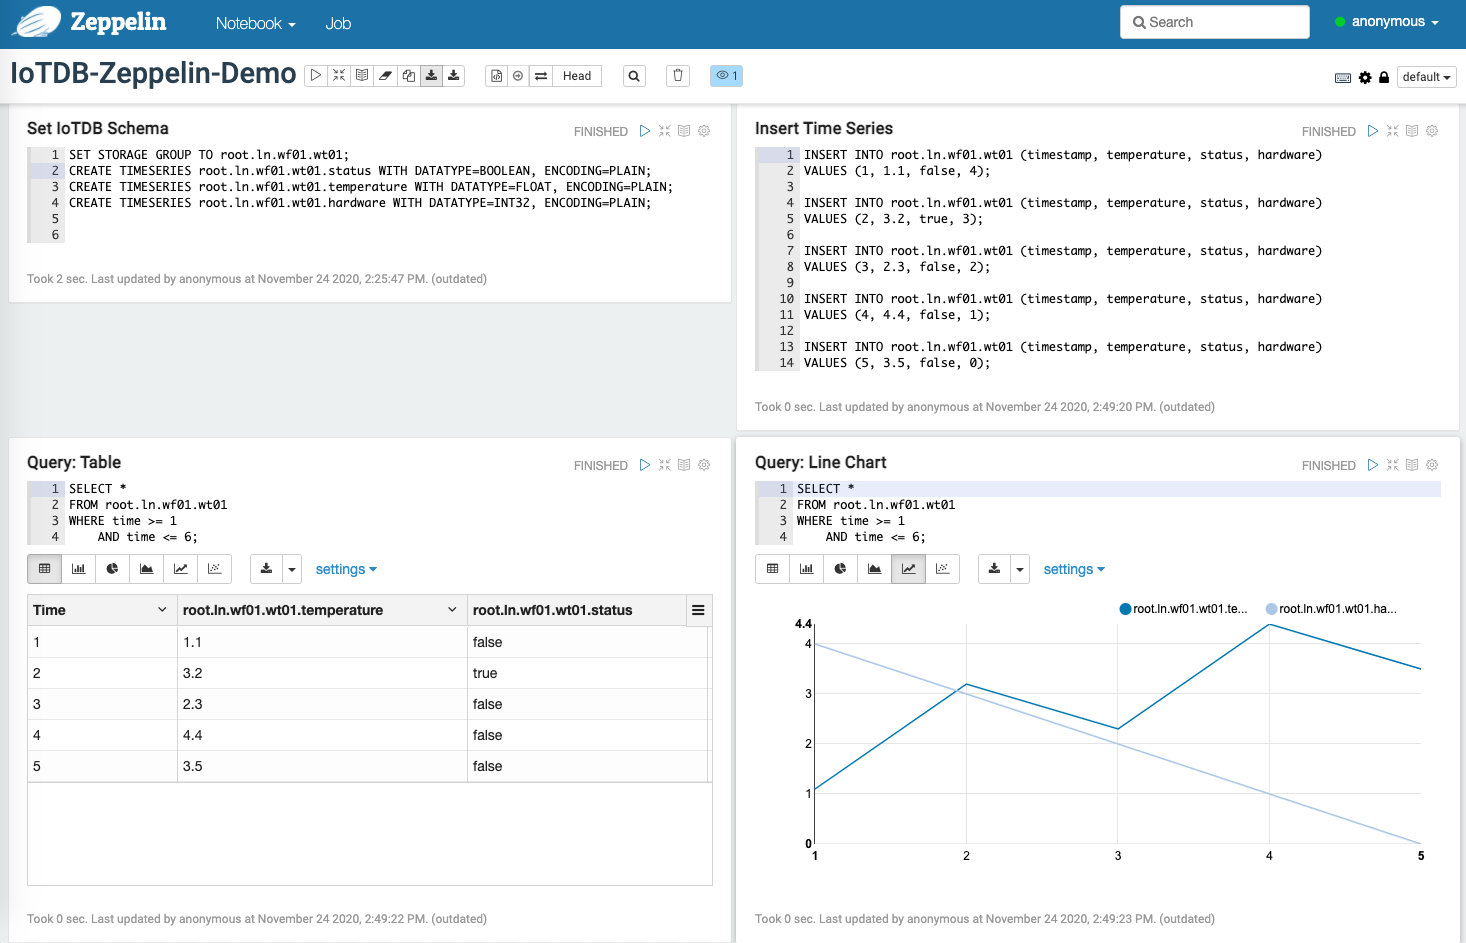
@@ -147,7 +147,7 @@ We provide some simple SQL to show the use of Zeppelin-IoTDB interpreter:
The screenshot is as follows:
-
+
You can also design more fantasy documents referring to [[1]](https://zeppelin.apache.org/docs/0.9.0/usage/display_system/basic.html) and others.
@@ -159,7 +159,7 @@ The above demo notebook can be found at `$IoTDB_HOME/zeppelin-interpreter/Zeppe
You can configure the connection parameters in http://127.0.0.1:8080/#/interpreter :
-
+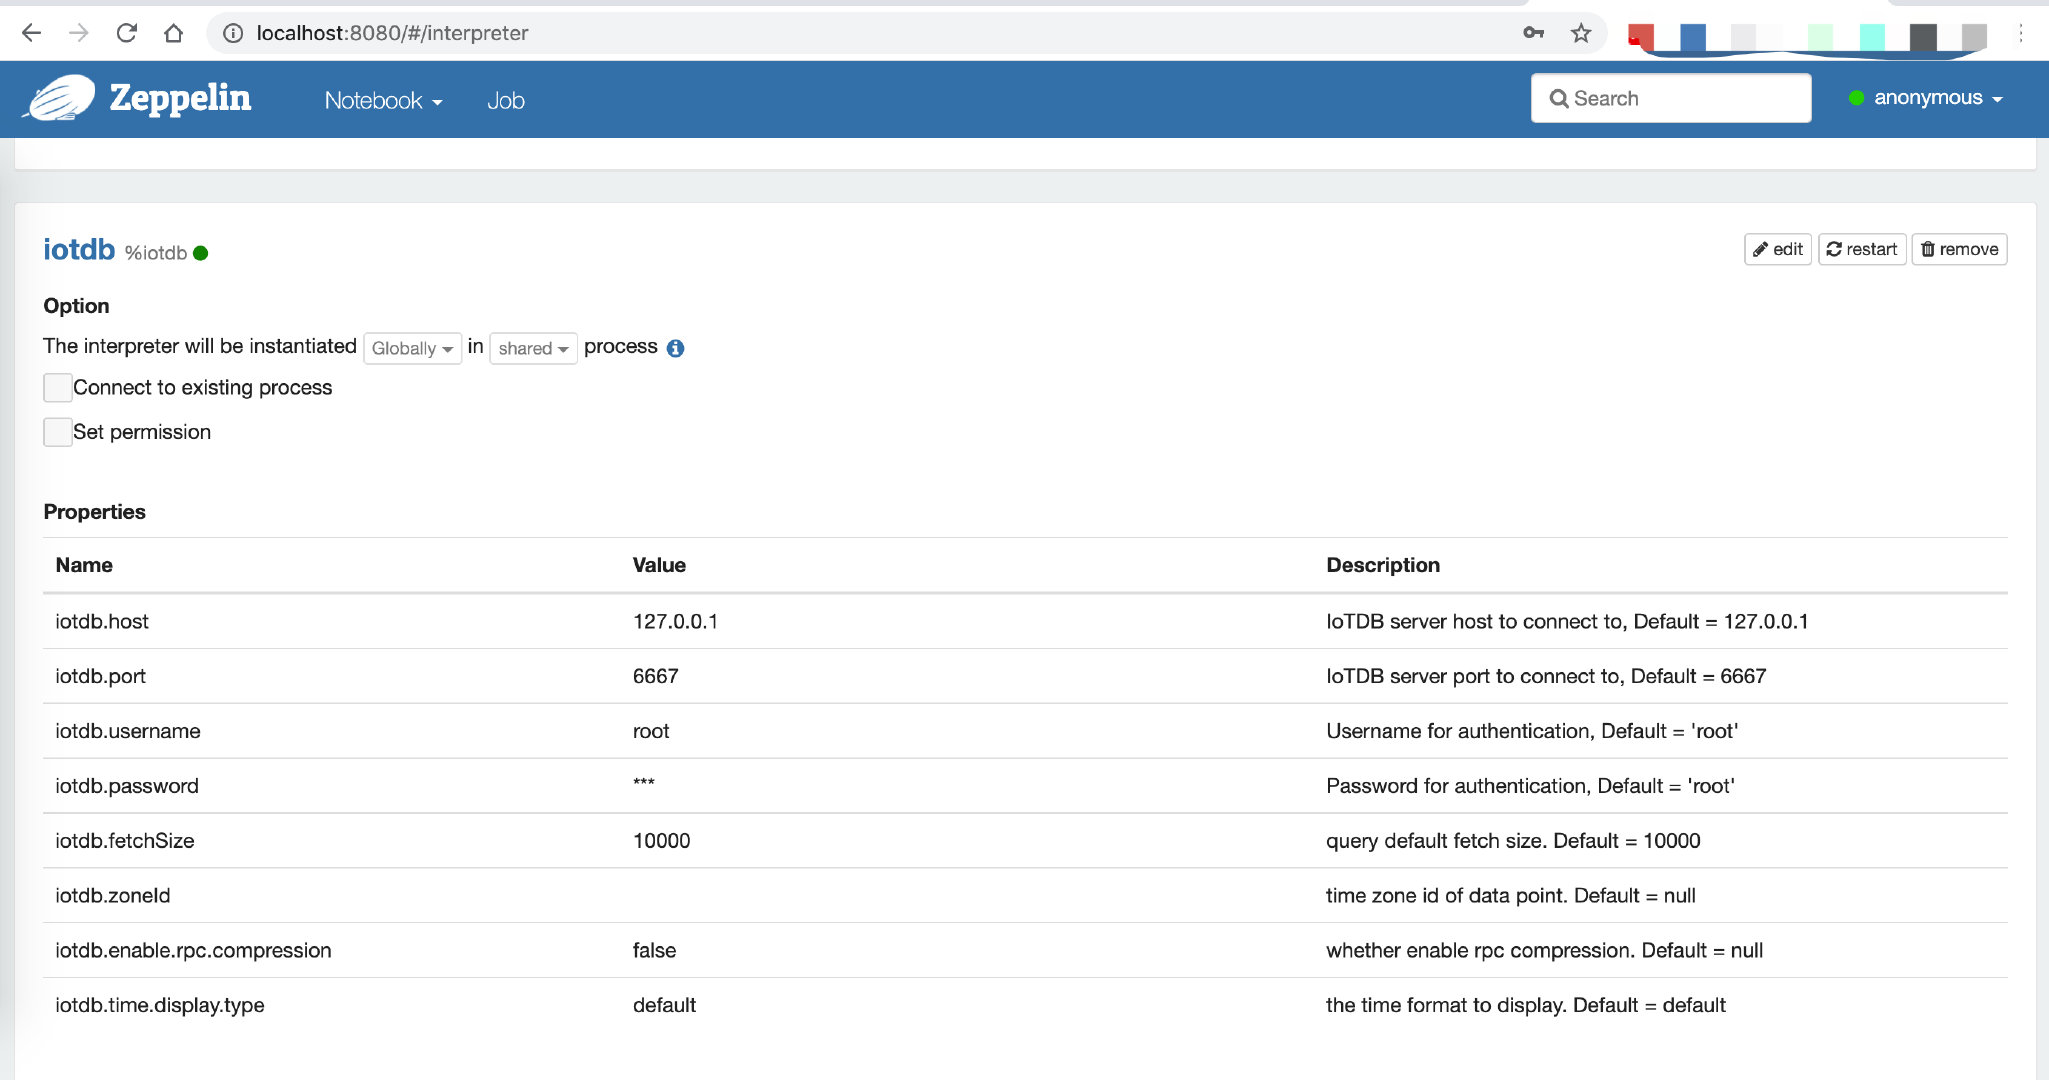
The parameters you can configure are as follows:
diff --git a/docs/UserGuide/Edge-Cloud-Collaboration/Sync-Tool.md b/docs/UserGuide/Edge-Cloud-Collaboration/Sync-Tool.md
index 4aa356db73..8d087cc4ab 100644
--- a/docs/UserGuide/Edge-Cloud-Collaboration/Sync-Tool.md
+++ b/docs/UserGuide/Edge-Cloud-Collaboration/Sync-Tool.md
@@ -31,7 +31,7 @@ You can use SQL commands to start or close a synchronization task at the sender,
## 2.Model definition
-
+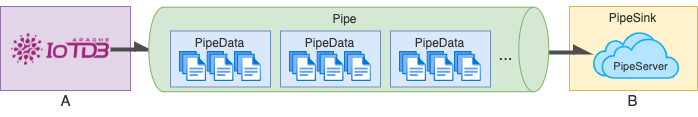
Two machines A and B, which are installed with iotdb, we want to continuously synchronize the data from A to B. To better describe this process, we introduce the following concepts.
diff --git a/docs/UserGuide/IoTDB-Introduction/Architecture.md b/docs/UserGuide/IoTDB-Introduction/Architecture.md
index bff327c3b2..d134e181c3 100644
--- a/docs/UserGuide/IoTDB-Introduction/Architecture.md
+++ b/docs/UserGuide/IoTDB-Introduction/Architecture.md
@@ -25,7 +25,7 @@ Besides IoTDB engine, we also developed several components to provide better IoT
IoTDB suite can provide a series of functions in the real situation such as data collection, data writing, data storage, data query, data visualization and data analysis. Figure 1.1 shows the overall application architecture brought by all the components of the IoTDB suite.
-<img style="width:100%; max-width:800px; max-height:600px; margin-left:auto; margin-right:auto; display:block;" src="/img/UserGuide/IoTDB-Introduction/Architecture/Structure-of-Apache-IoTDB.png?raw=true">
+<img style="width:100%; max-width:800px; max-height:600px; margin-left:auto; margin-right:auto; display:block;" src="https://alioss.timecho.com/docs/img/UserGuide/IoTDB-Introduction/Architecture/Structure-of-Apache-IoTDB.png?raw=true">
As shown in Figure 1.1, users can use JDBC to import timeseries data collected by sensor on the device to local/remote IoTDB. These timeseries data may be system state data (such as server load and CPU memory, etc.), message queue data, timeseries data from applications, or other timeseries data in the database. Users can also write the data directly to the TsFile (local or on HDFS).
diff --git a/docs/UserGuide/IoTDB-Introduction/Scenario.md b/docs/UserGuide/IoTDB-Introduction/Scenario.md
index c3e0e72ec0..bd44de2356 100644
--- a/docs/UserGuide/IoTDB-Introduction/Scenario.md
+++ b/docs/UserGuide/IoTDB-Introduction/Scenario.md
@@ -31,11 +31,11 @@ In order to improve the quality of the printing, it is necessary for the company
At this point, the data can be stored using TsFile component, TsFileSync tool, and Hadoop/Spark integration component in the IoTDB suite.That is, each time a new chip is printed, a data is written on the SPI device using the SDK, which ultimately forms a TsFile. Through the TsFileSync tool, the generated TsFile will be synchronized to the data center according to certain rules (such as daily) and analyzed by data analysts tools.
-<img style="width:100%; max-width:800px; max-height:600px; margin-left:auto; margin-right:auto; display:block;" src="/img/github/51579014-695ef980-1efa-11e9-8cbc-e9e7ee4fa0d8.png">
+<img style="width:100%; max-width:800px; max-height:600px; margin-left:auto; margin-right:auto; display:block;" src="https://alioss.timecho.com/docs/img/github/51579014-695ef980-1efa-11e9-8cbc-e9e7ee4fa0d8.png">
In this scenario, only TsFile and TsFileSync are required to be deployed on a PC, and a Hadoop/Spark cluster is required. Figure below shows the architecture at this time.
-<img style="width:100%; max-width:800px; max-height:600px; margin-left:auto; margin-right:auto; display:block;" src="/img/github/81768490-bf034f00-950d-11ea-9b56-fef3edca0958.png">
+<img style="width:100%; max-width:800px; max-height:600px; margin-left:auto; margin-right:auto; display:block;" src="https://alioss.timecho.com/docs/img/github/81768490-bf034f00-950d-11ea-9b56-fef3edca0958.png">
* Scenario 2
@@ -43,11 +43,11 @@ A company has several wind turbines which are installed hundreds of sensors on e
In order to ensure the normal operation of the turbines and timely monitoring and analysis of the turbines, the company needs to collect these sensor data, perform partial calculation and analysis in the turbines working environment, and upload the original data collected to the data center.
-<img style="width:100%; max-width:800px; max-height:600px; margin-left:auto; margin-right:auto; display:block;" src="/img/github/51579033-7ed42380-1efa-11e9-889f-fb4180291a9e.png">
+<img style="width:100%; max-width:800px; max-height:600px; margin-left:auto; margin-right:auto; display:block;" src="https://alioss.timecho.com/docs/img/github/51579033-7ed42380-1efa-11e9-889f-fb4180291a9e.png">
In this situation, IoTDB, TsFileSync tools, and Hadoop/Spark integration components in the IoTDB suite can be used. A PC needs to be deployed with IoTDB and TsFileSync tools installed to support reading and writing data, local computing and analysis, and uploading data to the data center. In addition, Hadoop/Spark clusters need to be deployed for data storage and analysis on the data center side. Figure below shows the architecture at this time.
-<img style="width:100%; max-width:800px; max-height:600px; margin-left:auto; margin-right:auto; display:block;" src="/img/github/51579064-8f849980-1efa-11e9-8cd6-a7339cd0540f.jpg">
+<img style="width:100%; max-width:800px; max-height:600px; margin-left:auto; margin-right:auto; display:block;" src="https://alioss.timecho.com/docs/img/github/51579064-8f849980-1efa-11e9-8cd6-a7339cd0540f.jpg">
* Scenario 3
@@ -57,11 +57,11 @@ A variety of sensors are installed on each robotic device to monitor the robot's
In order to ensure that the data of the robot can be monitored and analyzed in time, the company needs to collect the information of these robot sensors, send them to the server that can connect to the external network, and then upload the original data information to the data center for complex calculation and analysis.
-<img style="width:100%; max-width:800px; max-height:600px; margin-left:auto; margin-right:auto; display:block;" src="/img/github/51579080-96aba780-1efa-11e9-87ac-940c45b19dd7.jpg">
+<img style="width:100%; max-width:800px; max-height:600px; margin-left:auto; margin-right:auto; display:block;" src="https://alioss.timecho.com/docs/img/github/51579080-96aba780-1efa-11e9-87ac-940c45b19dd7.jpg">
At this point, IoTDB, IoTDB-Client tools, TsFileSync tools, and Hadoop/Spark integration components in the IoTDB suite can be used. IoTDB-Client tool is installed on the robot and each of them is connected to the LAN of the factory. When sensors generate real-time data, the data will be uploaded to the server in the factory. The IoTDB server and TsFileSync is installed on the server connected to the external network. Once triggered, the data on the server will be upload to the data cente [...]
-<img style="width:100%; max-width:800px; max-height:600px; margin-left:auto; margin-right:auto; display:block;" src="/img/github/81768477-b874d780-950d-11ea-80ca-8807b9bd0970.png">
+<img style="width:100%; max-width:800px; max-height:600px; margin-left:auto; margin-right:auto; display:block;" src="https://alioss.timecho.com/docs/img/github/81768477-b874d780-950d-11ea-80ca-8807b9bd0970.png">
* Scenario 4
@@ -73,4 +73,4 @@ At this point, IoTDB, IoTDB-Client, and Hadoop/Spark integration components in t
In addition, Hadoop/Spark clusters need to be deployed for data storage and analysis on the data center side. As shown in Figure below.
-<img style="width:100%; max-width:800px; max-height:600px; margin-left:auto; margin-right:auto; display:block;" src="/img/github/51579095-a4f9c380-1efa-11e9-9f95-17165ec55568.jpg">
+<img style="width:100%; max-width:800px; max-height:600px; margin-left:auto; margin-right:auto; display:block;" src="https://alioss.timecho.com/docs/img/github/51579095-a4f9c380-1efa-11e9-9f95-17165ec55568.jpg">
diff --git a/docs/UserGuide/Maintenance-Tools/JMX-Tool.md b/docs/UserGuide/Maintenance-Tools/JMX-Tool.md
index 3ac1eb645b..a0bd8c08c4 100644
--- a/docs/UserGuide/Maintenance-Tools/JMX-Tool.md
+++ b/docs/UserGuide/Maintenance-Tools/JMX-Tool.md
@@ -48,12 +48,12 @@ Step 4: Use jvisualvm
1. Make sure jdk 8 is installed. For versions later than jdk 8, you need to [download visualvm](https://visualvm.github.io/download.html)
2. Open jvisualvm
3. Right-click at the left navigation area -> Add JMX connection
-<img style="width:100%; max-width:300px; max-height:600px; margin-left:auto; margin-right:auto; display:block;" src="/img/github/81464569-725e0200-91f5-11ea-9ff9-49745f4c9ef2.png">
+<img style="width:100%; max-width:300px; max-height:600px; margin-left:auto; margin-right:auto; display:block;" src="https://alioss.timecho.com/docs/img/github/81464569-725e0200-91f5-11ea-9ff9-49745f4c9ef2.png">
4. Fill in information and log in as below. Remember to check "Do not require SSL connection".
An example is:
Connection:192.168.130.15:31999
Username:iotdb
Password:passw!d
-<img style="width:100%; max-width:300px; max-height:600px; margin-left:auto; margin-right:auto; display:block;" src="/img/github/81464639-ed271d00-91f5-11ea-91a0-b4fe9cb8204e.png">
+<img style="width:100%; max-width:300px; max-height:600px; margin-left:auto; margin-right:auto; display:block;" src="https://alioss.timecho.com/docs/img/github/81464639-ed271d00-91f5-11ea-91a0-b4fe9cb8204e.png">
diff --git a/docs/UserGuide/Maintenance-Tools/Log-Tool.md b/docs/UserGuide/Maintenance-Tools/Log-Tool.md
index 0ce3c0512e..3b6f8592a5 100644
--- a/docs/UserGuide/Maintenance-Tools/Log-Tool.md
+++ b/docs/UserGuide/Maintenance-Tools/Log-Tool.md
@@ -35,14 +35,14 @@ Here we use JConsole to connect with JMX.
Start the JConsole, establish a new JMX connection with the IoTDB Server (you can select the local process or input the IP and PORT for remote connection, the default operation port of the IoTDB JMX service is 31999). Fig 4.1 shows the connection GUI of JConsole.
-<img style="width:100%; max-width:800px; max-height:600px; margin-left:auto; margin-right:auto; display:block;" src="/img/github/51577195-f94d7500-1ef3-11e9-999a-b4f67055d80e.png">
+<img style="width:100%; max-width:800px; max-height:600px; margin-left:auto; margin-right:auto; display:block;" src="https://alioss.timecho.com/docs/img/github/51577195-f94d7500-1ef3-11e9-999a-b4f67055d80e.png">
After connected, click `MBean` and find `ch.qos.logback.classic.default.ch.qos.logback.classic.jmx.JMXConfigurator`(As shown in fig 4.2).
-<img style="width:100%; max-width:800px; max-height:600px; margin-left:auto; margin-right:auto; display:block;" src="/img/github/51577204-fe122900-1ef3-11e9-9e89-2eb1d46e24b8.png">
+<img style="width:100%; max-width:800px; max-height:600px; margin-left:auto; margin-right:auto; display:block;" src="https://alioss.timecho.com/docs/img/github/51577204-fe122900-1ef3-11e9-9e89-2eb1d46e24b8.png">
In the JMXConfigurator Window, there are 6 operations provided, as shown in fig 4.3. You can use these interfaces to perform operation.
-<img style="width:100%; max-width:800px; max-height:600px; margin-left:auto; margin-right:auto; display:block;" src="/img/github/51577216-09fdeb00-1ef4-11e9-9005-542ad7d9e9e0.png">
+<img style="width:100%; max-width:800px; max-height:600px; margin-left:auto; margin-right:auto; display:block;" src="https://alioss.timecho.com/docs/img/github/51577216-09fdeb00-1ef4-11e9-9005-542ad7d9e9e0.png">
#### Interface Instruction
diff --git a/docs/UserGuide/Monitor-Alert/Alerting.md b/docs/UserGuide/Monitor-Alert/Alerting.md
index 6b3781d8f0..5879917d7a 100644
--- a/docs/UserGuide/Monitor-Alert/Alerting.md
+++ b/docs/UserGuide/Monitor-Alert/Alerting.md
@@ -396,6 +396,6 @@ makes alerts of `critical` severity inhibit those of `warning` severity,
the alerting email we receive only contains the alert triggered
by the writing of `(5, 120)`.
-<img width="669" alt="alerting" src="/img/github/115957896-a9791080-a537-11eb-9962-541412bdcee6.png">
+<img width="669" alt="alerting" src="https://alioss.timecho.com/docs/img/github/115957896-a9791080-a537-11eb-9962-541412bdcee6.png">
diff --git a/docs/UserGuide/Monitor-Alert/Metric-Tool.md b/docs/UserGuide/Monitor-Alert/Metric-Tool.md
index 06119a1050..f670e83911 100644
--- a/docs/UserGuide/Monitor-Alert/Metric-Tool.md
+++ b/docs/UserGuide/Monitor-Alert/Metric-Tool.md
@@ -512,19 +512,19 @@ thread information, class information, and the server's CPU usage.
After connecting to JMX, you can find the "MBean" named "org.apache.iotdb.metrics" through the "MBeans" tab, and you can
view the specific values of all monitoring metrics in the sidebar.
-<img style="width:100%; max-width:800px; max-height:600px; margin-left:auto; margin-right:auto; display:block;" alt="metric-jmx" src="/img/github/204018765-6fda9391-ebcf-4c80-98c5-26f34bd74df0.png">
+<img style="width:100%; max-width:800px; max-height:600px; margin-left:auto; margin-right:auto; display:block;" alt="metric-jmx" src="https://alioss.timecho.com/docs/img/github/204018765-6fda9391-ebcf-4c80-98c5-26f34bd74df0.png">
#### 5.1.2. Get other relevant data
After connecting to JMX, you can find the "MBean" named "org.apache.iotdb.service" through the "MBeans" tab, as shown in
the image below, to understand the basic status of the service
-<img style="width:100%; max-width:800px; max-height:600px; margin-left:auto; margin-right:auto; display:block;" src="/img/github/149951720-707f1ee8-32ee-4fde-9252-048caebd232e.png"> <br>
+<img style="width:100%; max-width:800px; max-height:600px; margin-left:auto; margin-right:auto; display:block;" src="https://alioss.timecho.com/docs/img/github/149951720-707f1ee8-32ee-4fde-9252-048caebd232e.png"> <br>
In order to improve query performance, IOTDB caches ChunkMetaData and TsFileMetaData. Users can use MXBean and expand
the sidebar `org.apache.iotdb.db.service` to view the cache hit ratio:
-<img style="width:100%; max-width:800px; max-height:600px; margin-left:auto; margin-right:auto; display:block;" src="/img/github/112426760-73e3da80-8d73-11eb-9a8f-9232d1f2033b.png">
+<img style="width:100%; max-width:800px; max-height:600px; margin-left:auto; margin-right:auto; display:block;" src="https://alioss.timecho.com/docs/img/github/112426760-73e3da80-8d73-11eb-9a8f-9232d1f2033b.png">
### 5.2. Prometheus
@@ -574,7 +574,7 @@ can be used to collect and store monitoring indicators, and Grafana can be used
The following picture describes the relationships among IoTDB, Prometheus and Grafana
-
+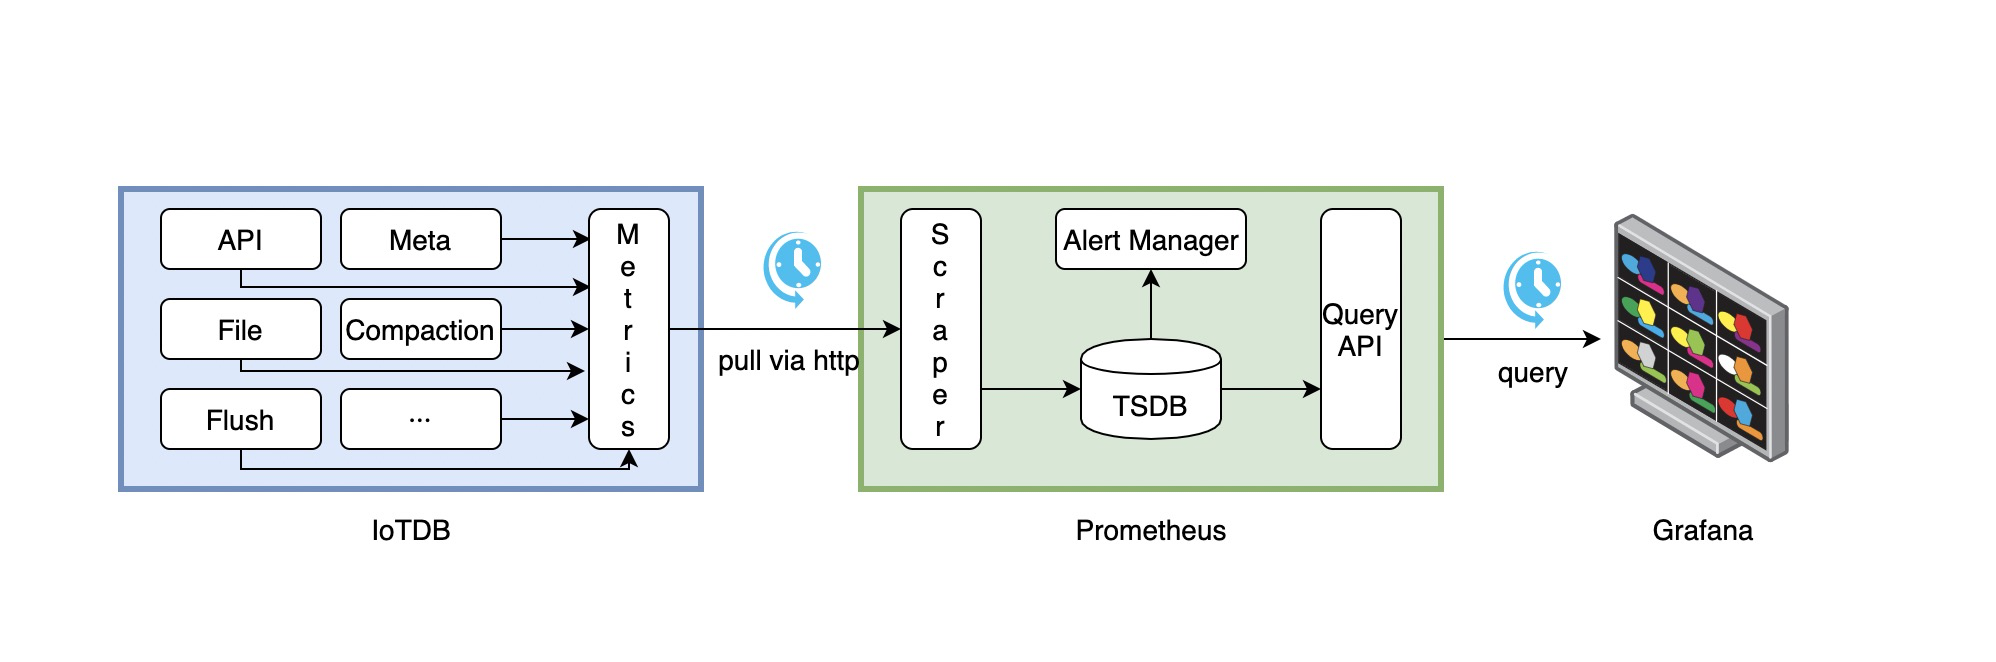
1. Along with running, IoTDB will collect its metrics continuously.
2. Prometheus scrapes metrics from IoTDB at a constant interval (can be configured).
@@ -614,7 +614,7 @@ The following documents may help you have a good journey with Prometheus and Gra
We provide the Apache IoTDB Dashboard, and the rendering shown in Grafana is as follows:
-
+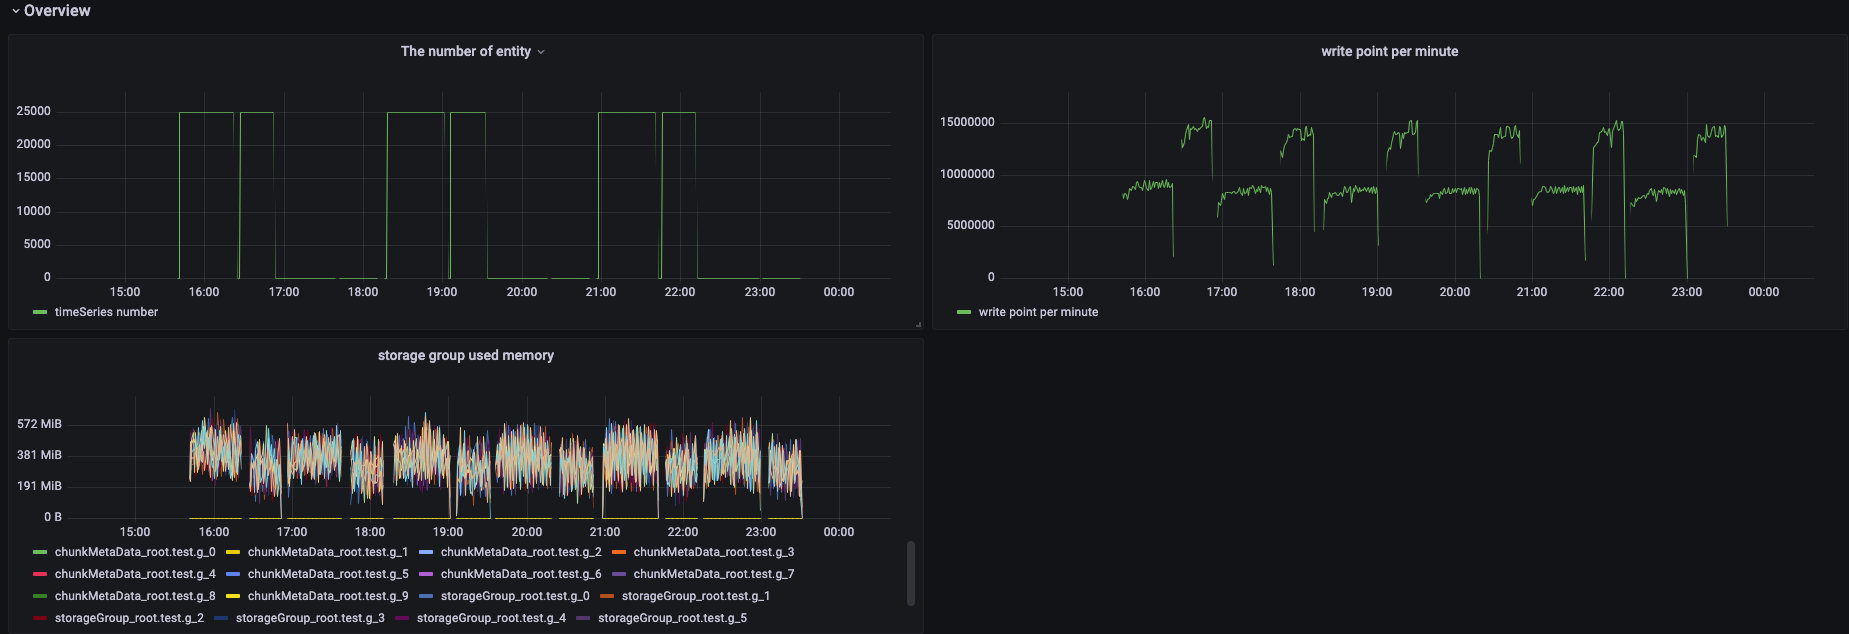
You can obtain the json files of Dashboards in enterprise version.
diff --git a/docs/UserGuide/Operate-Metadata/Auto-Create-MetaData.md b/docs/UserGuide/Operate-Metadata/Auto-Create-MetaData.md
index f8a2439427..24490417e5 100644
--- a/docs/UserGuide/Operate-Metadata/Auto-Create-MetaData.md
+++ b/docs/UserGuide/Operate-Metadata/Auto-Create-MetaData.md
@@ -51,7 +51,7 @@ Illustrated as the following figure:
* When default_storage_group_level=2, root.turbine1.d1, root.turbine1.d2, root.turbine2.d1 and root.turbine2.d2 will be created as database.
-<img style="width:100%; max-width:800px; max-height:600px; margin-left:auto; margin-right:auto; display:block;" src="/img/UserGuide/Data-Concept/Auto-Create-MetaData/auto_create_sg_example.png?raw=true" alt="auto create database example">
+<img style="width:100%; max-width:800px; max-height:600px; margin-left:auto; margin-right:auto; display:block;" src="https://alioss.timecho.com/docs/img/UserGuide/Data-Concept/Auto-Create-MetaData/auto_create_sg_example.png?raw=true" alt="auto create database example">
## Auto create time series metadata(specify data type in the frontend)
diff --git a/docs/UserGuide/Operate-Metadata/Timeseries.md b/docs/UserGuide/Operate-Metadata/Timeseries.md
index 12c482e2ca..444bcc2b10 100644
--- a/docs/UserGuide/Operate-Metadata/Timeseries.md
+++ b/docs/UserGuide/Operate-Metadata/Timeseries.md
@@ -181,7 +181,7 @@ It costs 0.004s
Then the Metadata Tree will be as below:
-<center><img style="width:100%; max-width:600px; margin-left:auto; margin-right:auto; display:block;" src="/img/github/69792176-1718f400-1201-11ea-861a-1a83c07ca144.jpg"></center>
+<center><img style="width:100%; max-width:600px; margin-left:auto; margin-right:auto; display:block;" src="https://alioss.timecho.com/docs/img/github/69792176-1718f400-1201-11ea-861a-1a83c07ca144.jpg"></center>
As can be seen, `root` is considered as `LEVEL=0`. So when you enter statements such as:
```
diff --git a/docs/UserGuide/Operators-Functions/Sample.md b/docs/UserGuide/Operators-Functions/Sample.md
index 95f8301f34..39640783c9 100644
--- a/docs/UserGuide/Operators-Functions/Sample.md
+++ b/docs/UserGuide/Operators-Functions/Sample.md
@@ -248,7 +248,7 @@ M4 is used to sample the `first, last, bottom, top` points for each sliding wind
- the bottom point is the point with the **m**inimal value (if there are multiple such points, M4 returns one of them);
- the top point is the point with the **m**aximal value (if there are multiple such points, M4 returns one of them).
-<img src="/img/github/198178733-a0919d17-0663-4672-9c4f-1efad6f463c2.png" alt="image" style="zoom:50%;" />
+<img src="https://alioss.timecho.com/docs/img/github/198178733-a0919d17-0663-4672-9c4f-1efad6f463c2.png" alt="image" style="zoom:50%;" />
| Function Name | Allowed Input Series Data Types | Attributes | Output Series Data Type | Series Data Type Description |
| ------------- | ------------------------------- | ------------------------------------------------------------ | ------------------------------ | ------------------------------------------------------------ |
@@ -261,7 +261,7 @@ M4 is used to sample the `first, last, bottom, top` points for each sliding wind
+ `windowSize`: The number of points in a window. Int data type. **Required**.
+ `slidingStep`: Slide a window by the number of points. Int data type. Optional. If not set, default to the same as `windowSize`.
-<img src="/img/github/198181449-00d563c8-7bce-4ecd-a031-ec120ca42c3f.png" alt="image" style="zoom: 50%;" />
+<img src="https://alioss.timecho.com/docs/img/github/198181449-00d563c8-7bce-4ecd-a031-ec120ca42c3f.png" alt="image" style="zoom: 50%;" />
*(image source: https://iotdb.apache.org/UserGuide/Master/Process-Data/UDF-User-Defined-Function.html#udtf-user-defined-timeseries-generating-function)*
@@ -272,7 +272,7 @@ M4 is used to sample the `first, last, bottom, top` points for each sliding wind
+ `displayWindowBegin`: The starting position of the window (included). Long data type. Optional. If not set, default to Long.MIN_VALUE, meaning using the time of the first data point of the input time series as the starting position of the window.
+ `displayWindowEnd`: End time limit (excluded, essentially playing the same role as `WHERE time < displayWindowEnd`). Long data type. Optional. If not set, default to Long.MAX_VALUE, meaning there is no additional end time limit other than the end of the input time series itself.
-<img src="/img/github/198183015-93b56644-3330-4acf-ae9e-d718a02b5f4c.png" alt="groupBy window" style="zoom: 67%;" />
+<img src="https://alioss.timecho.com/docs/img/github/198183015-93b56644-3330-4acf-ae9e-d718a02b5f4c.png" alt="groupBy window" style="zoom: 67%;" />
*(image source: https://iotdb.apache.org/UserGuide/Master/Query-Data/Aggregate-Query.html#downsampling-aggregate-query)*
diff --git a/docs/UserGuide/Operators-Functions/User-Defined-Function.md b/docs/UserGuide/Operators-Functions/User-Defined-Function.md
index bf933e81cd..3221b296db 100644
--- a/docs/UserGuide/Operators-Functions/User-Defined-Function.md
+++ b/docs/UserGuide/Operators-Functions/User-Defined-Function.md
@@ -171,7 +171,7 @@ The following are the strategies you can set:
`RowByRowAccessStrategy`: The construction of `RowByRowAccessStrategy` does not require any parameters.
The `SlidingTimeWindowAccessStrategy` is shown schematically below.
-<img style="width:100%; max-width:800px; max-height:600px; margin-left:auto; margin-right:auto; display:block;" src="/img/UserGuide/Process-Data/UDF-User-Defined-Function/timeWindow.png">
+<img style="width:100%; max-width:800px; max-height:600px; margin-left:auto; margin-right:auto; display:block;" src="https://alioss.timecho.com/docs/img/UserGuide/Process-Data/UDF-User-Defined-Function/timeWindow.png">
`SlidingTimeWindowAccessStrategy`: `SlidingTimeWindowAccessStrategy` has many constructors, you can pass 3 types of parameters to them:
@@ -185,12 +185,12 @@ The sliding step parameter is also optional. If the parameter is not provided, t
The relationship between the three types of parameters can be seen in the figure below. Please see the Javadoc for more details.
-<div style="text-align: center;"><img style="width:100%; max-width:800px; max-height:600px; margin-left:auto; margin-right:auto; display:block;" src="/img/github/99787878-47b51480-2b5b-11eb-8ed3-84088c5c30f7.png"></div>
+<div style="text-align: center;"><img style="width:100%; max-width:800px; max-height:600px; margin-left:auto; margin-right:auto; display:block;" src="https://alioss.timecho.com/docs/img/github/99787878-47b51480-2b5b-11eb-8ed3-84088c5c30f7.png"></div>
Note that the actual time interval of some of the last time windows may be less than the specified time interval parameter. In addition, there may be cases where the number of data rows in some time windows is 0. In these cases, the framework will also call the `transform` method for the empty windows.
The `SlidingSizeWindowAccessStrategy` is shown schematically below.
-<img style="width:100%; max-width:800px; max-height:600px; margin-left:auto; margin-right:auto; display:block;" src="/img/UserGuide/Process-Data/UDF-User-Defined-Function/countWindow.png">
+<img style="width:100%; max-width:800px; max-height:600px; margin-left:auto; margin-right:auto; display:block;" src="https://alioss.timecho.com/docs/img/UserGuide/Process-Data/UDF-User-Defined-Function/countWindow.png">
`SlidingSizeWindowAccessStrategy`: `SlidingSizeWindowAccessStrategy` has many constructors, you can pass 2 types of parameters to them:
@@ -200,7 +200,7 @@ The `SlidingSizeWindowAccessStrategy` is shown schematically below.
The sliding step parameter is optional. If the parameter is not provided, the sliding step will be set to the same as the window size.
The `SessionTimeWindowAccessStrategy` is shown schematically below. **Time intervals less than or equal to the given minimum time interval `sessionGap` are assigned in one group**
-<img style="width:100%; max-width:800px; max-height:600px; margin-left:auto; margin-right:auto; display:block;" src="/img/UserGuide/Process-Data/UDF-User-Defined-Function/sessionWindow.png">
+<img style="width:100%; max-width:800px; max-height:600px; margin-left:auto; margin-right:auto; display:block;" src="https://alioss.timecho.com/docs/img/UserGuide/Process-Data/UDF-User-Defined-Function/sessionWindow.png">
`SessionTimeWindowAccessStrategy`: `SessionTimeWindowAccessStrategy` has many constructors, you can pass 2 types of parameters to them:
- Parameter 1: The display window on the time axis.
@@ -208,7 +208,7 @@ The `SessionTimeWindowAccessStrategy` is shown schematically below. **Time inter
The `StateWindowAccessStrategy` is shown schematically below. **For numerical data, if the state difference is less than or equal to the given threshold `delta`, it will be assigned in one group. **
-<img style="width:100%; max-width:800px; max-height:600px; margin-left:auto; margin-right:auto; display:block;" src="/img/UserGuide/Process-Data/UDF-User-Defined-Function/stateWindow.png">
+<img style="width:100%; max-width:800px; max-height:600px; margin-left:auto; margin-right:auto; display:block;" src="https://alioss.timecho.com/docs/img/UserGuide/Process-Data/UDF-User-Defined-Function/stateWindow.png">
`StateWindowAccessStrategy` has four constructors.
- Constructor 1: For numerical data, there are 3 parameters: the time axis can display the start and end time of the time window and the threshold `delta` for the allowable change within a single window.
diff --git a/docs/UserGuide/Query-Data/Continuous-Query.md b/docs/UserGuide/Query-Data/Continuous-Query.md
index e536480d1b..a31216c289 100644
--- a/docs/UserGuide/Query-Data/Continuous-Query.md
+++ b/docs/UserGuide/Query-Data/Continuous-Query.md
@@ -75,19 +75,19 @@ END
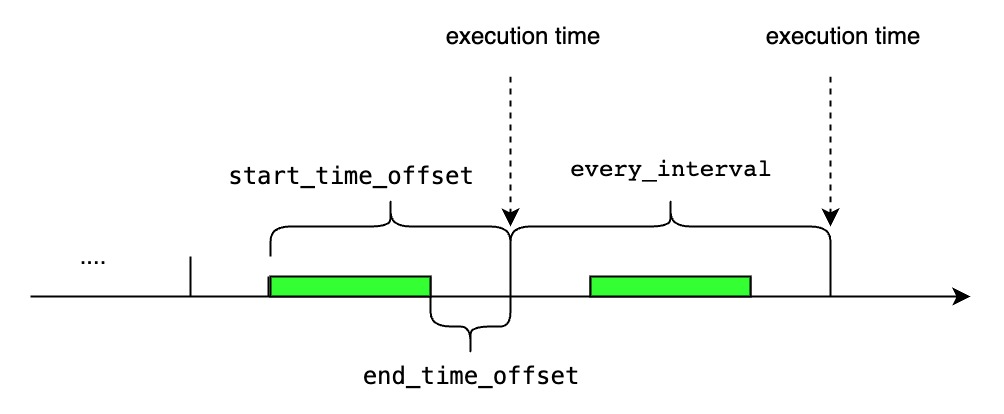
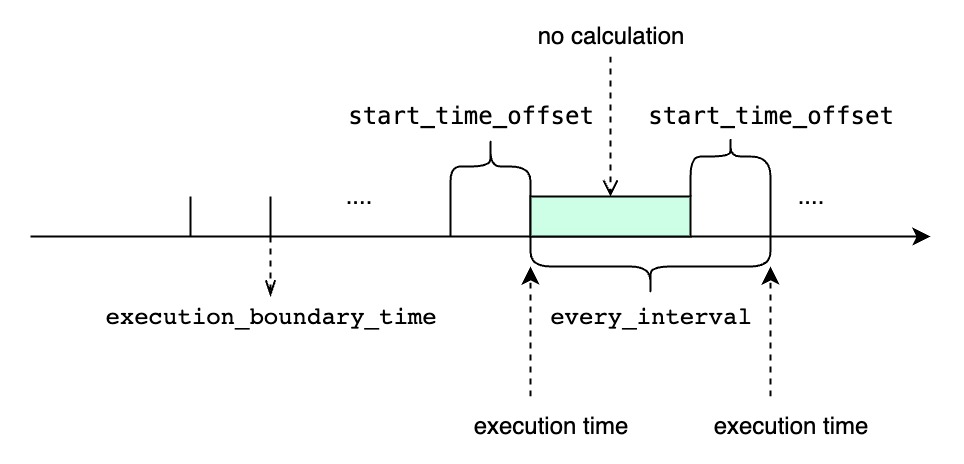
#### `<start_time_offset>` == `<every_interval>`
-
+
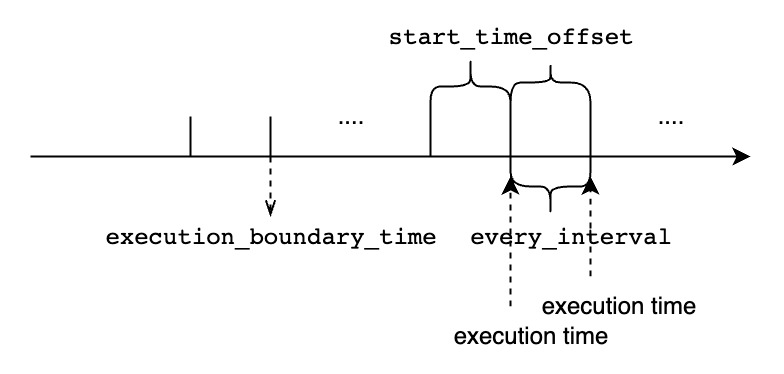
#### `<start_time_offset>` > `<every_interval>`
-
+
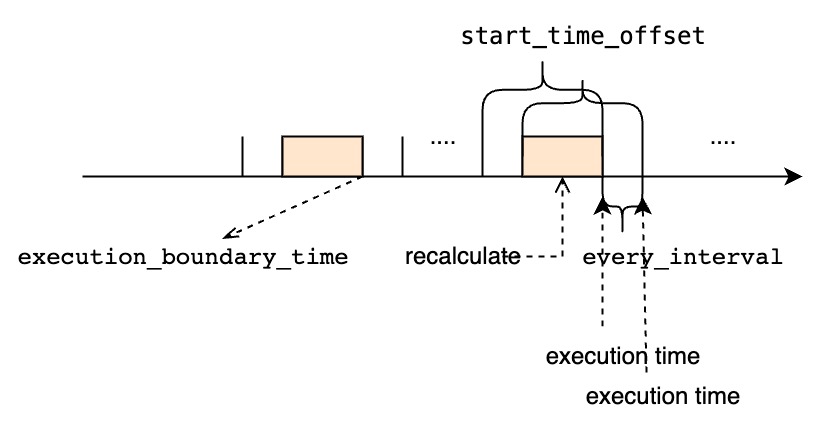
#### `<start_time_offset>` < `<every_interval>`
-
+
#### `<every_interval>` is not zero
-
+
- `TIMEOUT POLICY` specify how we deal with the cq task whose previous time interval execution is not finished while the next execution time has reached. The default value is `BLOCKED`.
diff --git a/docs/UserGuide/Query-Data/Group-By.md b/docs/UserGuide/Query-Data/Group-By.md
index c6f5196a02..eb90e5871b 100644
--- a/docs/UserGuide/Query-Data/Group-By.md
+++ b/docs/UserGuide/Query-Data/Group-By.md
@@ -135,7 +135,7 @@ The GROUP BY statement provides users with three types of specified parameters:
The actual meanings of the three types of parameters are shown in Figure below.
Among them, the parameter 3 is optional.
-<center><img style="width:100%; max-width:800px; max-height:600px; margin-left:auto; margin-right:auto; display:block;" src="/img/github/69109512-f808bc80-0ab2-11ea-9e4d-b2b2f58fb474.png">
+<center><img style="width:100%; max-width:800px; max-height:600px; margin-left:auto; margin-right:auto; display:block;" src="https://alioss.timecho.com/docs/img/github/69109512-f808bc80-0ab2-11ea-9e4d-b2b2f58fb474.png">
</center>
There are three typical examples of frequency reduction aggregation:
@@ -613,7 +613,7 @@ The supported return types of controlExpression and how to deal with null value
| delta!=0 | INT32、INT64、FLOAT、DOUBLE | If the processing group doesn't contains null, null value should be treated as infinity/infinitesimal and will end current group.<br/>Continuous null values are treated as stable values and assigned to the same group. |
| delta=0 | TEXT、BINARY、INT32、INT64、FLOAT、DOUBLE | Null is treated as a new value in a new group and continuous nulls belong to the same group. |
-<img style="width:100%; max-width:800px; max-height:600px; margin-left:auto; margin-right:auto; display:block;" src="/img/UserGuide/Process-Data/GroupBy/groupByVariation.jpeg" alt="groupByVariation">
+<img style="width:100%; max-width:800px; max-height:600px; margin-left:auto; margin-right:auto; display:block;" src="https://alioss.timecho.com/docs/img/UserGuide/Process-Data/GroupBy/groupByVariation.jpeg" alt="groupByVariation">
### Precautions for Use
1. The result of controlExpression should be a unique value. If multiple columns appear after using wildcard stitching, an error will be reported.
@@ -790,7 +790,7 @@ A given interval threshold to create a new group of data when the difference bet
The figure below is a grouping diagram under `GROUP BY SESSION`.
-<img style="width:100%; max-width:800px; max-height:600px; margin-left:auto; margin-right:auto; display:block;" src="/img/UserGuide/Process-Data/GroupBy/groupBySession.jpeg" alt="groupBySession">
+<img style="width:100%; max-width:800px; max-height:600px; margin-left:auto; margin-right:auto; display:block;" src="https://alioss.timecho.com/docs/img/UserGuide/Process-Data/GroupBy/groupBySession.jpeg" alt="groupBySession">
### Precautions for Use
1. For a group in resultSet, the time column output the start time of the group by default. __endTime can be used in select clause to output the endTime of groups in resultSet.
diff --git a/docs/UserGuide/QuickStart/Command-Line-Interface.md b/docs/UserGuide/QuickStart/Command-Line-Interface.md
index ca755d83c2..0f32933f11 100644
--- a/docs/UserGuide/QuickStart/Command-Line-Interface.md
+++ b/docs/UserGuide/QuickStart/Command-Line-Interface.md
@@ -145,48 +145,48 @@ Shell >cd bin
Shell >bash ./standalone.sh
```
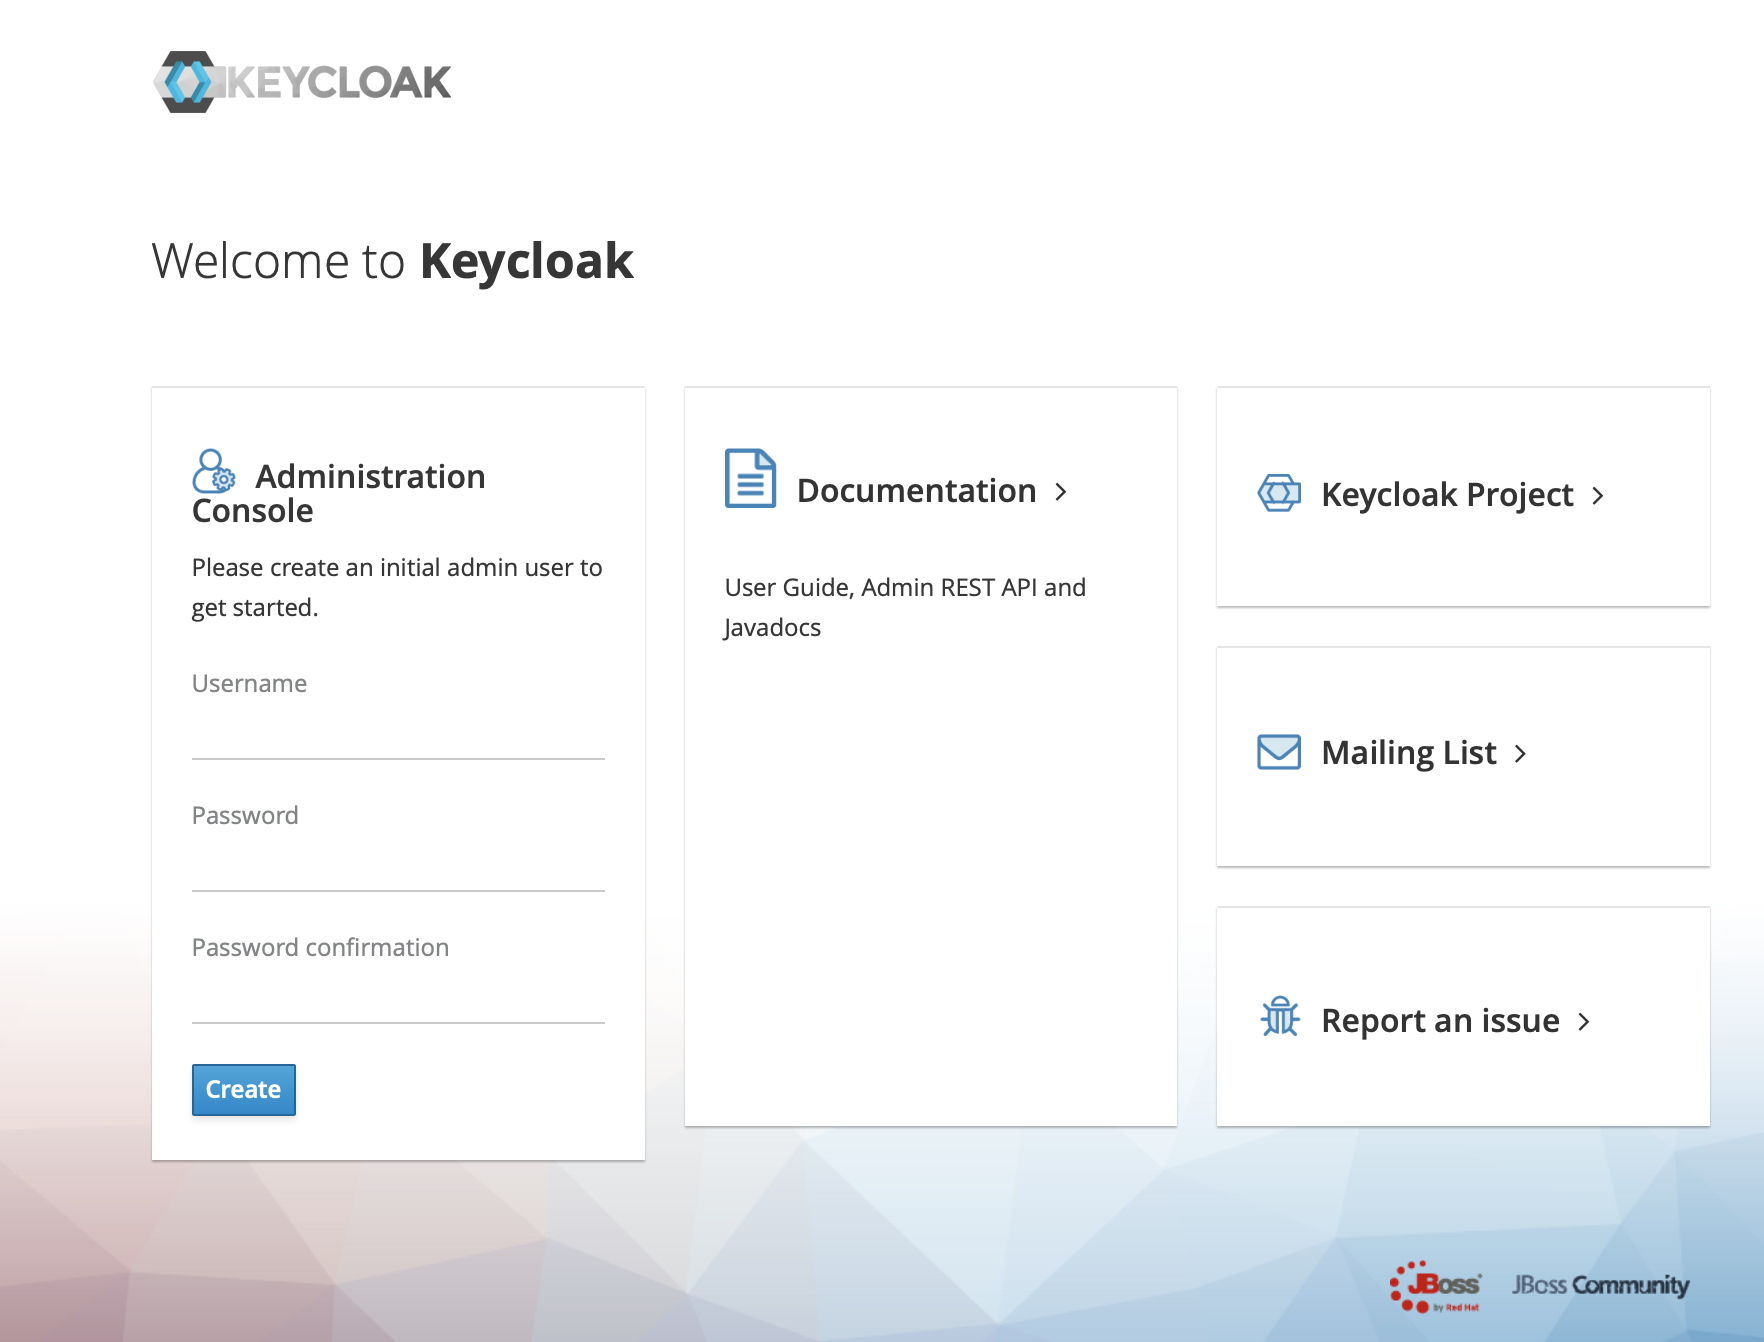
2、use url(https://ip:port/auth) login keycloack, the first login needs to create a user
-
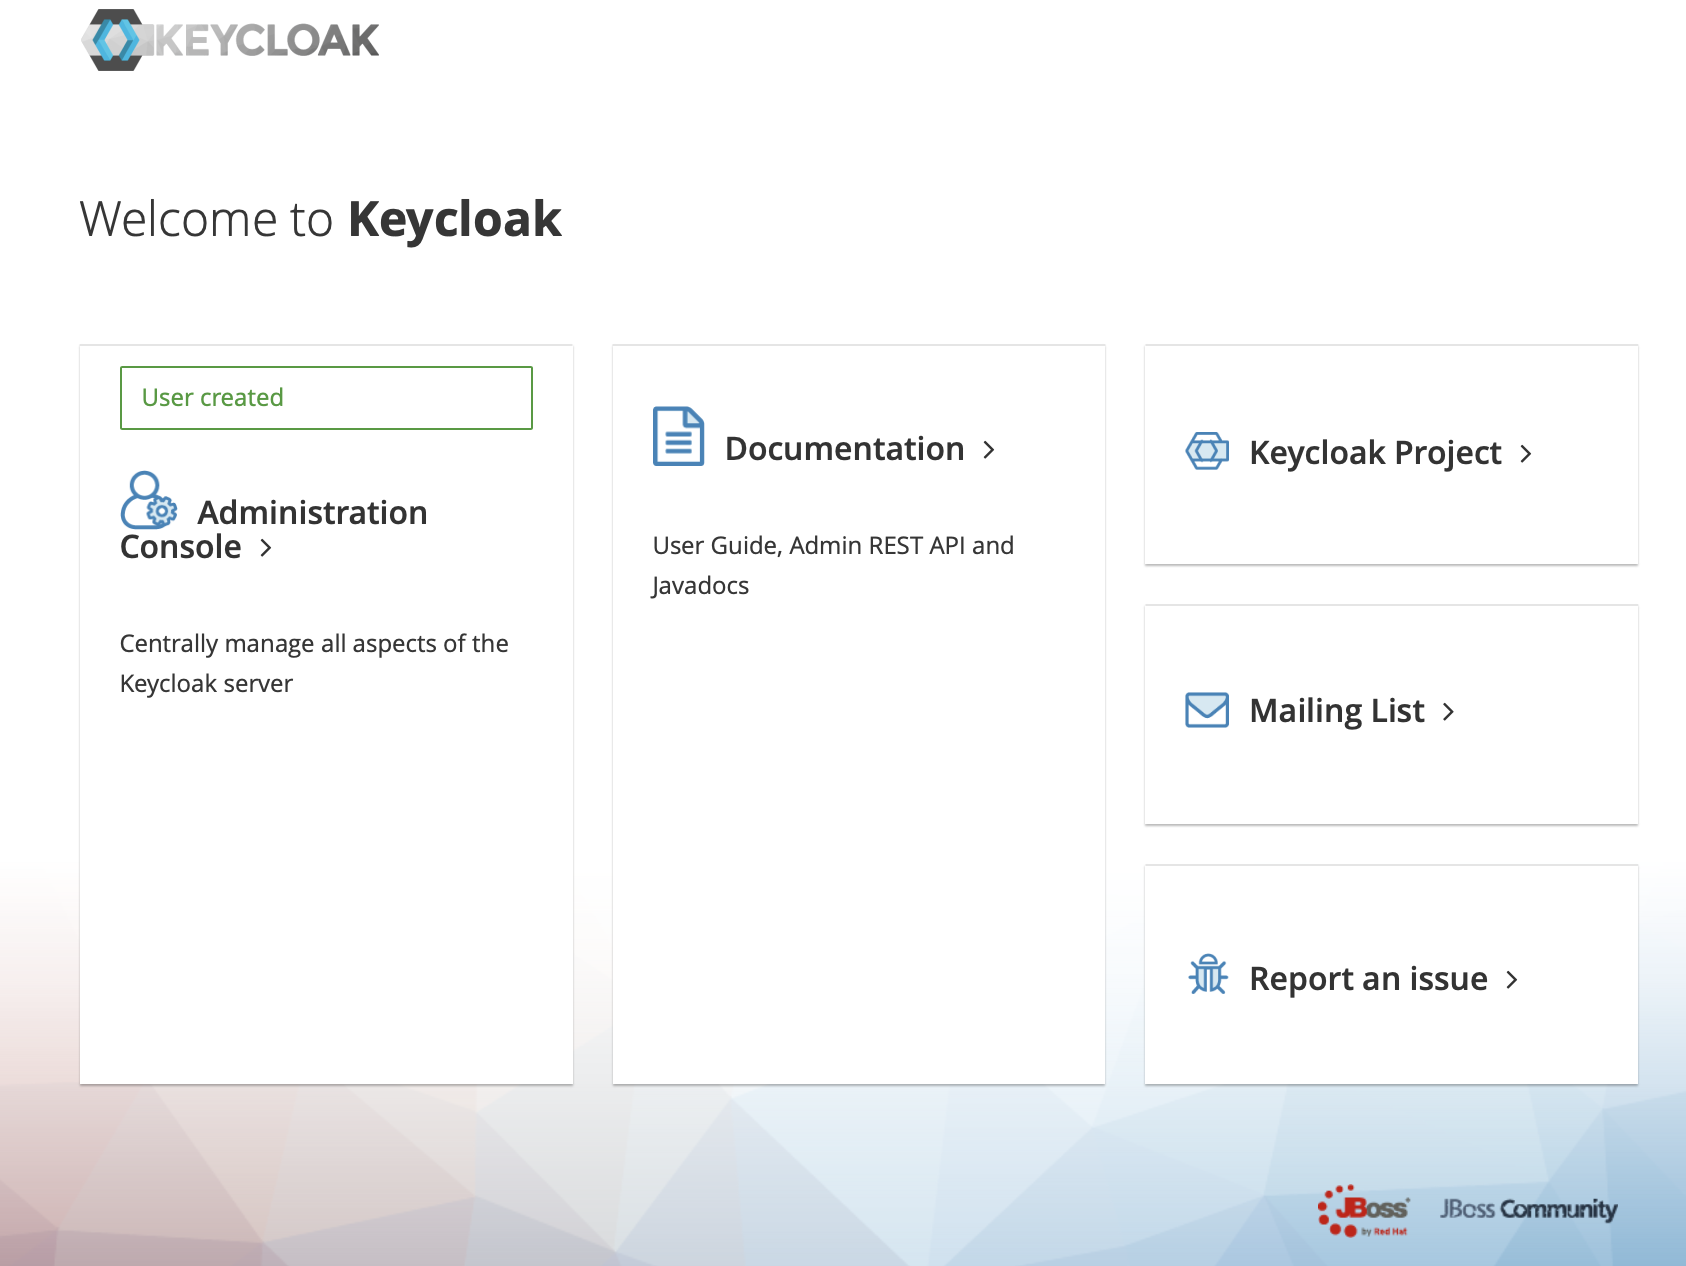
+
3、Click administration console
-
+
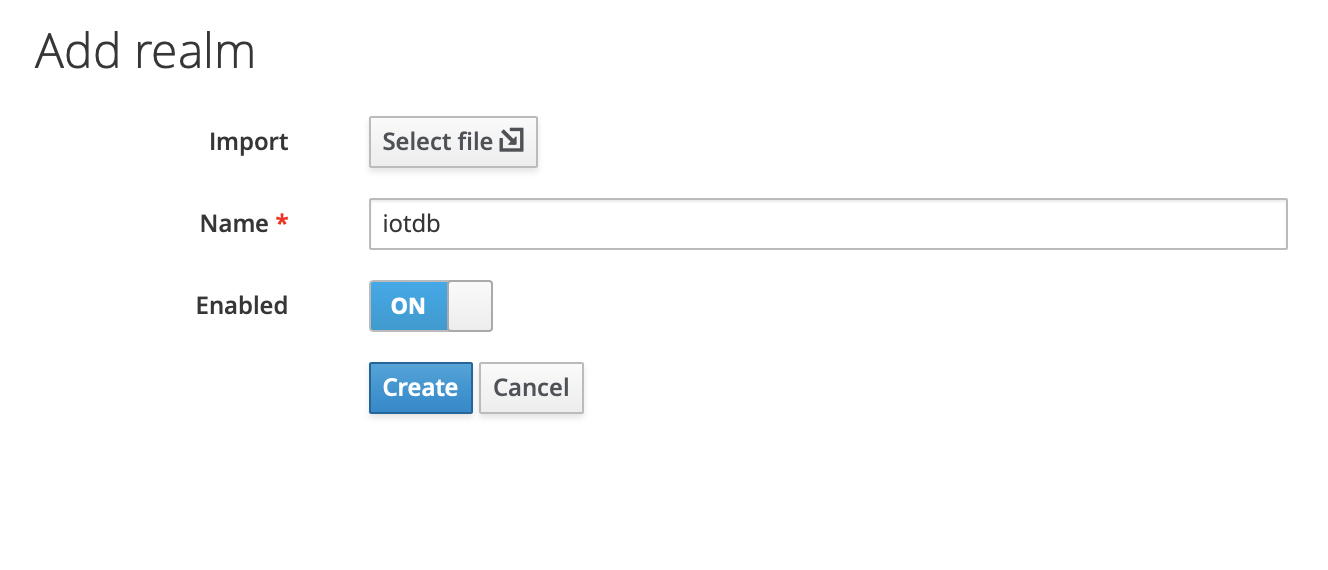
4、In the master menu on the left, click Add realm and enter name to create a new realm
-
+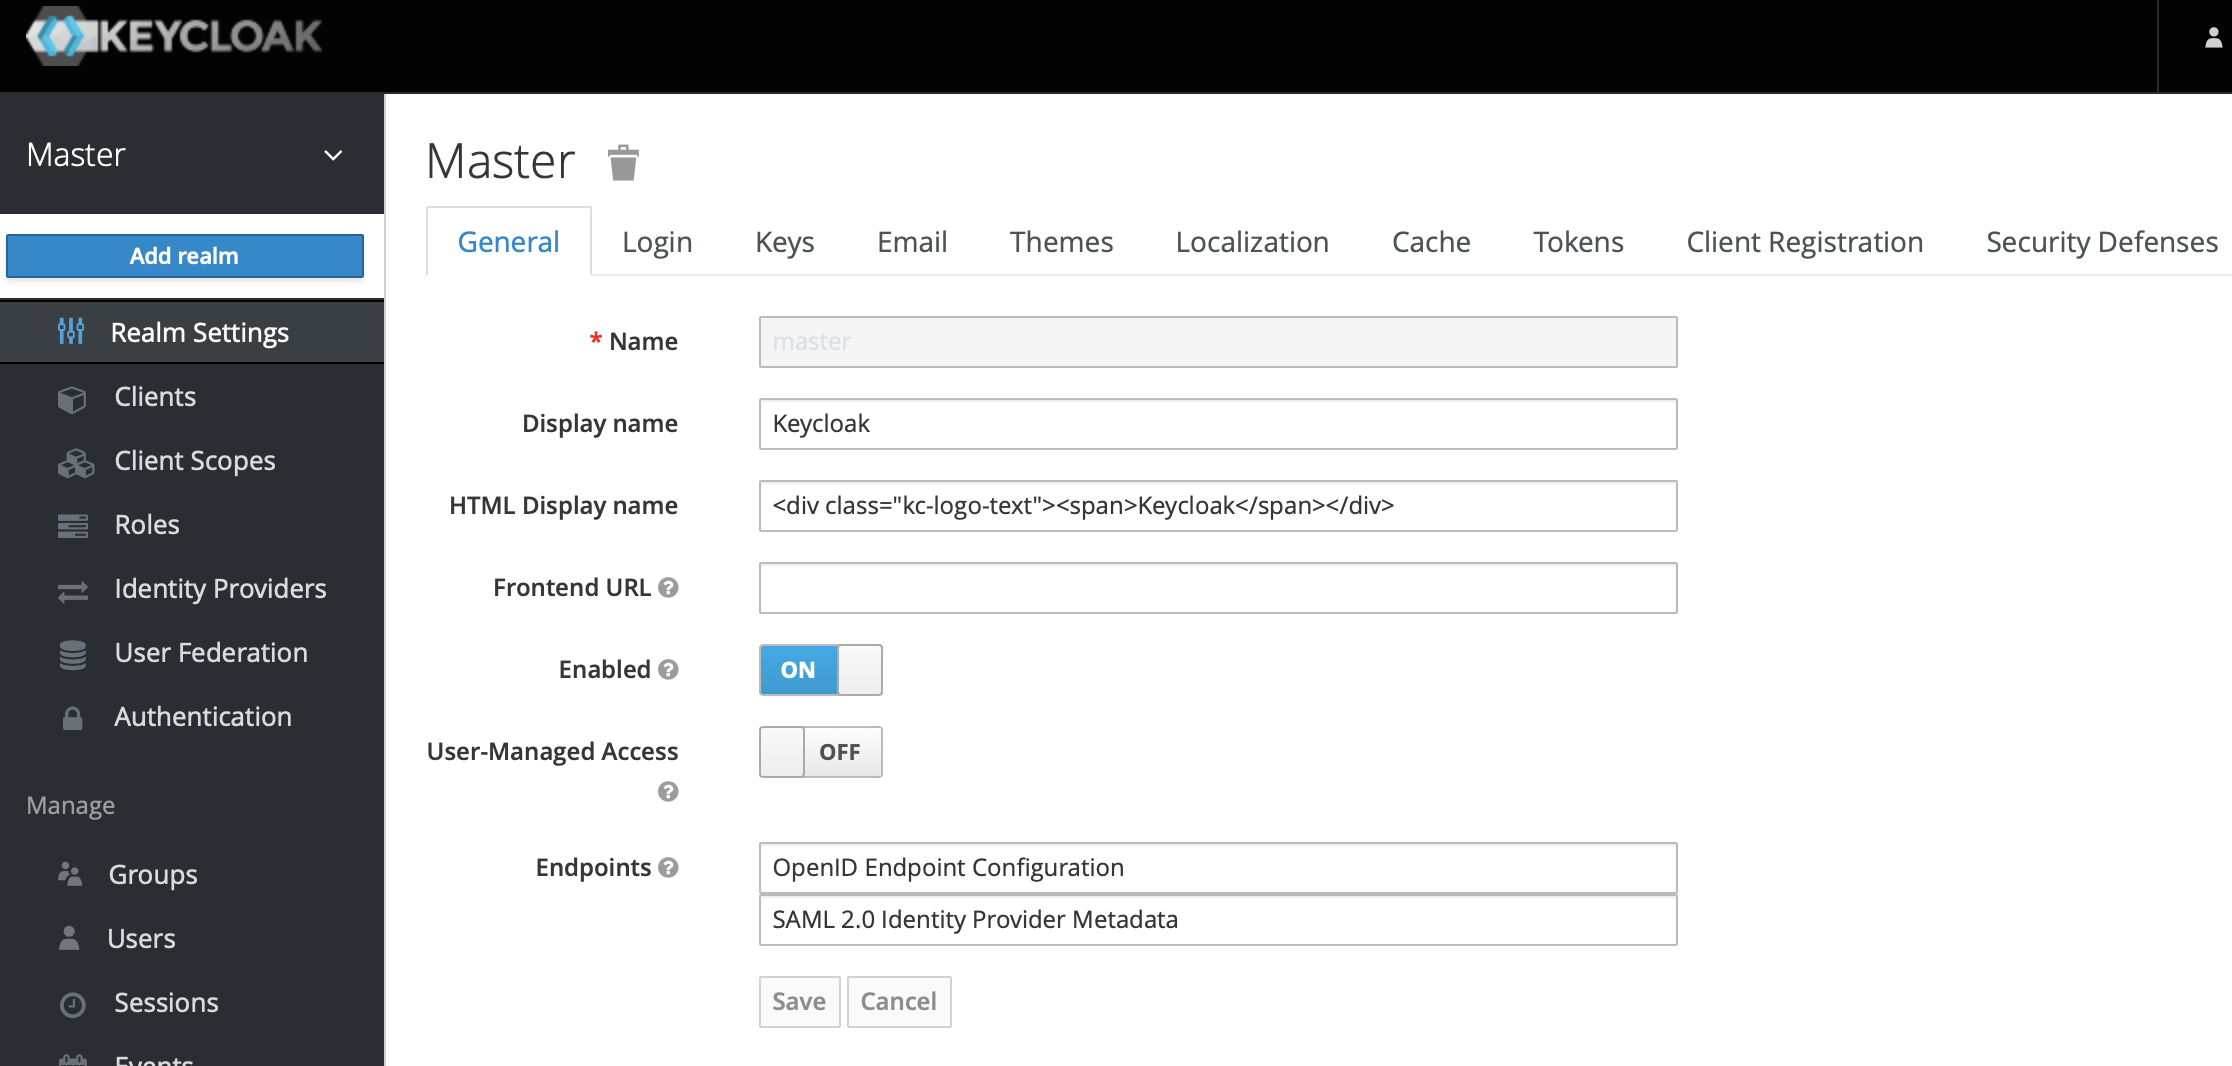
-
+
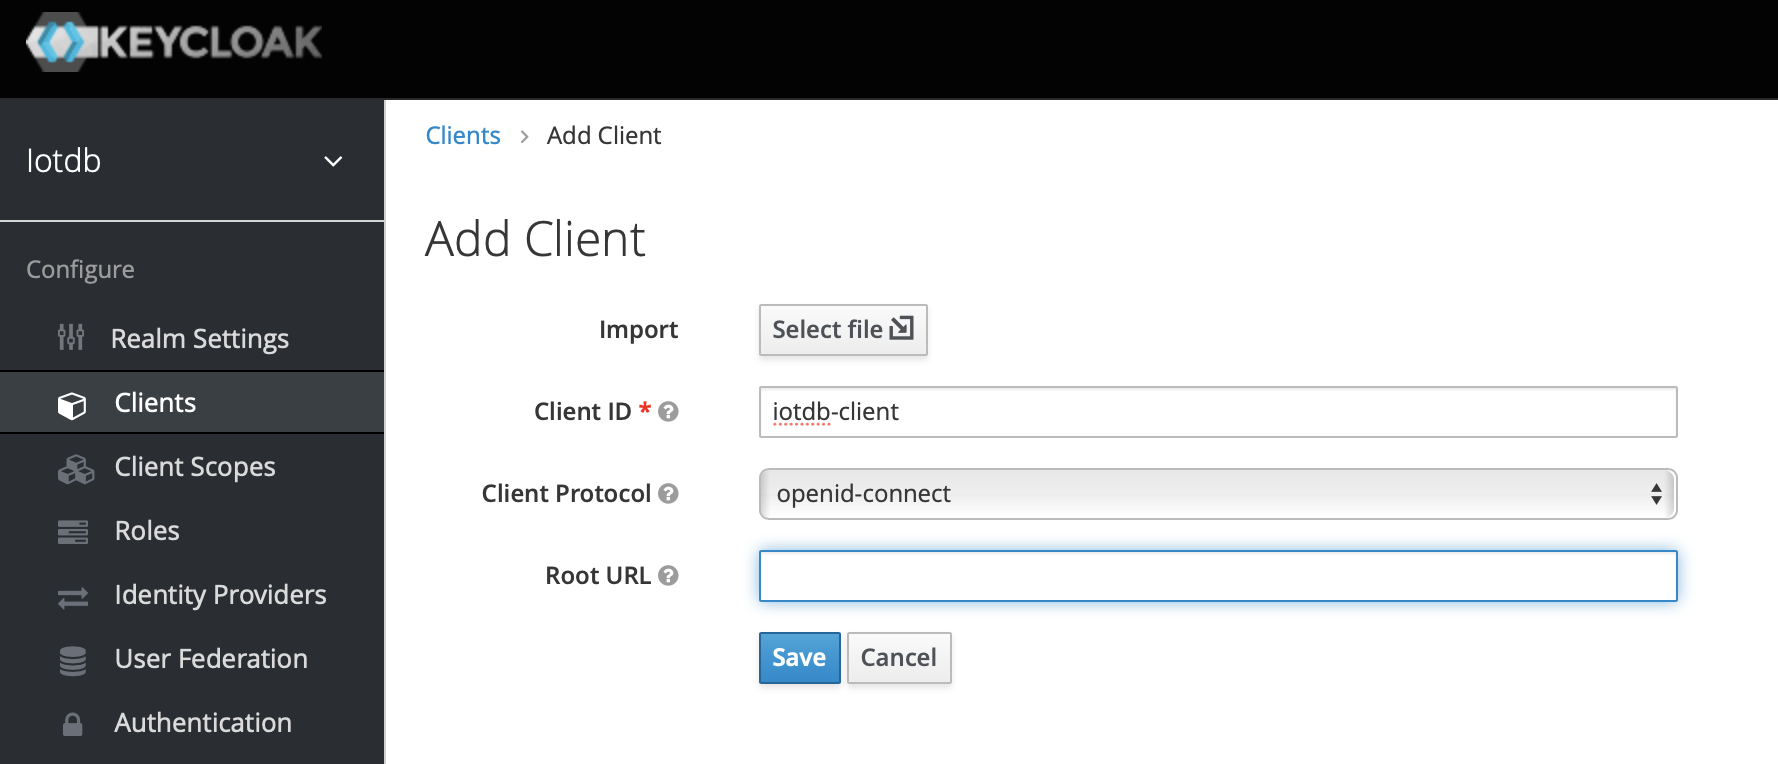
5、Click the menu clients on the left to create clients
-
+
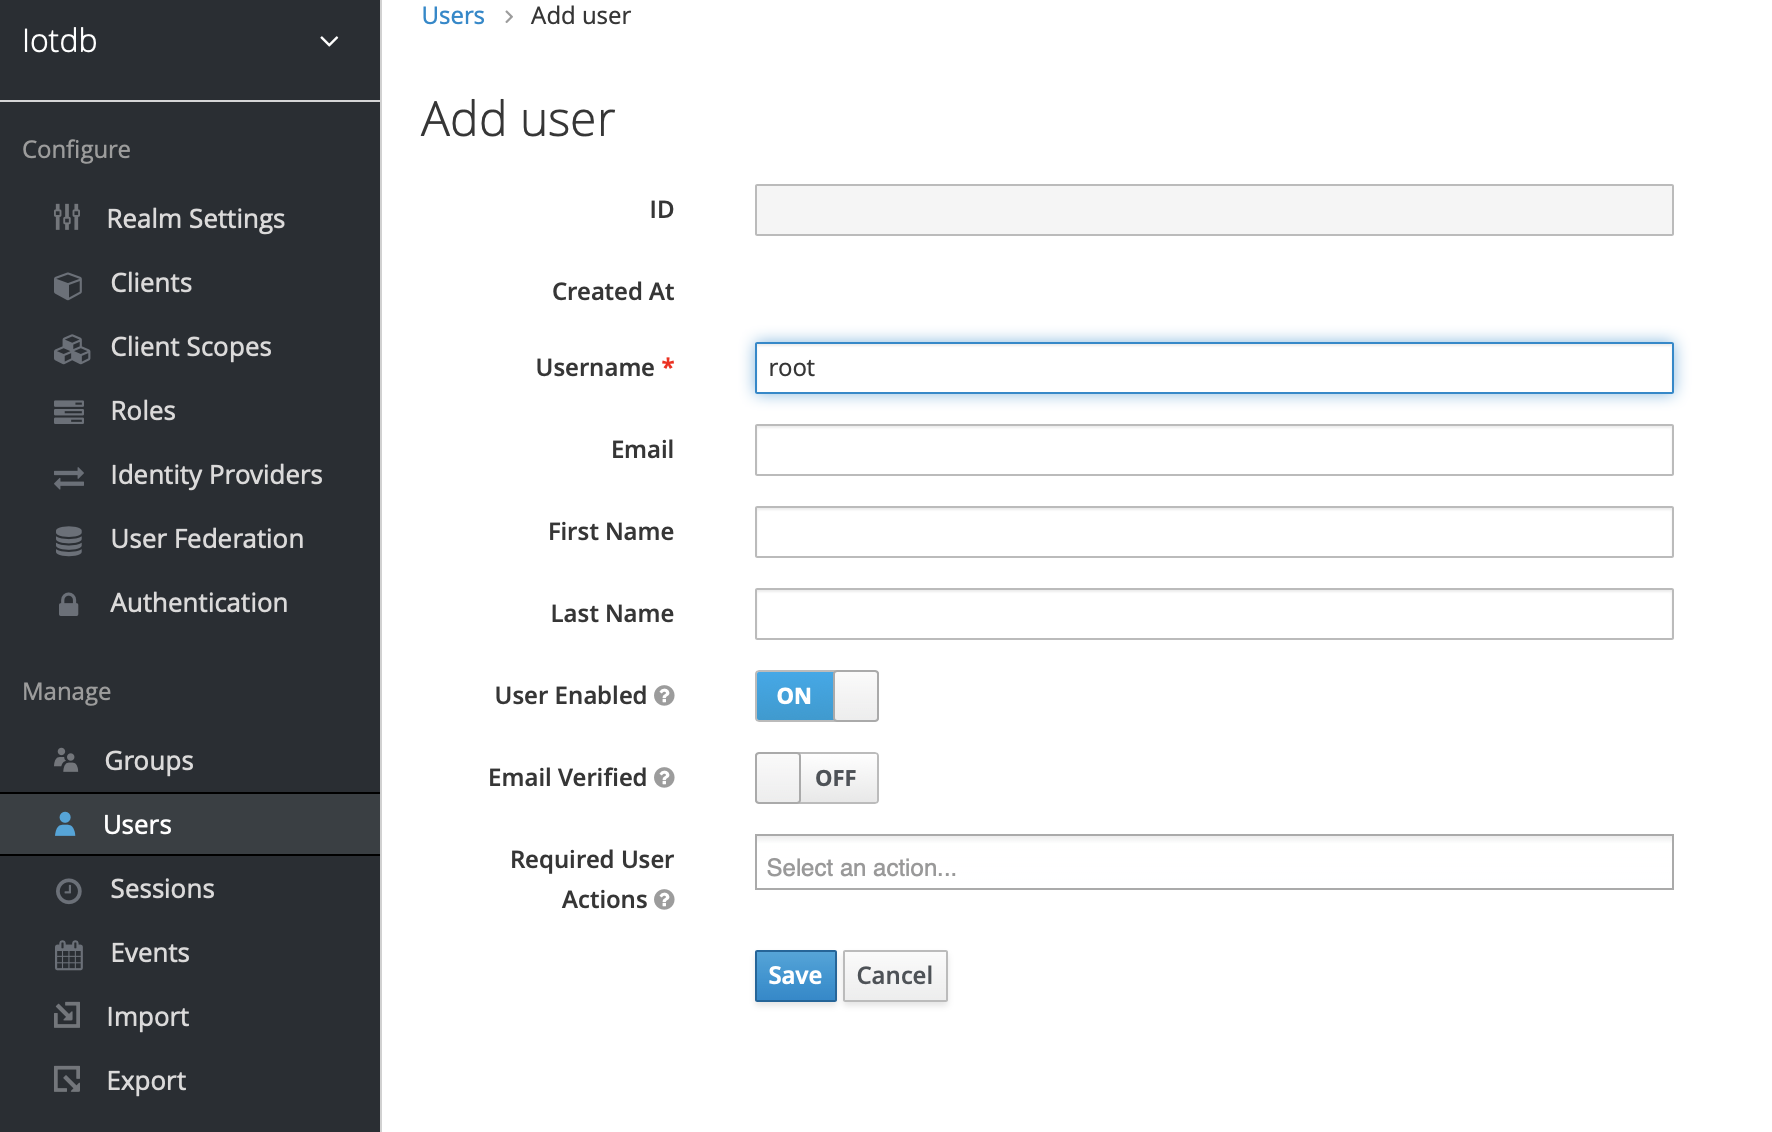
6、Click user on the left menu to create user
-
+
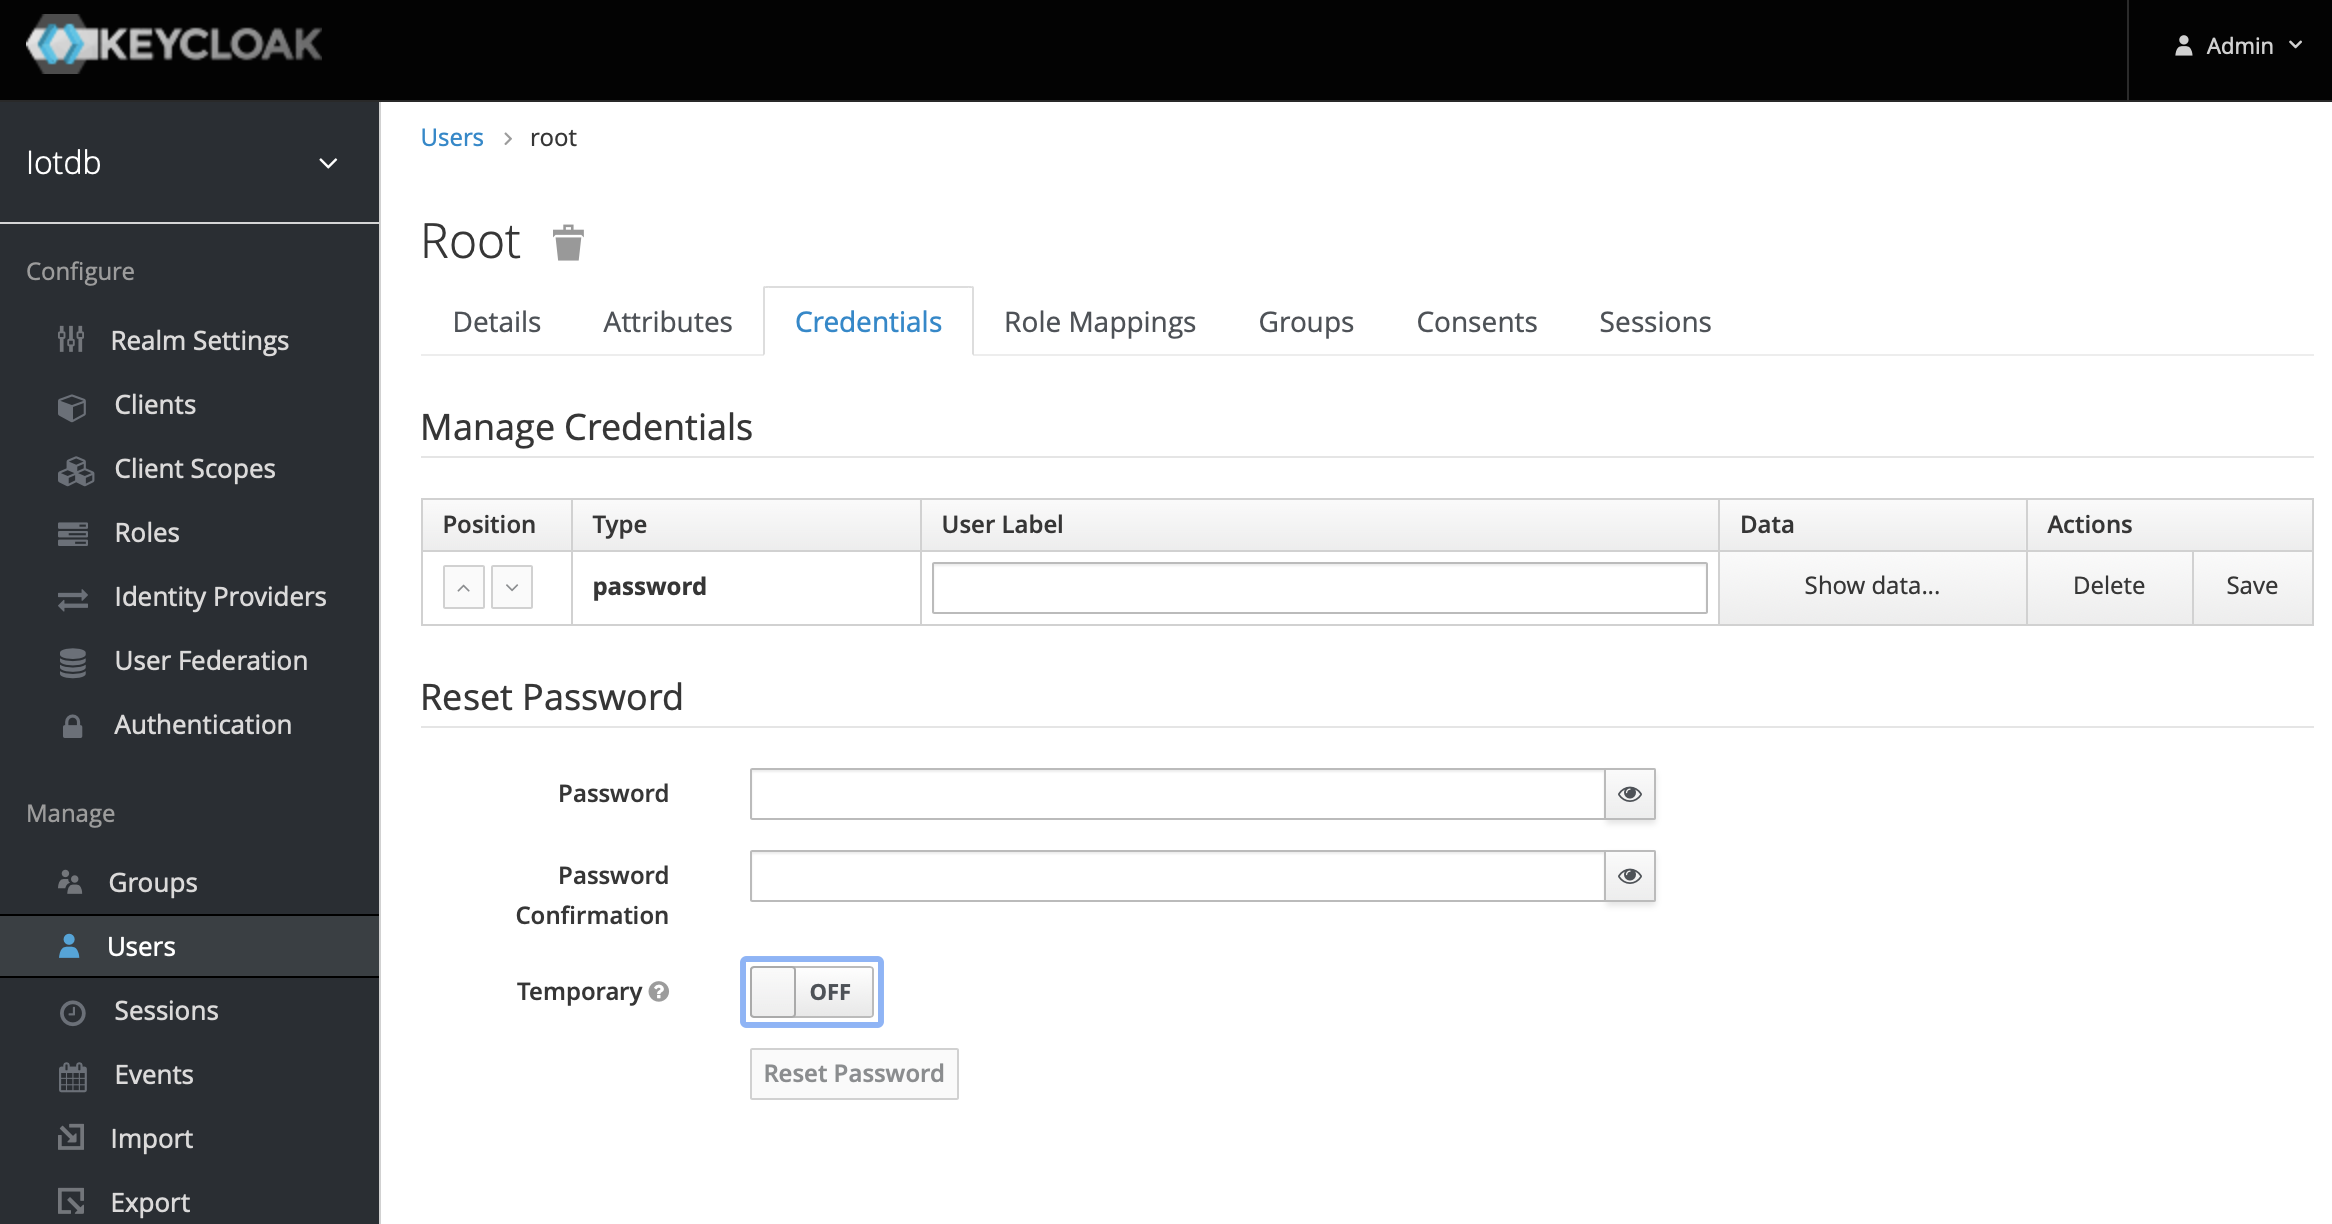
7、Click the newly created user ID, click the credentials navigation, enter the password and close the temporary option. The configuration of keycloud is completed
-
+
8、To create a role, click Roles on the left menu and then click the Add Role button to add a role
-
+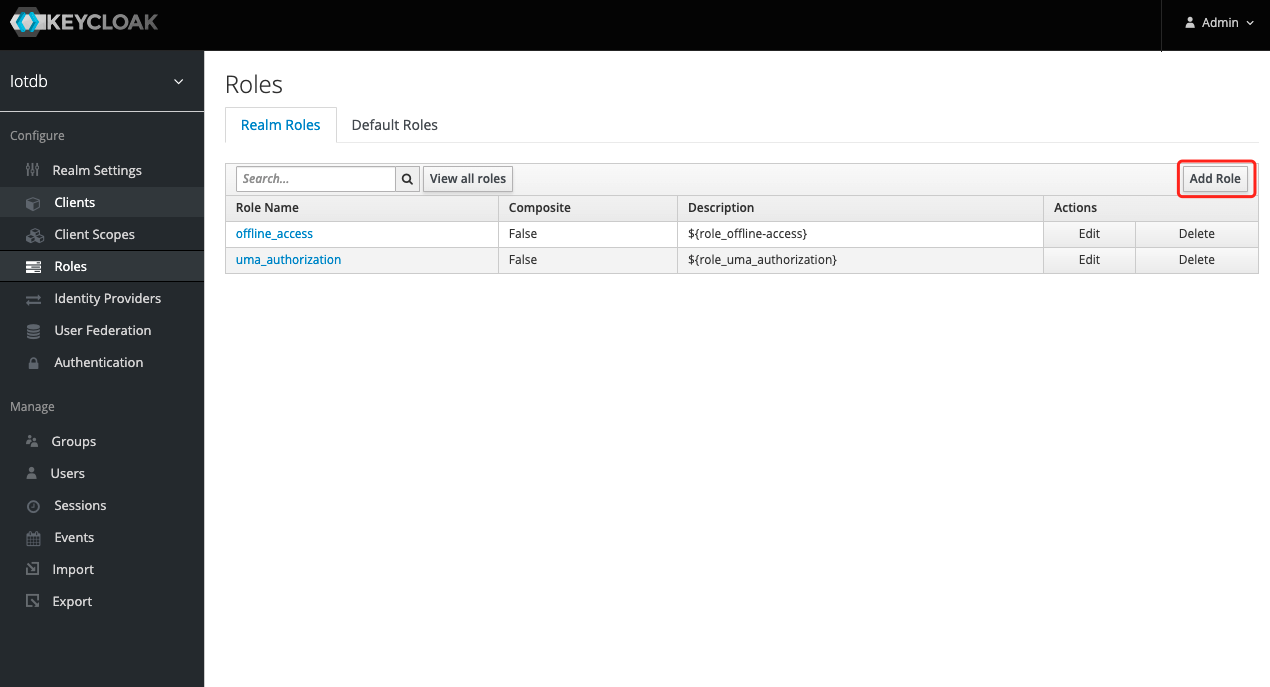
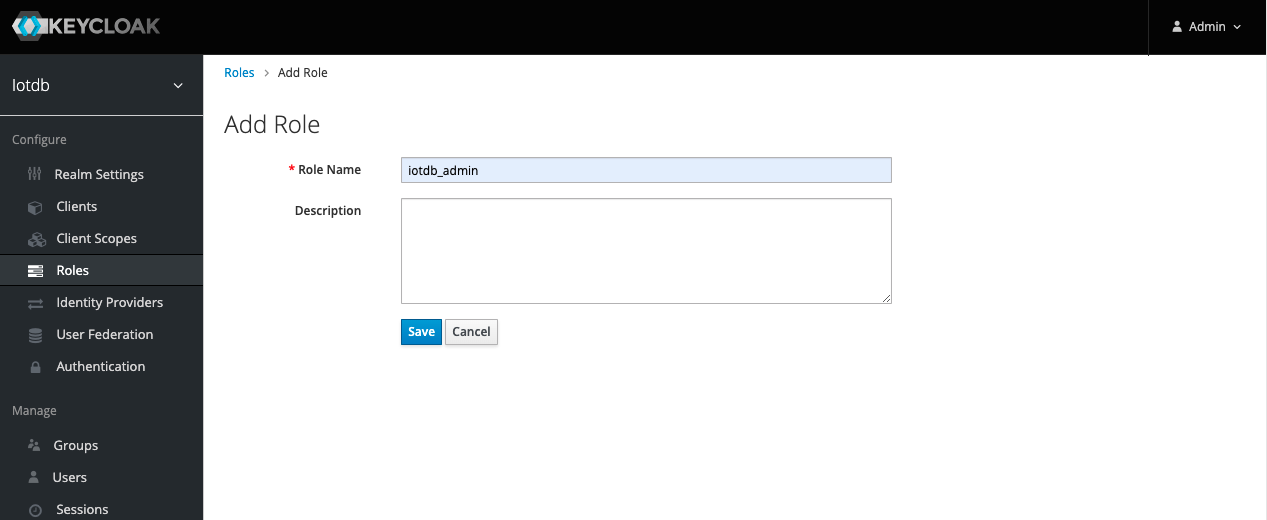
9、 Enter `iotdb_admin` in the Role Name and click the save button. Tip: `iotdb_admin` here cannot be any other name, otherwise even after successful login, you will not have permission to use iotdb's query, insert, create database, add users, roles and other functions
-
+
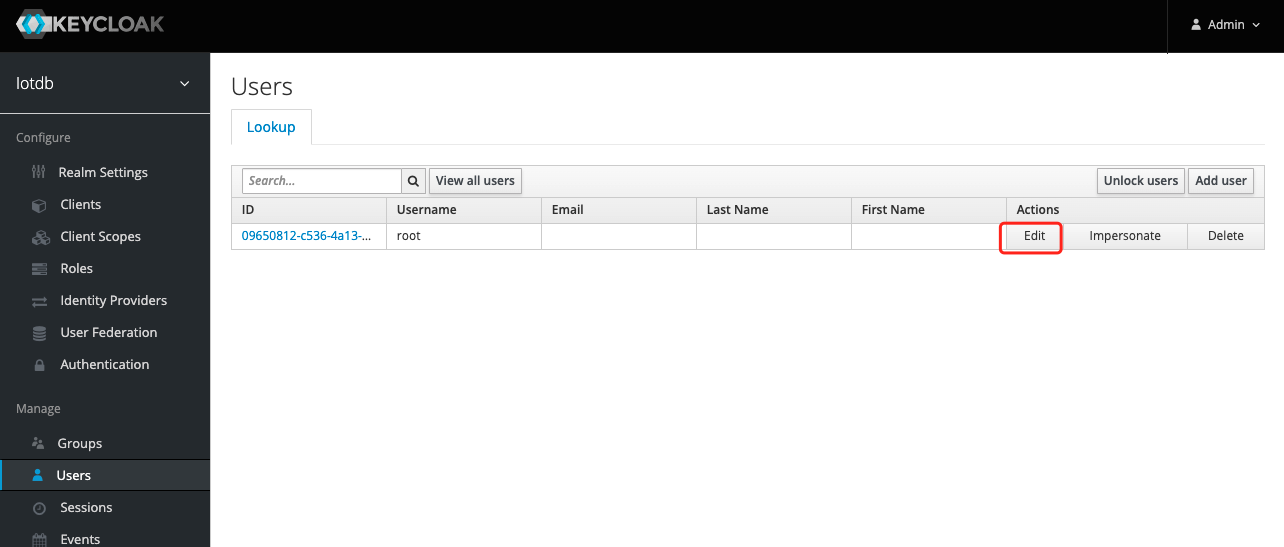
10、Click the User menu on the left and click the Edit button in the user list to add the `iotdb_admin` role we just created for this user
-
+
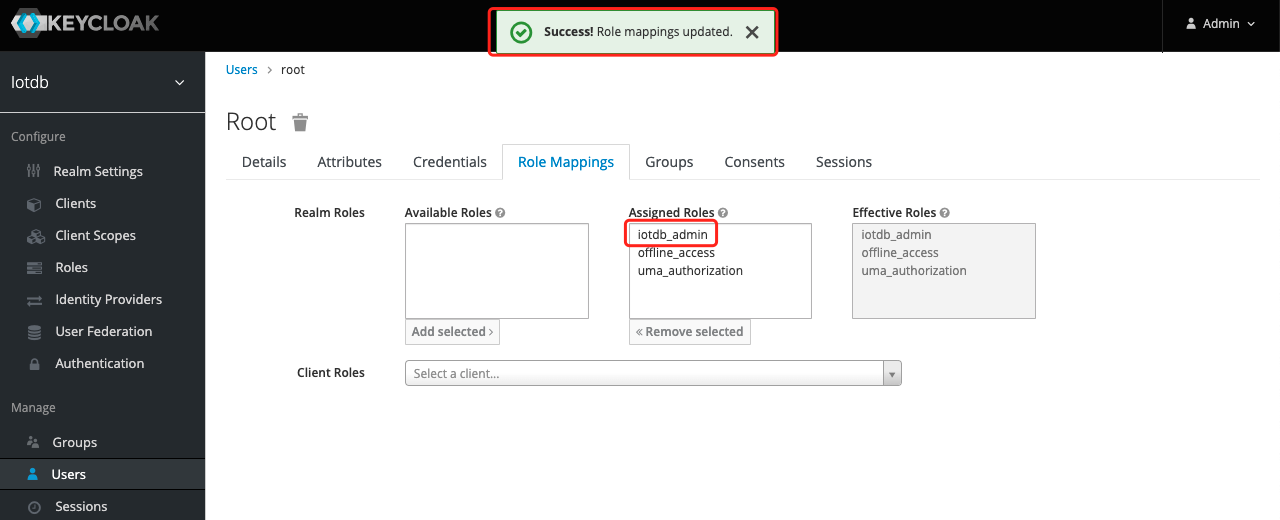
11、 Select Role Mappings, select the `iotdb_admin` role in Available Role and click the Add selected button to add the role
-
+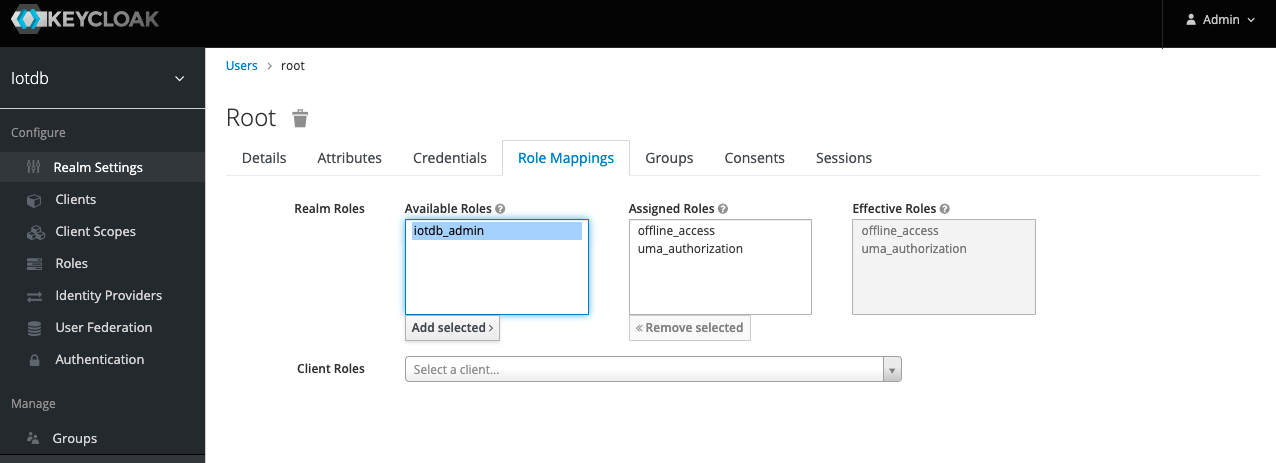
12. If the `iotdb_admin` role is in Assigned Roles and the `Success Role mappings updated` prompt appears, it proves that the role was added successfully
-
+
Tip: If the user role is adjusted, you need to regenerate the token and log in to iotdb again to take effect
diff --git a/docs/UserGuide/Reference/TSDB-Comparison.md b/docs/UserGuide/Reference/TSDB-Comparison.md
index aaa0bf1789..8b33561d82 100644
--- a/docs/UserGuide/Reference/TSDB-Comparison.md
+++ b/docs/UserGuide/Reference/TSDB-Comparison.md
@@ -23,7 +23,7 @@
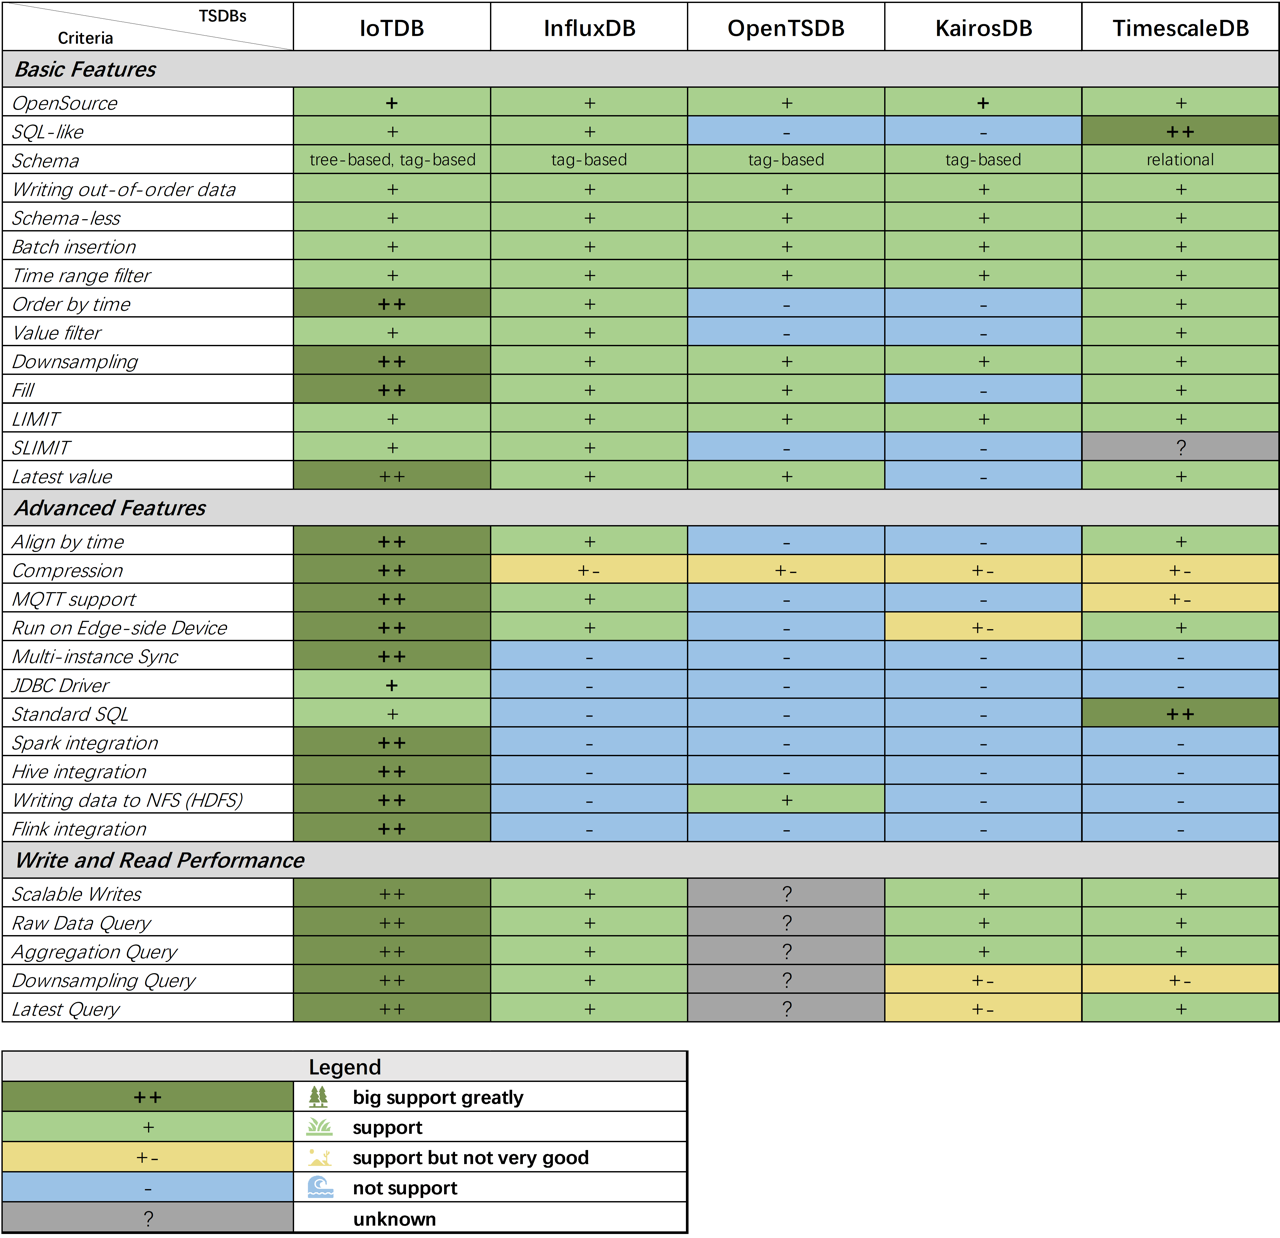
## Overview
-
+
@@ -320,7 +320,7 @@ IoTDB uses batch insertion API and the batch size is distributed from 0 to 6000
The write throughput (points/second) is:
-
+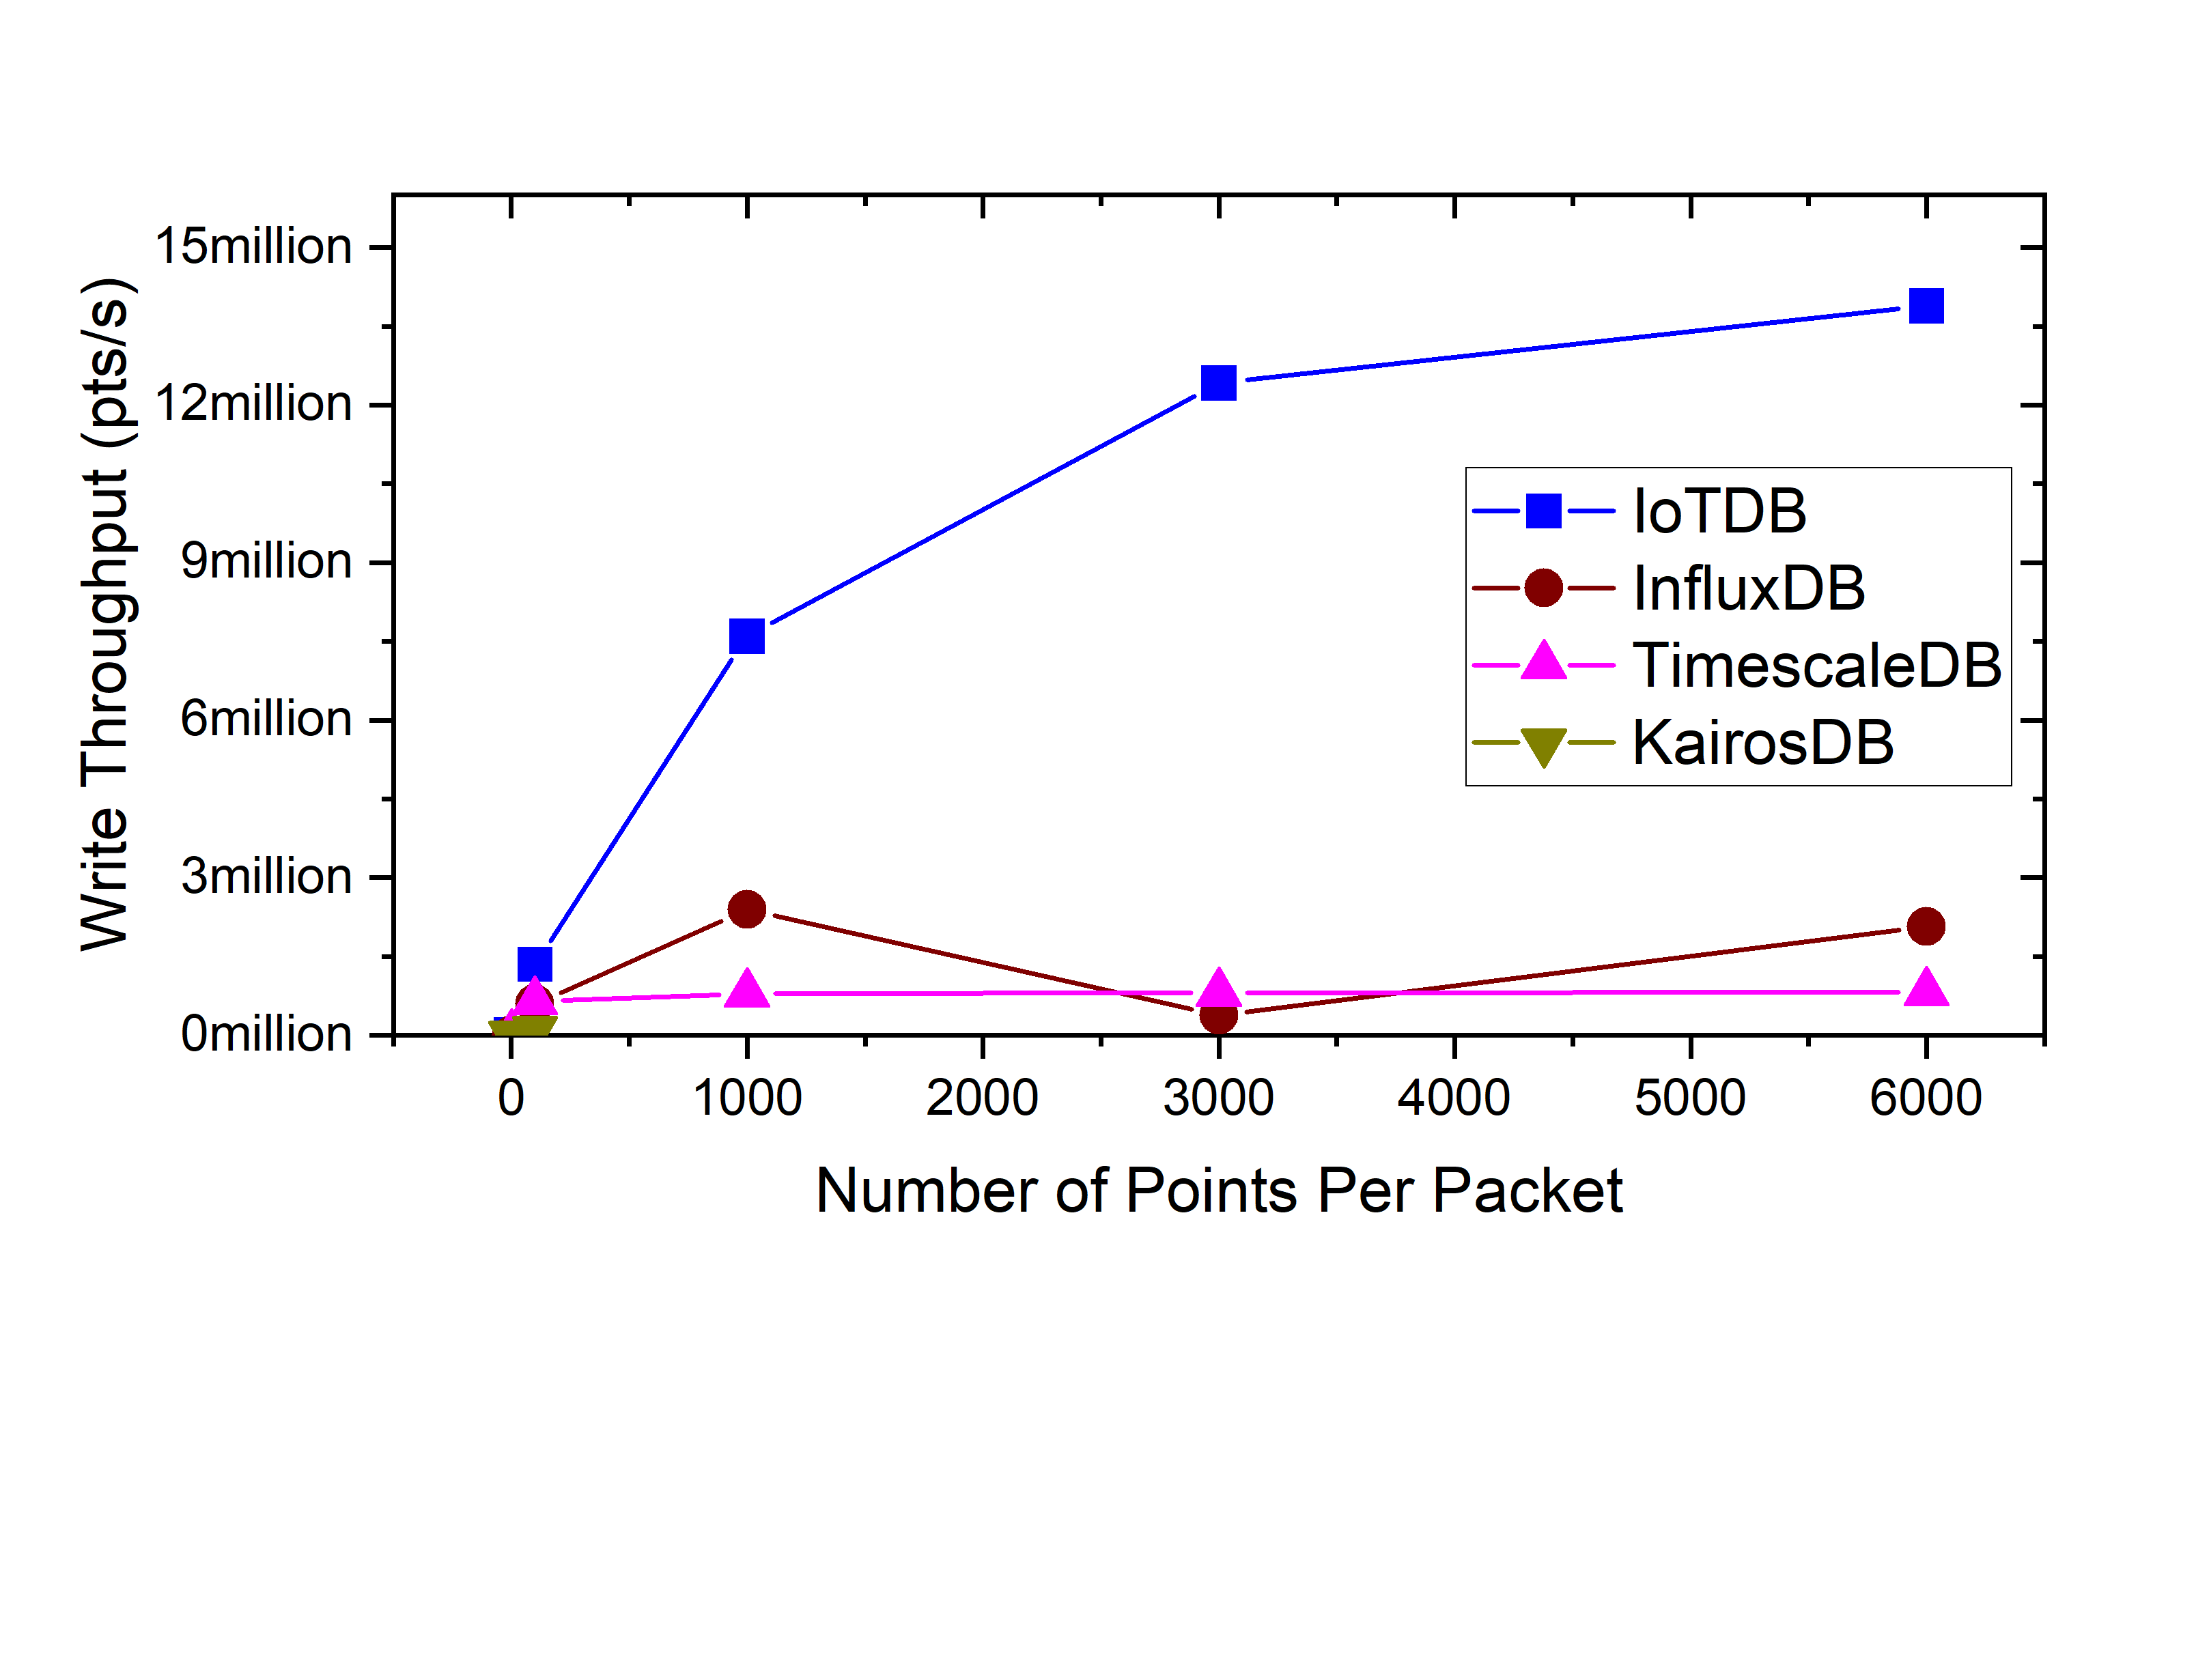
<span id = "exp1"> <center>Figure 1. Batch Size with Write throughput (points/second) IoTDB v0.11.1</center></span>
* client num:
@@ -330,24 +330,24 @@ IoTDB uses batch insertion API and the batch size is 100 (write 100 data points
The write throughput (points/second) is:
-
+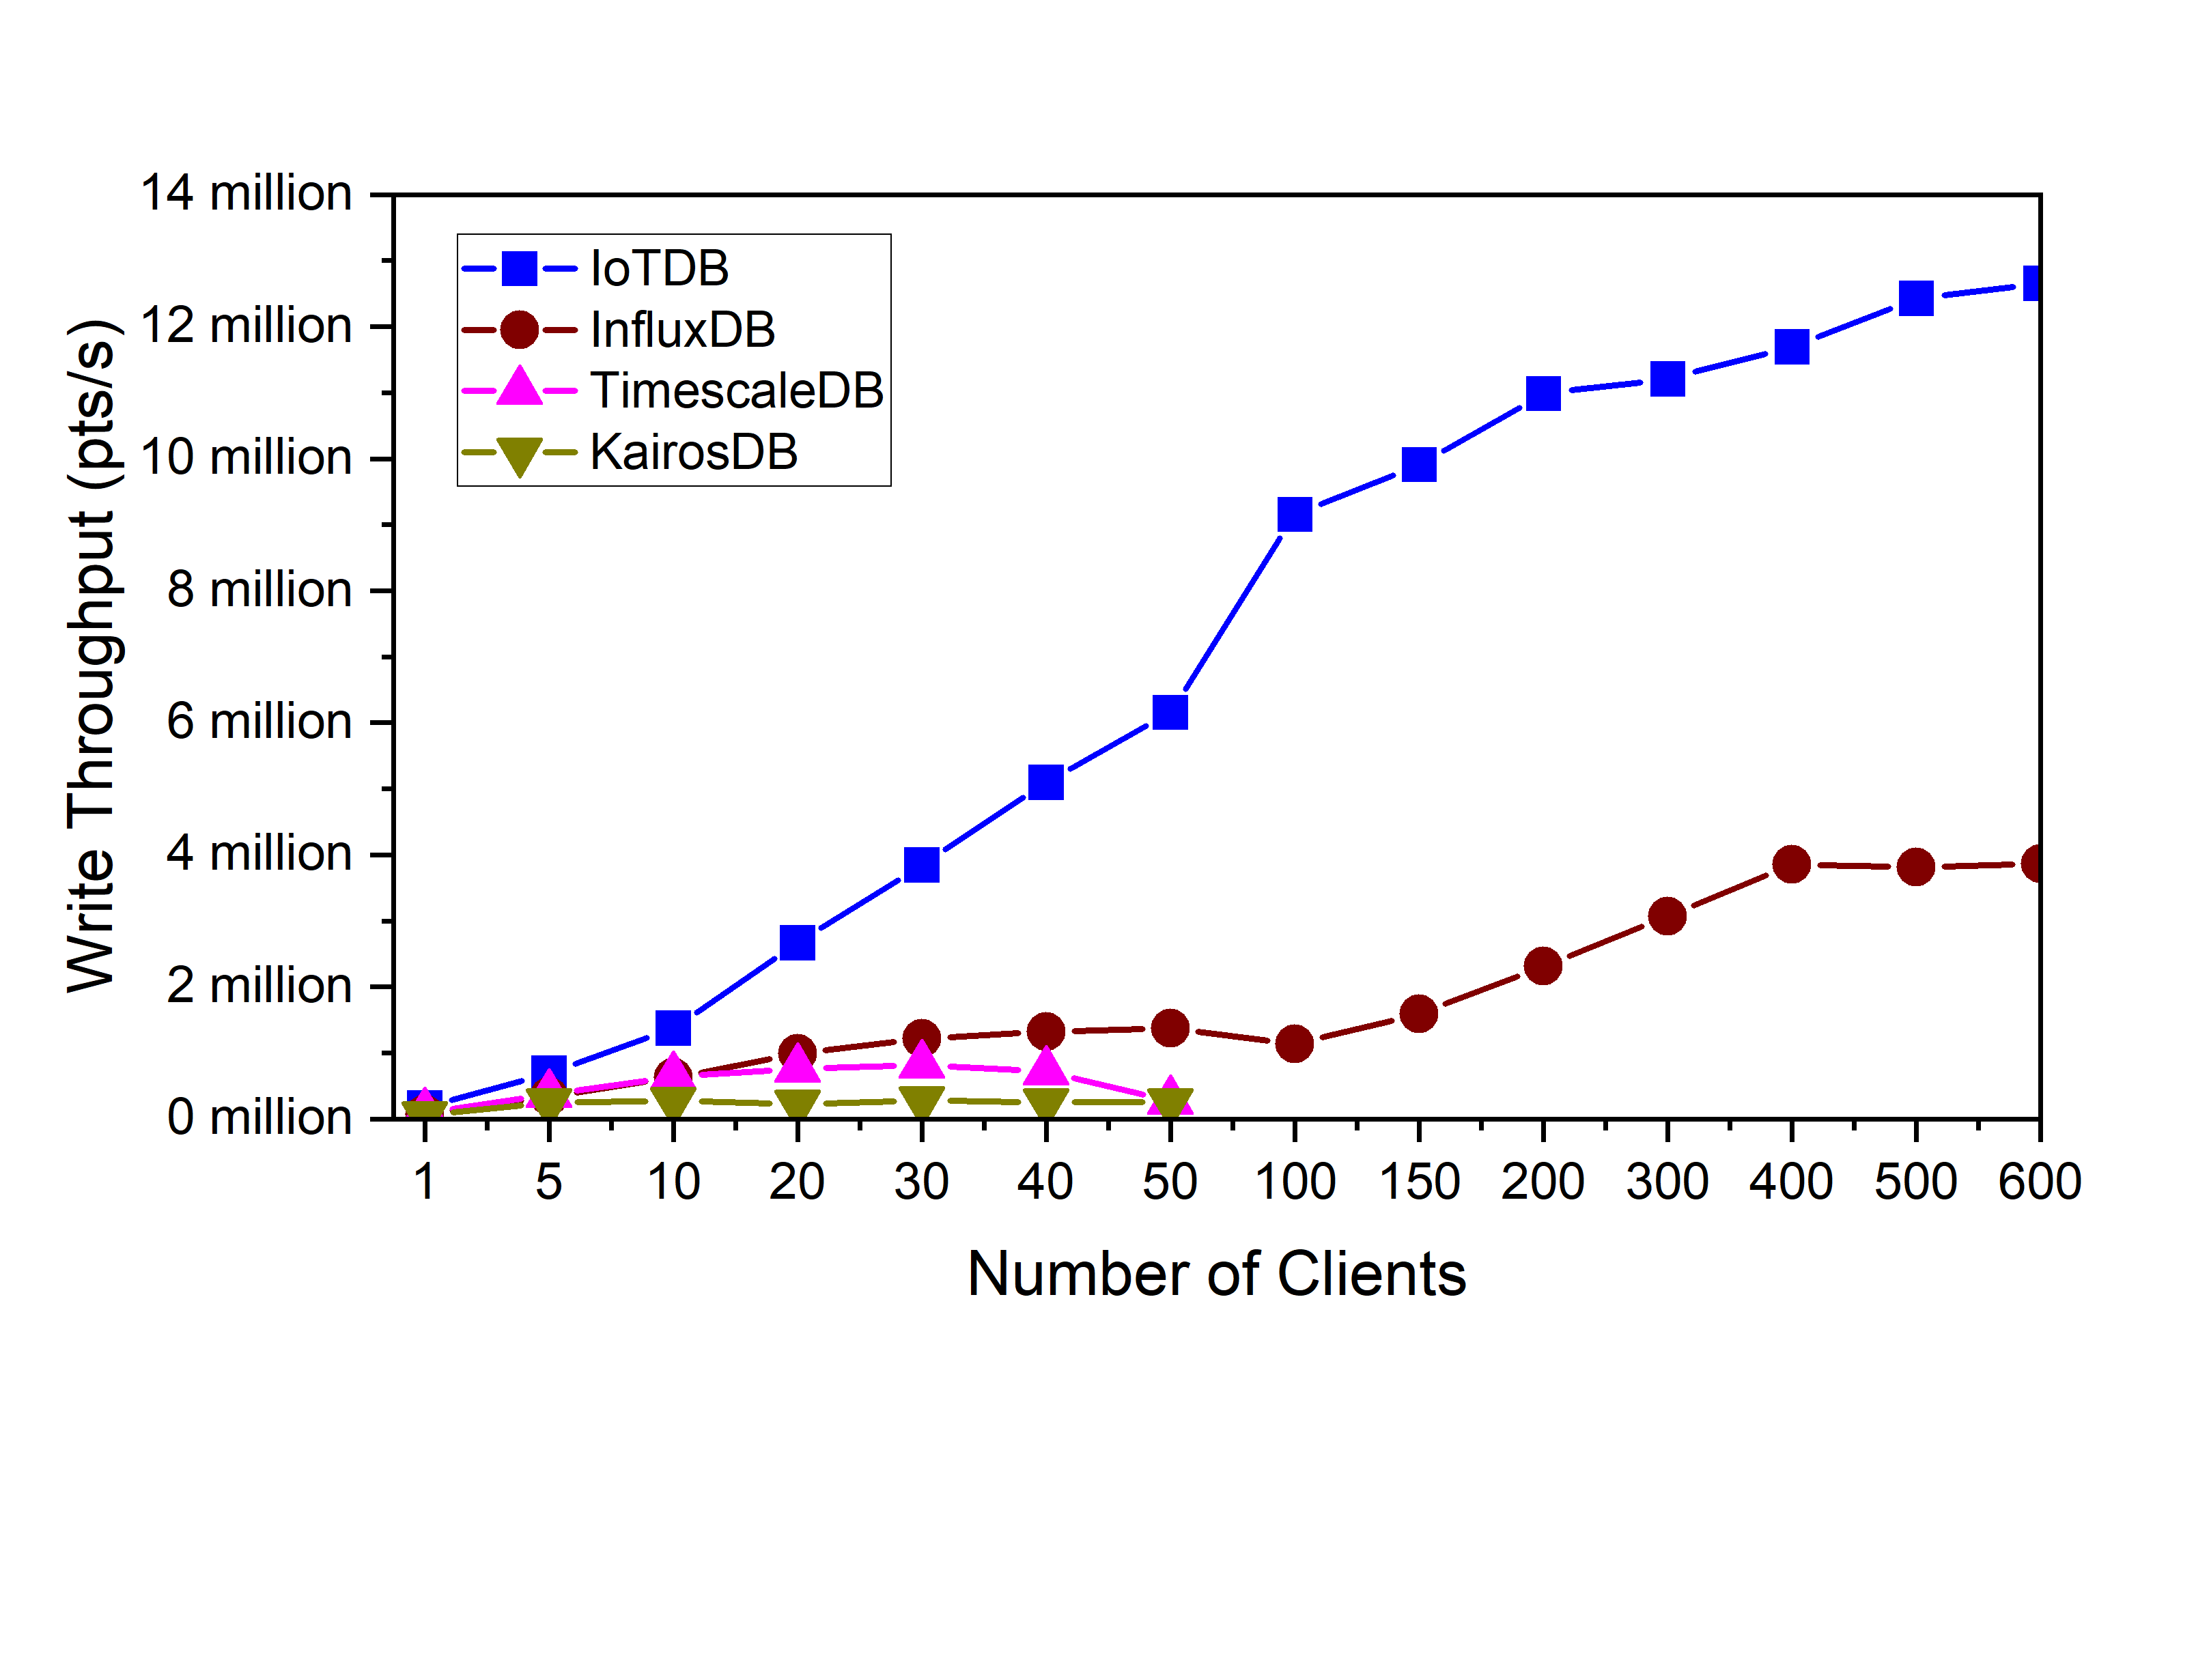
<center>Figure 3. Client Num with Write Throughput (points/second) IoTDB v0.11.1</center>
**Query performance**
-
+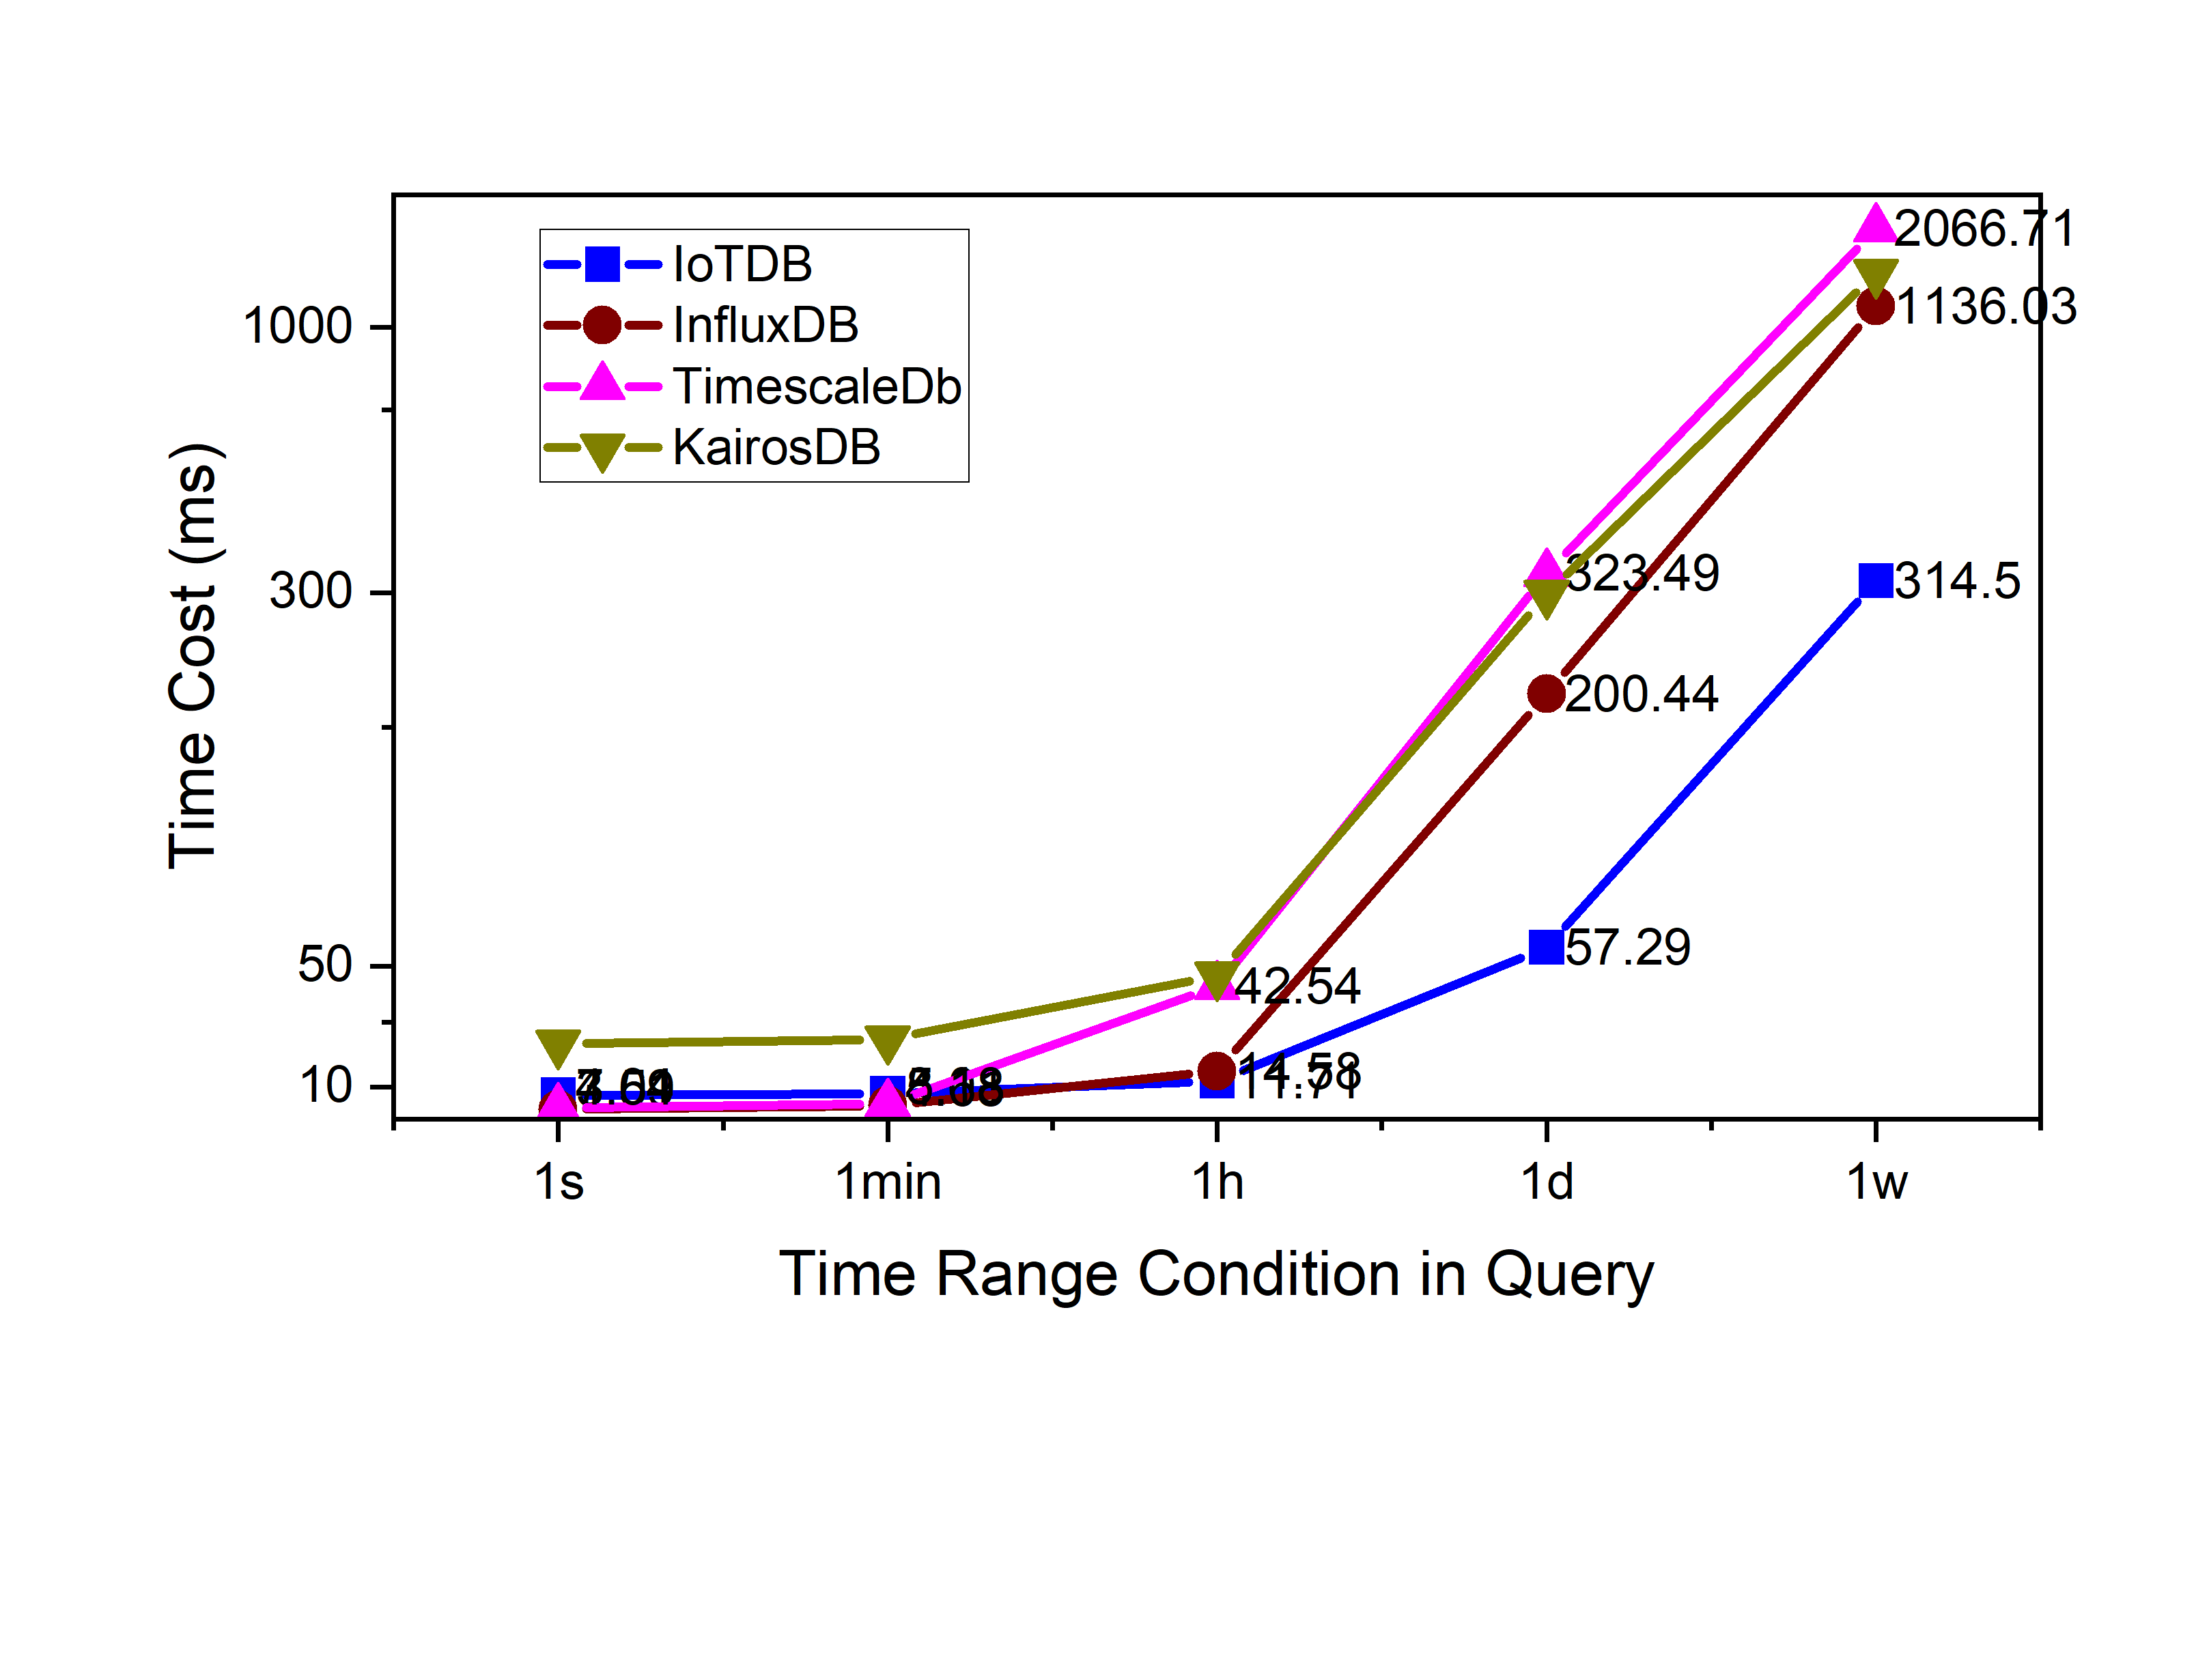
<center>Figure 4. Raw data query 1 col time cost(ms) IoTDB v0.11.1</center>
-
+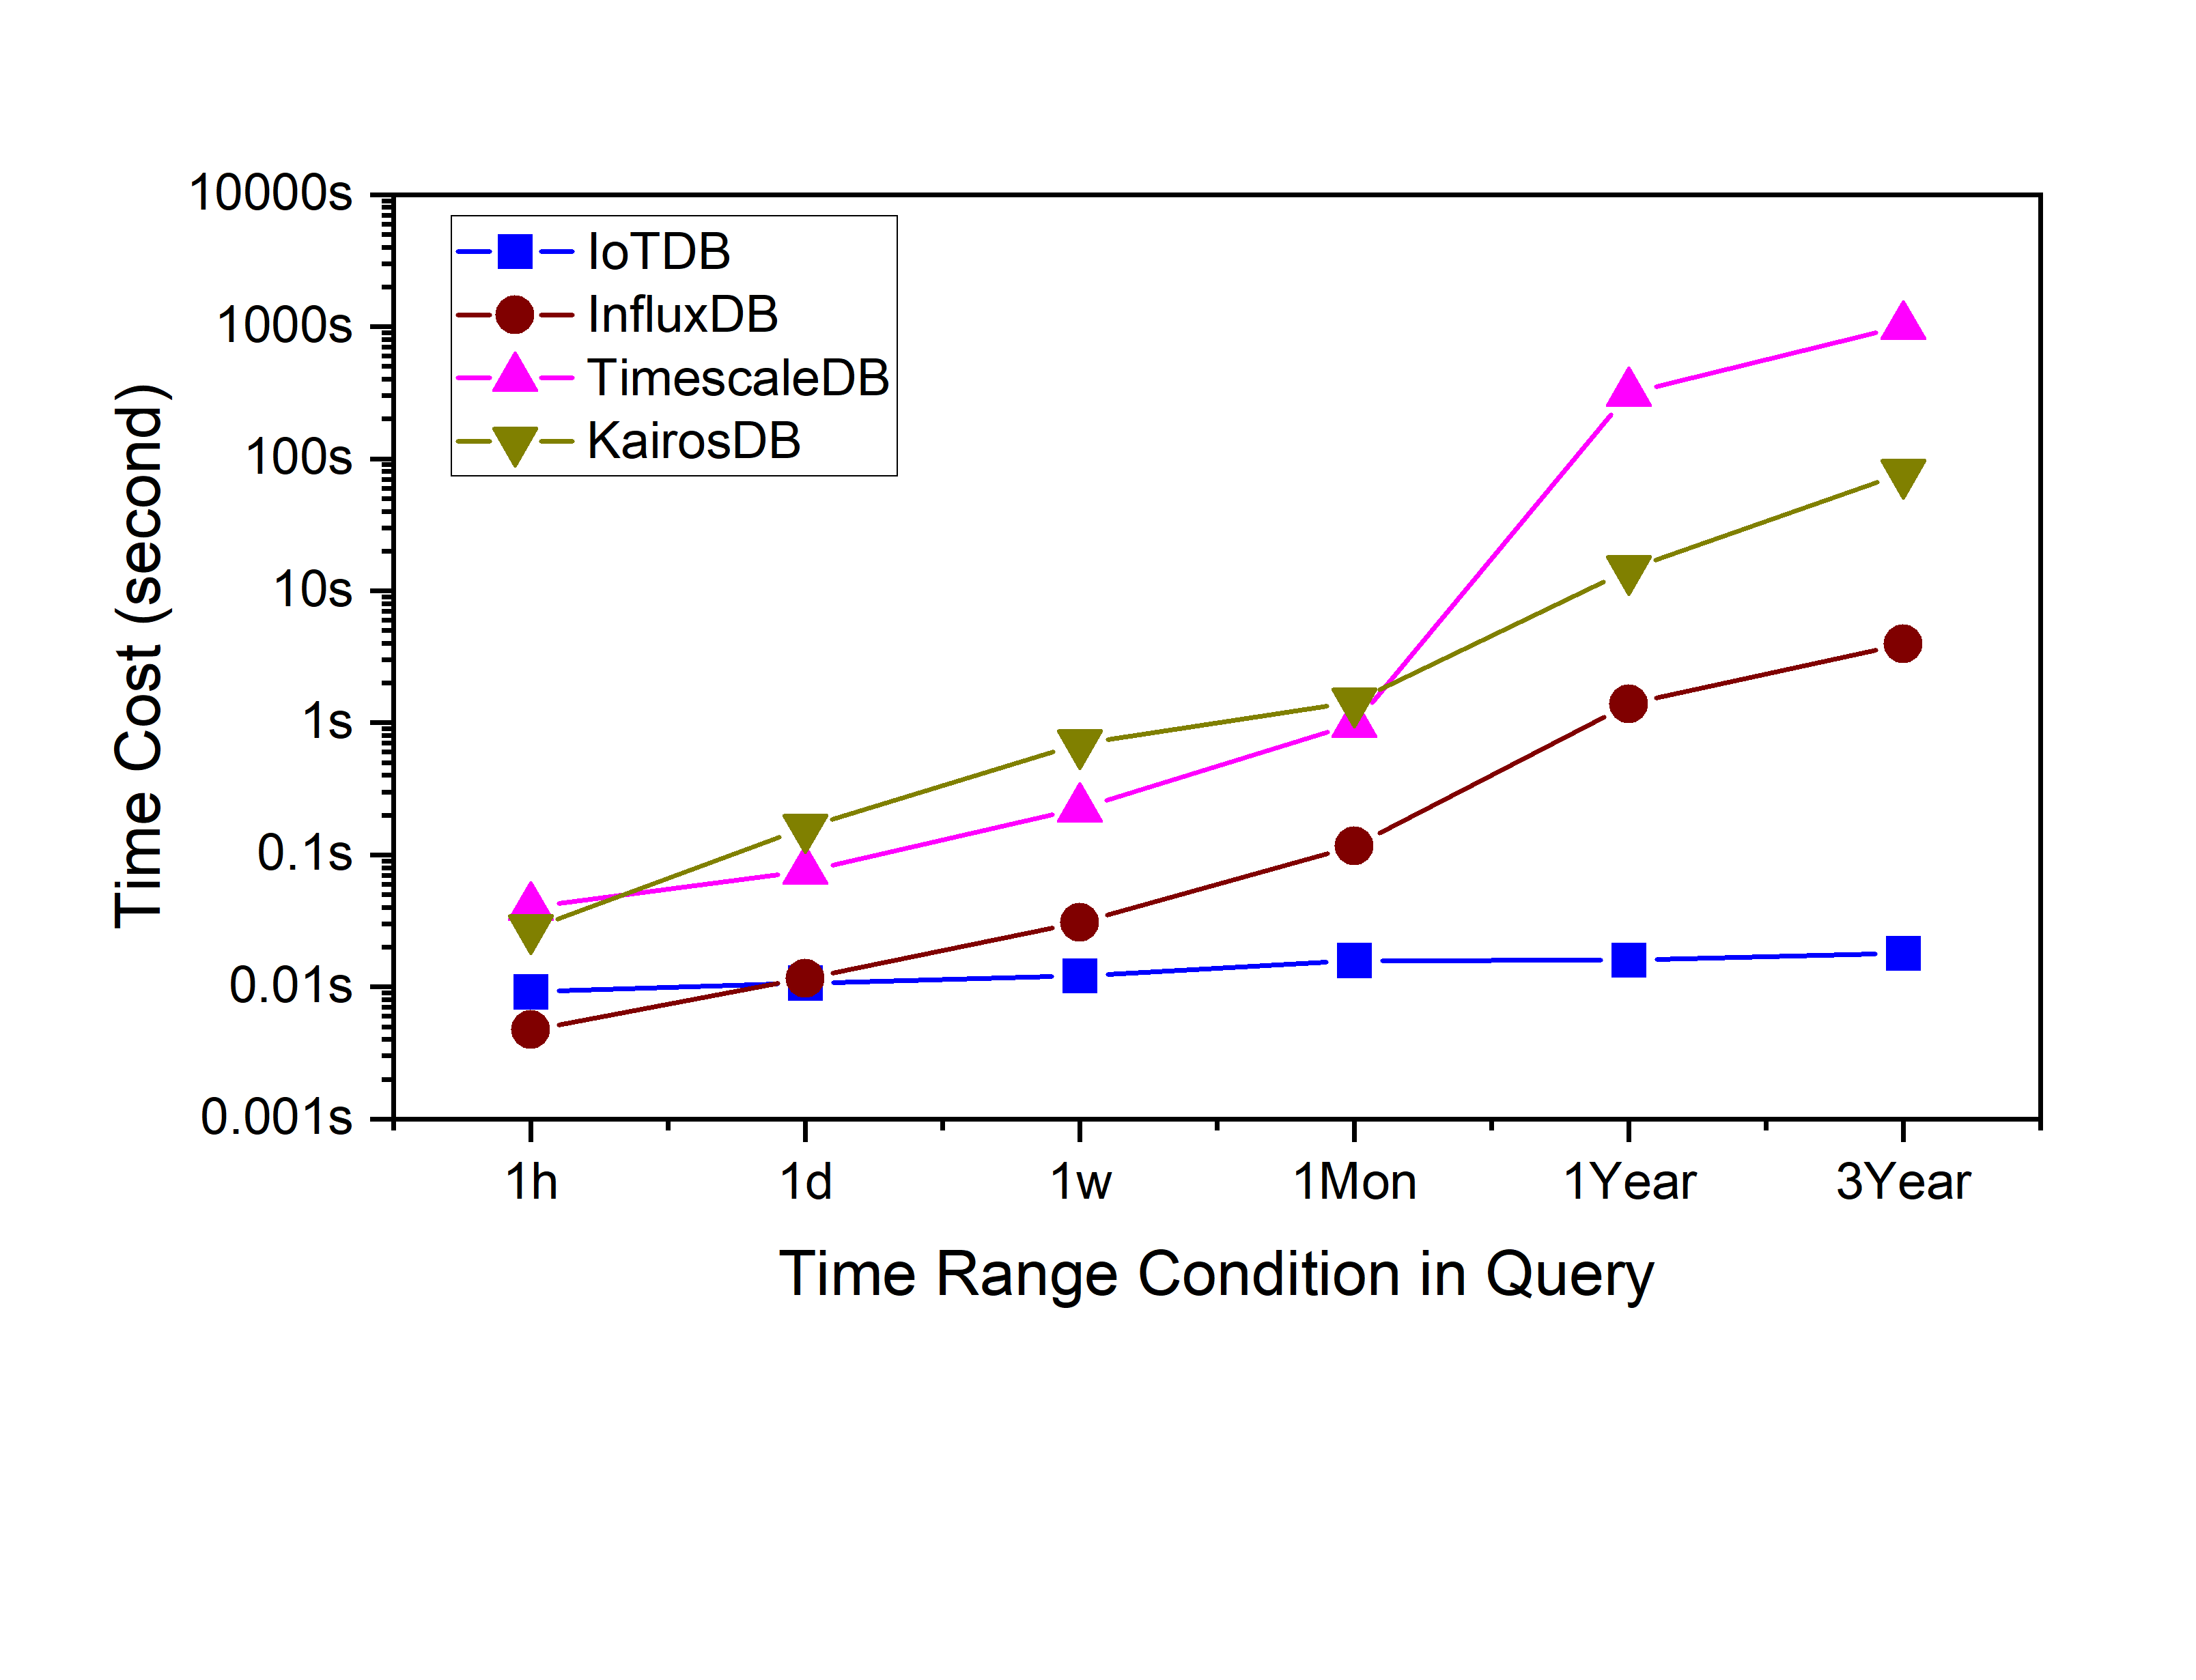
<center>Figure 5. Aggregation query time cost(ms) IoTDB v0.11.1</center>
-
+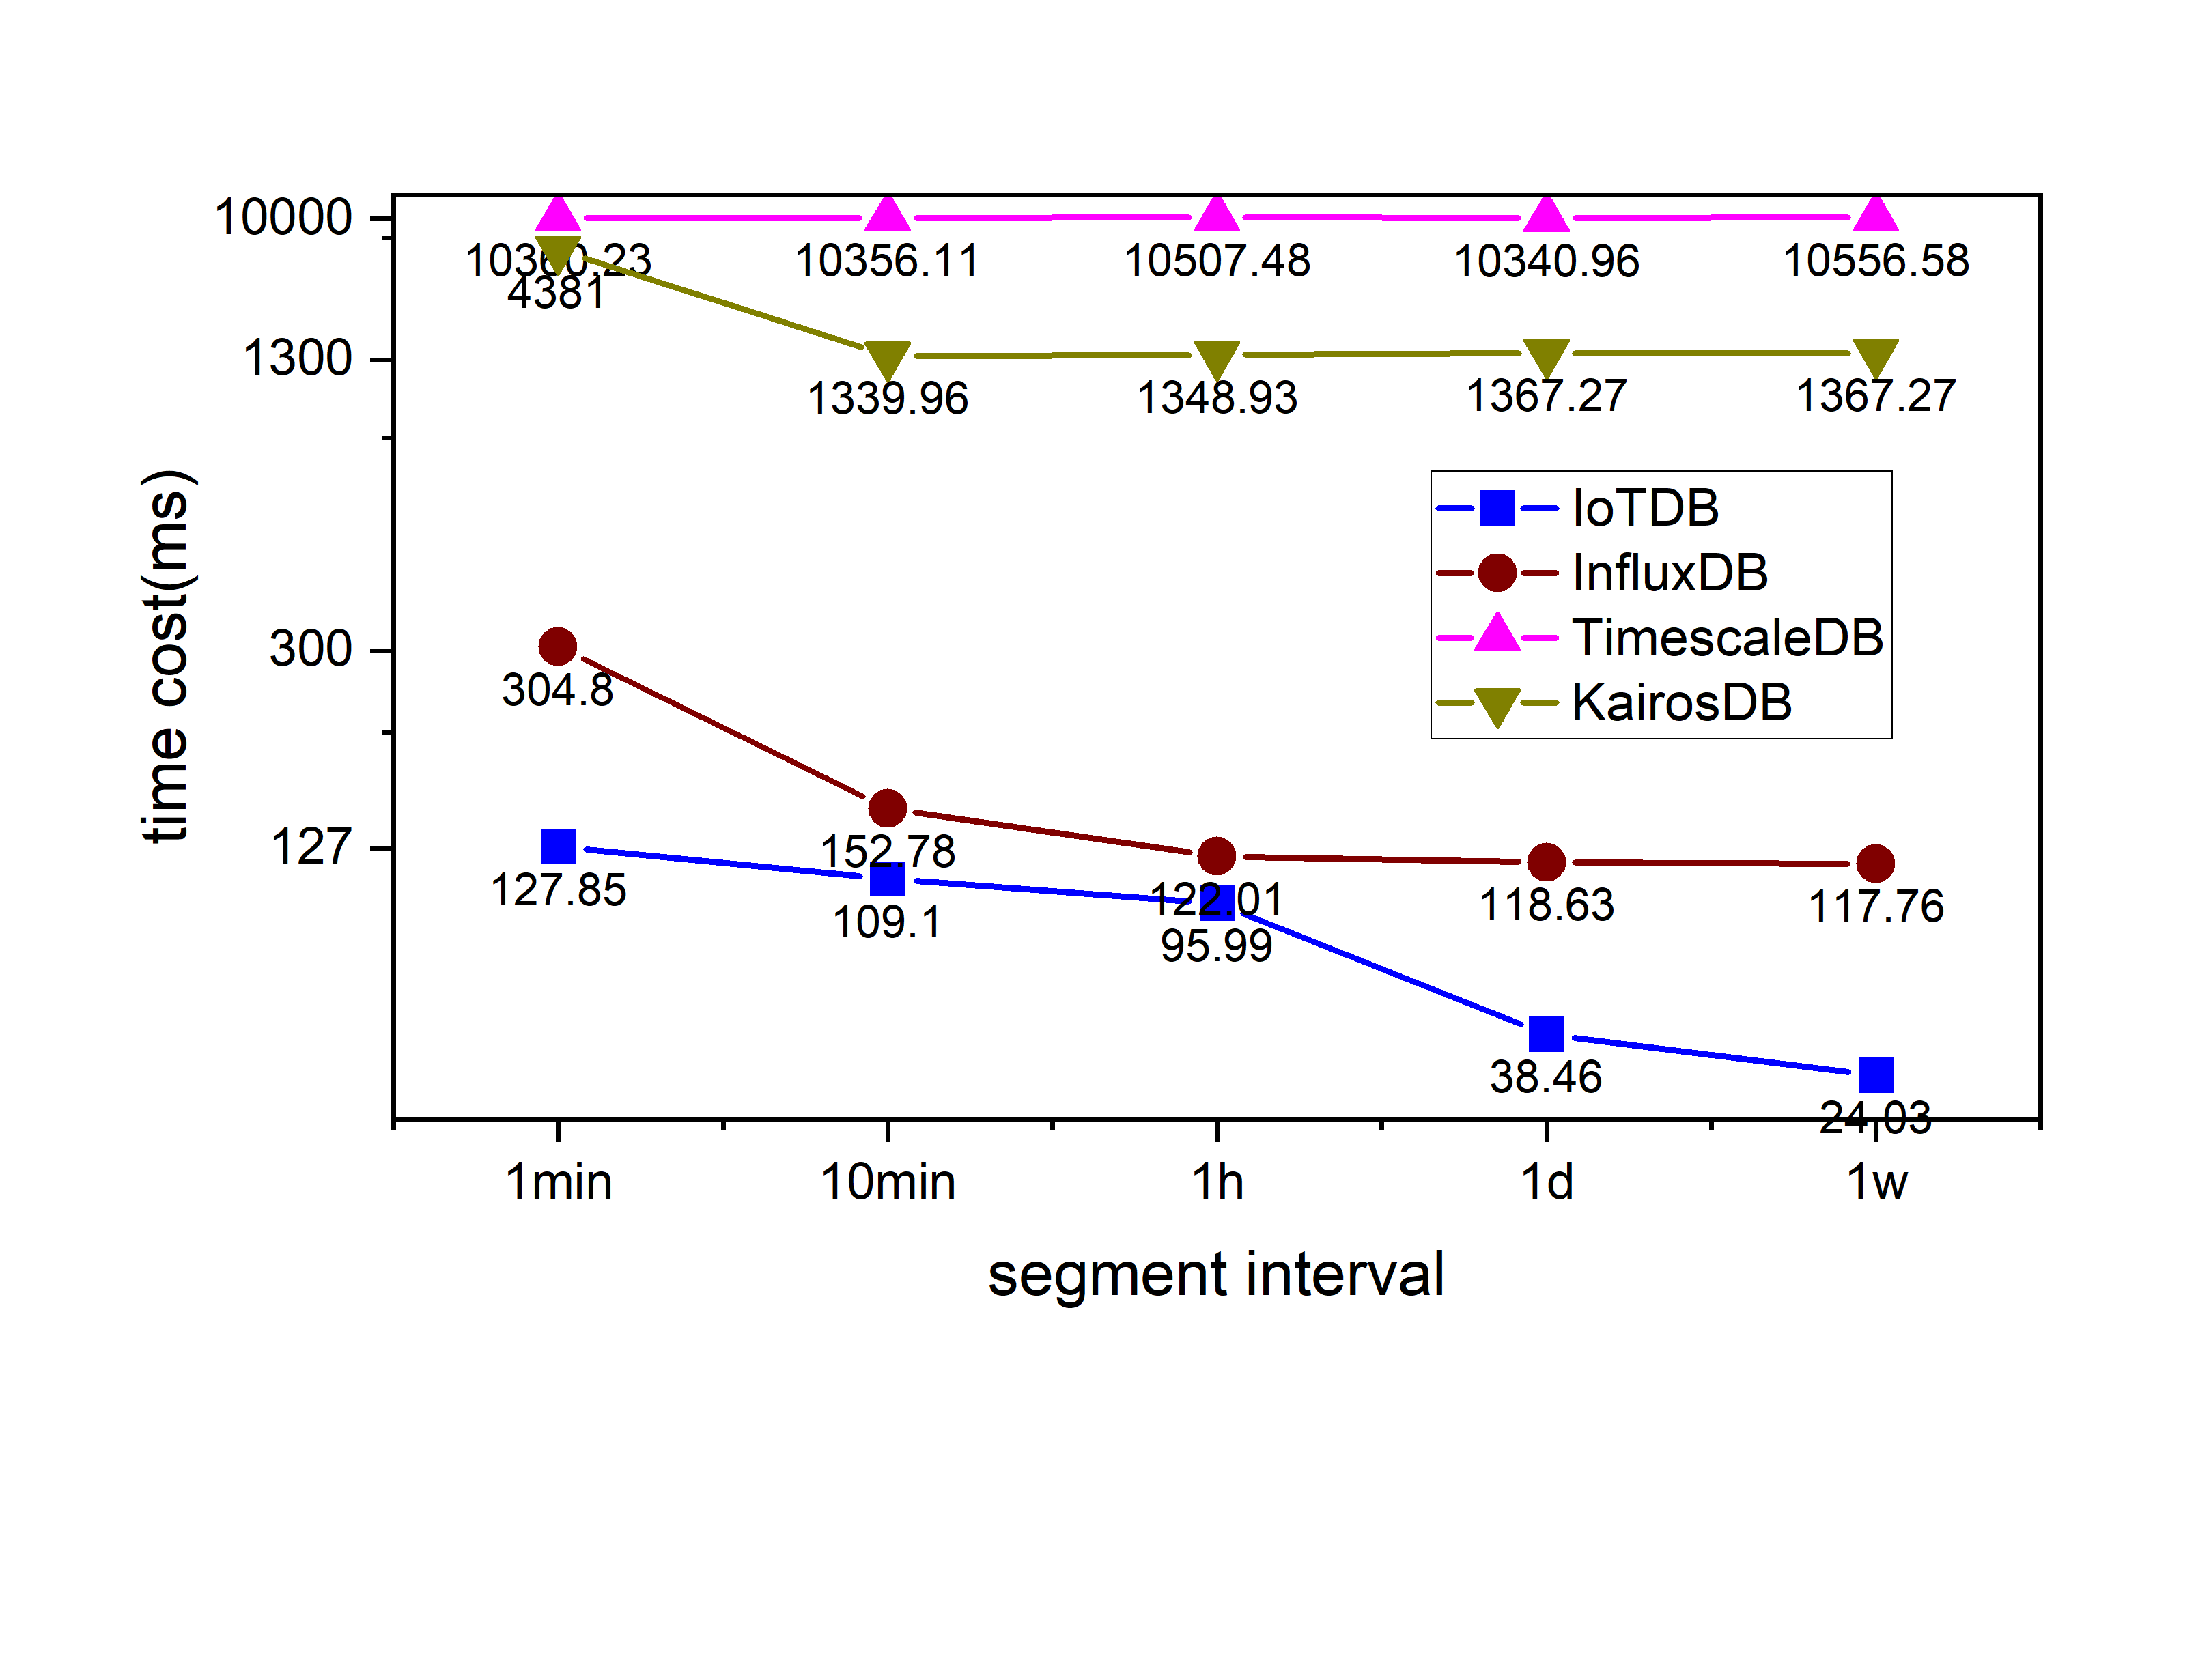
<center>Figure 6. Downsampling query time cost(ms) IoTDB v0.11.1</center>
-
+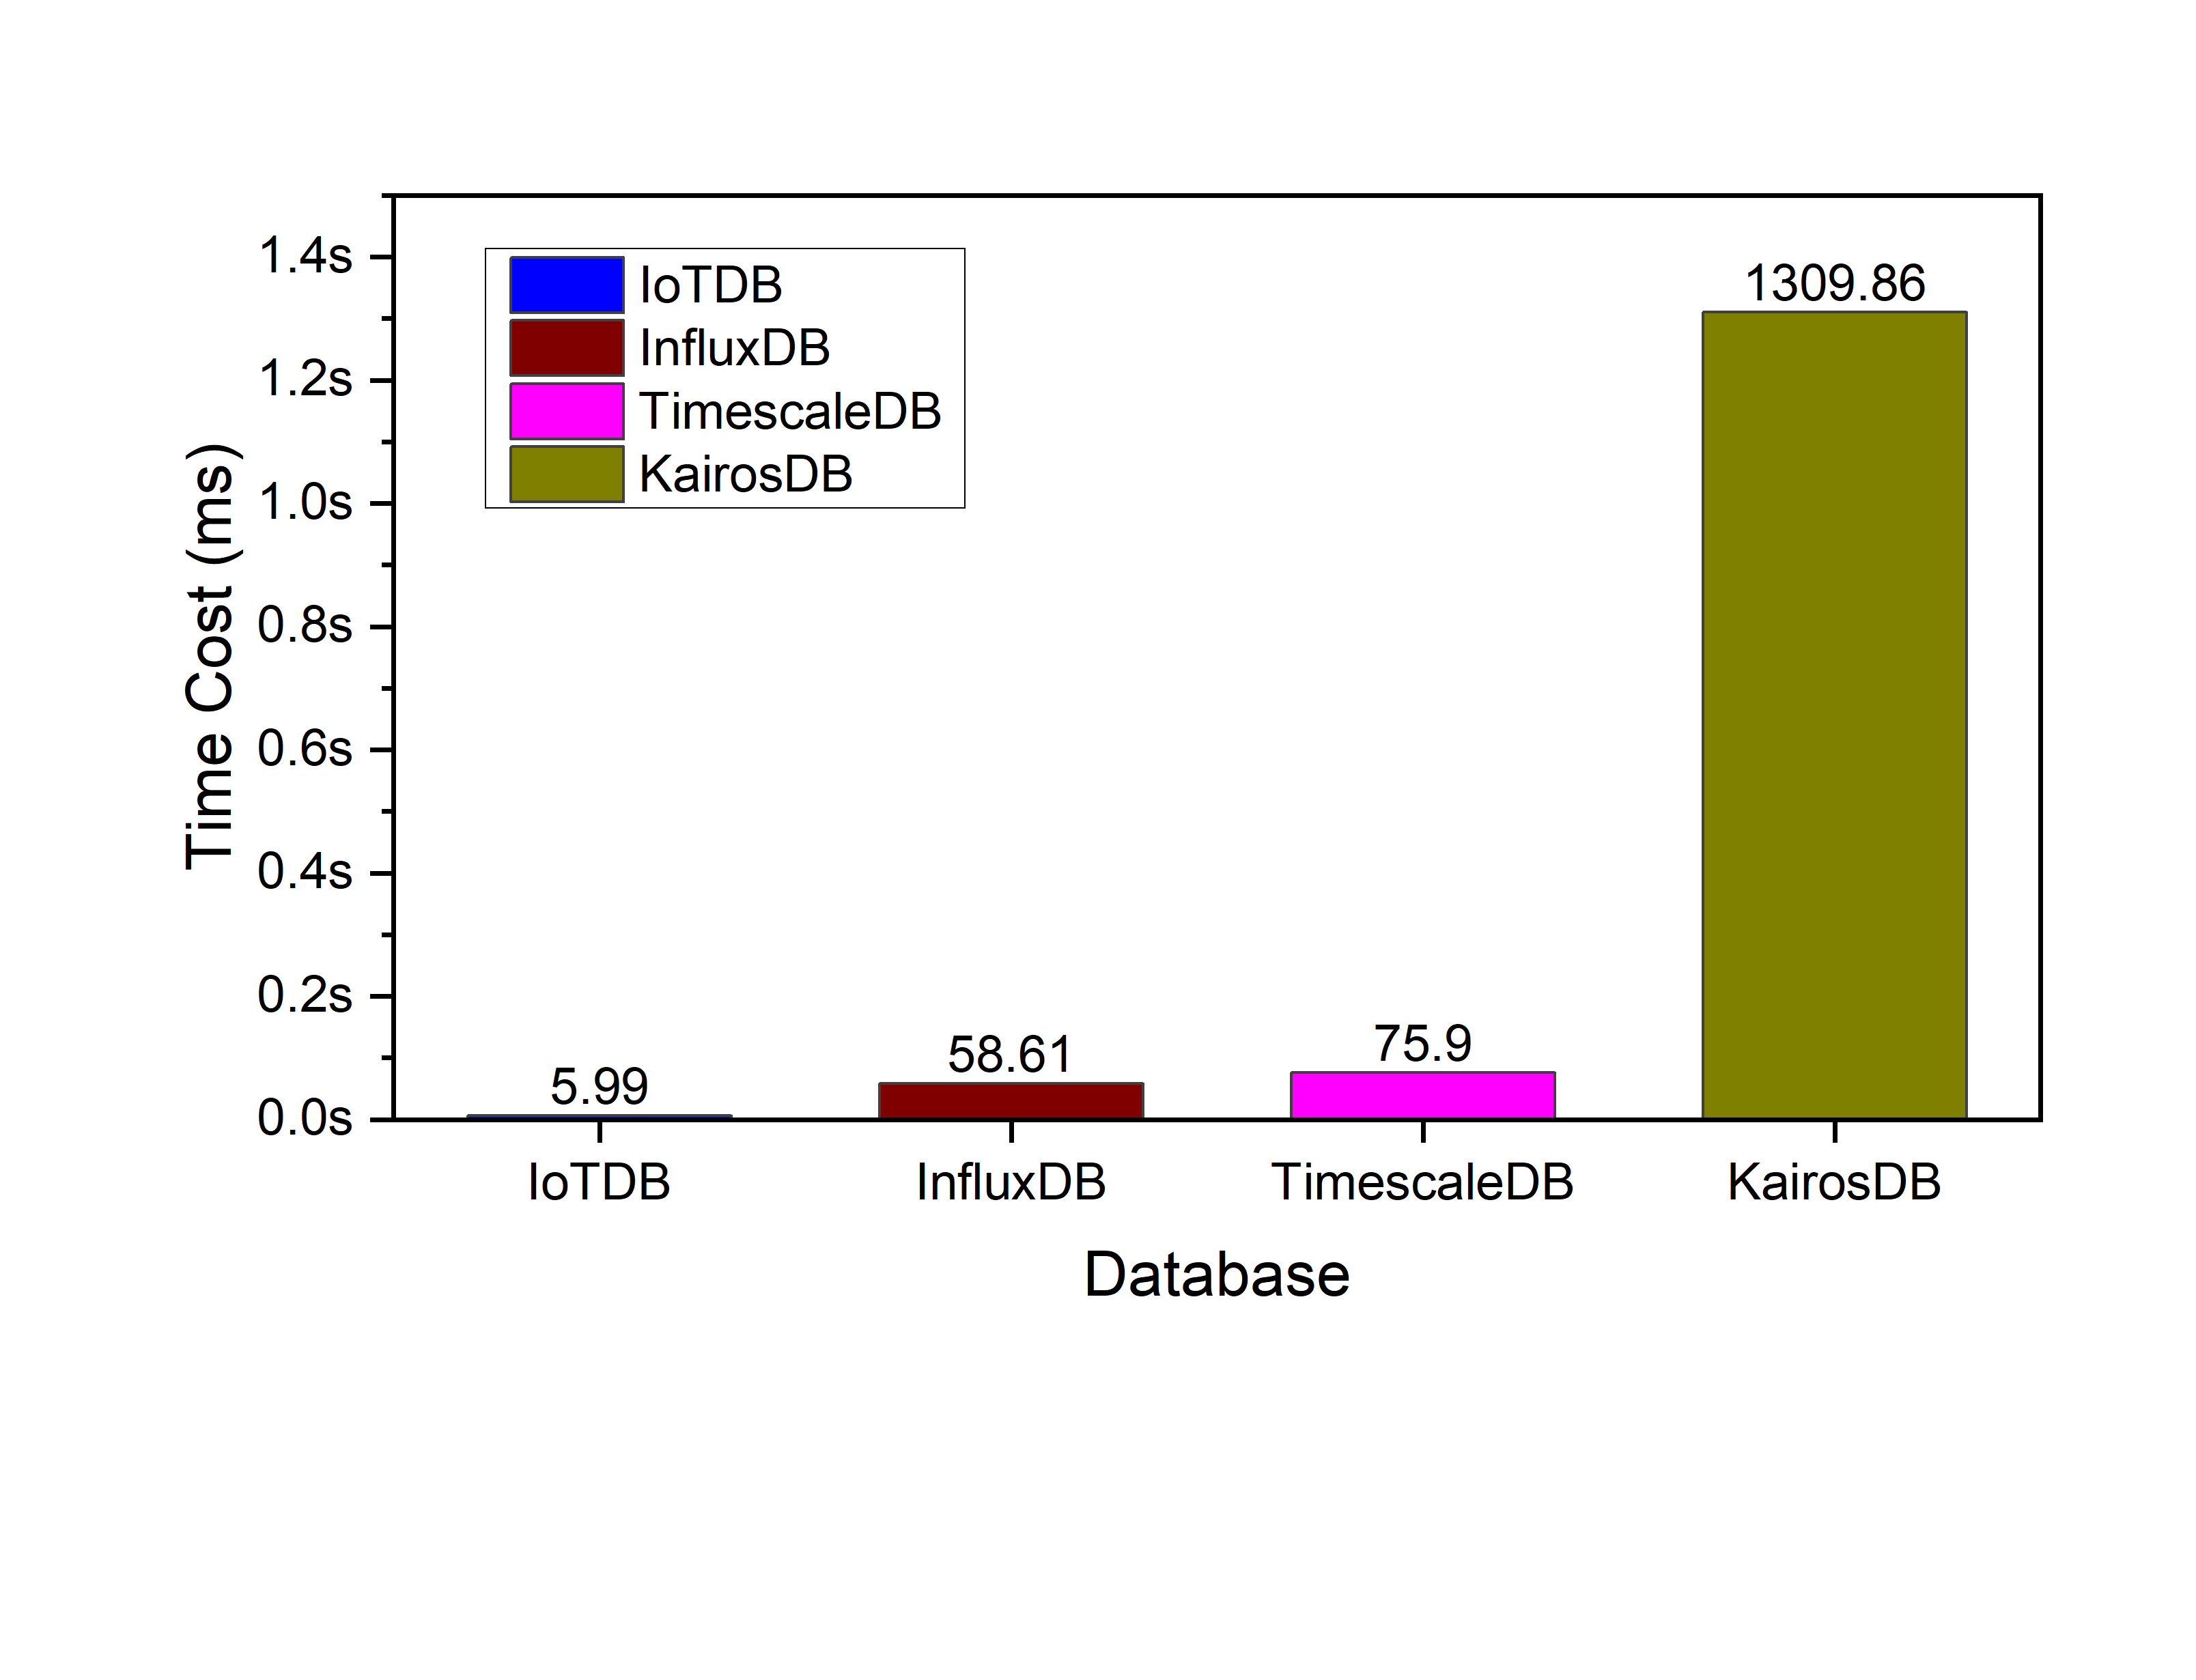
<center>Figure 7. Latest query time cost(ms) IoTDB v0.11.1</center>
-
+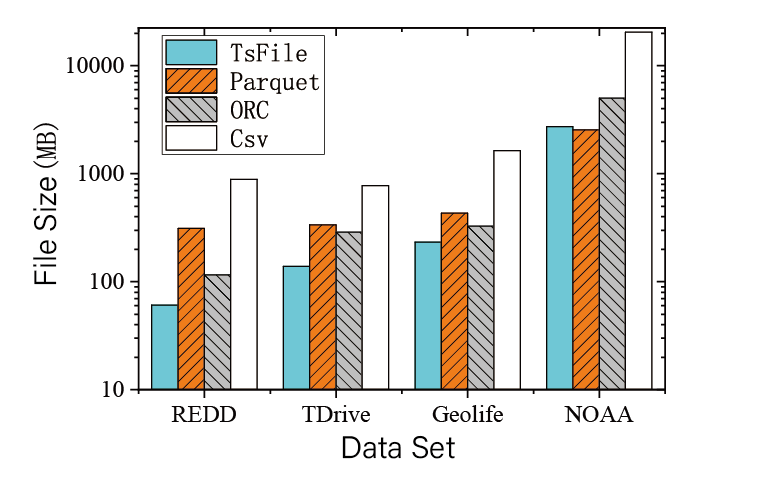
<center>Figure 8. Data compression IoTDB v0.11.1</center>
We can see that IoTDB outperforms others.
diff --git a/docs/zh/UserGuide/API/InfluxDB-Protocol.md b/docs/zh/UserGuide/API/InfluxDB-Protocol.md
index d7725a9507..989ddd4379 100644
--- a/docs/zh/UserGuide/API/InfluxDB-Protocol.md
+++ b/docs/zh/UserGuide/API/InfluxDB-Protocol.md
@@ -52,9 +52,9 @@ InfluxDB influxDB = IoTDBInfluxDBFactory.connect(openurl, username, password);
该适配器以 IoTDB Java ServiceProvider 接口为底层基础,实现了 InfluxDB 的 Java 接口 `interface InfluxDB`,对用户提供了所有 InfluxDB 的接口方法,最终用户可以无感知地使用 InfluxDB 协议向 IoTDB 发起写入和读取请求。
-
+
-
+
### 2.2 元数据格式转换
@@ -68,7 +68,7 @@ InfluxDB 的元数据是 tag-field 模型,IoTDB 的元数据是树形模型。
3. tags : 各种有索引的属性。
4. fields : 各种记录值(没有索引的属性)。
-
+
#### 2.2.2 IoTDB 元数据
@@ -76,7 +76,7 @@ InfluxDB 的元数据是 tag-field 模型,IoTDB 的元数据是树形模型。
2. path(time series ID):存储路径。
3. measurement: 物理量。
-
+
#### 2.2.3 两者映射关系
@@ -89,7 +89,7 @@ InfluxDB 元数据向 IoTDB 元数据的转换关系可以由下面的公示表
`root.{database}.{measurement}.{tag value 1}.{tag value 2}...{tag value N-1}.{tag value N}.{field key}`
-
+
如上图所示,可以看出:
diff --git a/docs/zh/UserGuide/API/Programming-MQTT.md b/docs/zh/UserGuide/API/Programming-MQTT.md
index 816a46c211..70f5069cd9 100644
--- a/docs/zh/UserGuide/API/Programming-MQTT.md
+++ b/docs/zh/UserGuide/API/Programming-MQTT.md
@@ -30,7 +30,7 @@
IoTDB 支持 MQTT v3.1(OASIS 标准)协议。
IoTDB 服务器包括内置的 MQTT 服务,该服务允许远程设备将消息直接发送到 IoTDB 服务器。
-<img style="width:100%; max-width:800px; max-height:600px; margin-left:auto; margin-right:auto; display:block;" src="/img/github/78357432-0c71cf80-75e4-11ea-98aa-c43a54d469ce.png">
+<img style="width:100%; max-width:800px; max-height:600px; margin-left:auto; margin-right:auto; display:block;" src="https://alioss.timecho.com/docs/img/github/78357432-0c71cf80-75e4-11ea-98aa-c43a54d469ce.png">
### 内置 MQTT 服务
内置的 MQTT 服务提供了通过 MQTT 直接连接到 IoTDB 的能力。 它侦听来自 MQTT 客户端的发布消息,然后立即将数据写入存储。
@@ -57,7 +57,7 @@ MQTT 主题与 IoTDB 时间序列相对应。
```
或者以上两者的JSON数组形式。
-<img style="width:100%; max-width:800px; max-height:600px; margin-left:auto; margin-right:auto; display:block;" src="/img/github/78357469-1bf11880-75e4-11ea-978f-a53996667a0d.png">
+<img style="width:100%; max-width:800px; max-height:600px; margin-left:auto; margin-right:auto; display:block;" src="https://alioss.timecho.com/docs/img/github/78357469-1bf11880-75e4-11ea-978f-a53996667a0d.png">
### MQTT 配置
默认情况下,IoTDB MQTT 服务从`${IOTDB_HOME}/${IOTDB_CONF}/iotdb-datanode.properties`加载配置。
diff --git a/docs/zh/UserGuide/API/Programming-Python-Native-API.md b/docs/zh/UserGuide/API/Programming-Python-Native-API.md
index 9f31cd832c..f5025f5d89 100644
--- a/docs/zh/UserGuide/API/Programming-Python-Native-API.md
+++ b/docs/zh/UserGuide/API/Programming-Python-Native-API.md
@@ -522,7 +522,7 @@ SQLAlchemy 中的元数据有:
下图更加清晰的展示了二者的映射关系:
-
+
##### 数据类型映射
| IoTDB 中的数据类型 | SQLAlchemy 中的数据类型 |
diff --git a/docs/zh/UserGuide/Cluster/Cluster-Concept.md b/docs/zh/UserGuide/Cluster/Cluster-Concept.md
index 340297d682..f503ae1542 100644
--- a/docs/zh/UserGuide/Cluster/Cluster-Concept.md
+++ b/docs/zh/UserGuide/Cluster/Cluster-Concept.md
@@ -28,7 +28,7 @@ Apache IoTDB 集群版包含两种角色的节点,ConfigNode 和 DataNode,
集群架构示例如下图:
-<img style="width:100%; max-width:500px; max-height:400px; margin-left:auto; margin-right:auto; display:block;" src="/img/UserGuide/Cluster/Architecture.png?raw=true">
+<img style="width:100%; max-width:500px; max-height:400px; margin-left:auto; margin-right:auto; display:block;" src="https://alioss.timecho.com/docs/img/UserGuide/Cluster/Architecture.png?raw=true">
ConfigNode 是集群的控制节点,管理集群的节点状态、分区信息等,集群所有 ConfigNode 组成一个高可用组,数据全量备份。
@@ -102,7 +102,7 @@ Region 是数据复制的基本单位,一个 Region 的多个副本构成了
完整的集群分区复制的示意图如下:
-<img style="width:100%; max-width:500px; max-height:500px; margin-left:auto; margin-right:auto; display:block;" src="/img/UserGuide/Cluster/Data-Partition.png?raw=true">
+<img style="width:100%; max-width:500px; max-height:500px; margin-left:auto; margin-right:auto; display:block;" src="https://alioss.timecho.com/docs/img/UserGuide/Cluster/Data-Partition.png?raw=true">
图中包含 1 个 SchemaRegionGroup,元数据采用 3 副本,因此 3 个白色的 SchemaRegion-0 组成了一个副本组。
diff --git a/docs/zh/UserGuide/Data-Concept/Data-Model-and-Terminology.md b/docs/zh/UserGuide/Data-Concept/Data-Model-and-Terminology.md
index 398918bc6b..63e3826594 100644
--- a/docs/zh/UserGuide/Data-Concept/Data-Model-and-Terminology.md
+++ b/docs/zh/UserGuide/Data-Concept/Data-Model-and-Terminology.md
@@ -25,7 +25,7 @@
根据企业组织结构和设备实体层次结构,我们将其物联网数据模型表示为如下图所示的属性层级组织结构,即电力集团层-风电场层-实体层-物理量层。其中 ROOT 为根节点,物理量层的每一个节点为叶子节点。IoTDB 采用树形结构定义数据模式,以从 ROOT 节点到叶子节点的路径来命名一个时间序列,层次间以“.”连接。例如,下图最左侧路径对应的时间序列名称为`ROOT.ln.wf01.wt01.status`。
-<img style="width:100%; max-width:800px; max-height:600px; margin-left:auto; margin-right:auto; display:block;" src="/img/github/123542457-5f511d00-d77c-11eb-8006-562d83069baa.png">
+<img style="width:100%; max-width:800px; max-height:600px; margin-left:auto; margin-right:auto; display:block;" src="https://alioss.timecho.com/docs/img/github/123542457-5f511d00-d77c-11eb-8006-562d83069baa.png">
在上图所描述的实际场景中,有许多实体所采集的物理量相同,即具有相同的工况名称和类型,因此,可以声明一个**元数据模板**来定义可采集的物理量集合。在实践中,元数据模板的使用可帮助减少元数据的资源占用,详细内容参见 [元数据模板文档](./Schema-Template.md)。
@@ -135,6 +135,6 @@ wildcard
插入数据时,对齐的时间序列中某列的某些行允许有空值。
-<img style="width:100%; max-width:800px; max-height:600px; margin-left:auto; margin-right:auto; display:block;" src="/img/github/114125919-f4850800-9929-11eb-8211-81d4c04af1ec.png">
+<img style="width:100%; max-width:800px; max-height:600px; margin-left:auto; margin-right:auto; display:block;" src="https://alioss.timecho.com/docs/img/github/114125919-f4850800-9929-11eb-8211-81d4c04af1ec.png">
在后续数据定义语言、数据操作语言和 Java 原生接口章节,将对涉及到对齐时间序列的各种操作进行逐一介绍。
diff --git a/docs/zh/UserGuide/Data-Concept/Schema-Template.md b/docs/zh/UserGuide/Data-Concept/Schema-Template.md
index 4a845b6895..da17074962 100644
--- a/docs/zh/UserGuide/Data-Concept/Schema-Template.md
+++ b/docs/zh/UserGuide/Data-Concept/Schema-Template.md
@@ -29,7 +29,7 @@
下图展示了一个燃油车场景的数据模型,各地区的多台燃油车的速度、油量、加速度、角速度四个物理量将会被采集,显然这些燃油车实体具备相同的物理量。
-<img style="width:100%; max-width:800px; max-height:600px; margin-left:auto; margin-right:auto; display:block;" src="/img/UserGuide/Data-Concept/Measurement-Template/example_without_template.png?raw=true" alt="example without template">
+<img style="width:100%; max-width:800px; max-height:600px; margin-left:auto; margin-right:auto; display:block;" src="https://alioss.timecho.com/docs/img/UserGuide/Data-Concept/Measurement-Template/example_without_template.png?raw=true" alt="example without template">
### 概念定义
@@ -45,7 +45,7 @@
使用元数据模板后,问题背景中示例的燃油车数据模型将会转变至下图所示的形式。所有的物理量元数据仅在模板中保存一份,所有的实体共享模板中的元数据。
-<img style="width:100%; max-width:800px; max-height:600px; margin-left:auto; margin-right:auto; display:block;" src="/img/UserGuide/Data-Concept/Measurement-Template/example_with_template.png?raw=true" alt="example with template">
+<img style="width:100%; max-width:800px; max-height:600px; margin-left:auto; margin-right:auto; display:block;" src="https://alioss.timecho.com/docs/img/UserGuide/Data-Concept/Measurement-Template/example_with_template.png?raw=true" alt="example with template">
#### 生命周期
@@ -60,7 +60,7 @@
最后需要补充的是,**对挂载模板与激活模板进行区分,是为了服务一种常见的场景**:在 Apache IoTDB 元数据模型 MTree 中,经常需要在数量众多的节点上“应用”元数据模板,而这些节点一般拥有共同的祖先节点。因此,可以在其共同祖先节点**挂载**模板,而不必对其大量的孩子节点进行挂载操作。对于需要“应用”模板的节点,则应该使用**激活模板**的操作。
-<img style="width:100%; max-width:800px; margin-left:auto; margin-right:auto; display:block;" src="/img/UserGuide/Data-Concept/Measurement-Template/example_template_lifetime_zh.png?raw=true" alt="example with template">
+<img style="width:100%; max-width:800px; margin-left:auto; margin-right:auto; display:block;" src="https://alioss.timecho.com/docs/img/UserGuide/Data-Concept/Measurement-Template/example_template_lifetime_zh.png?raw=true" alt="example with template">
### 使用
diff --git a/docs/zh/UserGuide/Data-Concept/Time-Partition.md b/docs/zh/UserGuide/Data-Concept/Time-Partition.md
index cfa12cc8ee..6904b96faf 100644
--- a/docs/zh/UserGuide/Data-Concept/Time-Partition.md
+++ b/docs/zh/UserGuide/Data-Concept/Time-Partition.md
@@ -38,7 +38,7 @@
开启时间分区功能,并设置 partition_interval 为 86400000(一天),则数据的分布情况如下图所示:
-<img style="width:100%; max-width:800px; max-height:600px; margin-left:auto; margin-right:auto; display:block;" src="/img/UserGuide/Data-Concept/Time-Partition/time_partition_example.png?raw=true" alt="time partition example">
+<img style="width:100%; max-width:800px; max-height:600px; margin-left:auto; margin-right:auto; display:block;" src="https://alioss.timecho.com/docs/img/UserGuide/Data-Concept/Time-Partition/time_partition_example.png?raw=true" alt="time partition example">
* 插入一条时间戳为 0 的数据,计算 0 / 86400000 = 0,则该数据会被存储到 0 号文件夹下的TsFile中
diff --git a/docs/zh/UserGuide/Ecosystem-Integration/DBeaver.md b/docs/zh/UserGuide/Ecosystem-Integration/DBeaver.md
index 65cd7799a9..5a5a721cd3 100644
--- a/docs/zh/UserGuide/Ecosystem-Integration/DBeaver.md
+++ b/docs/zh/UserGuide/Ecosystem-Integration/DBeaver.md
@@ -46,10 +46,10 @@ DBeaver 是一个 SQL 客户端和数据库管理工具。DBeaver 可以使用 I
3. 打开 Driver Manager
- 
+ 
4. 为 IoTDB 新建一个驱动类型
- 
+ 
5. 下载[源代码](https://iotdb.apache.org/zh/Download/),解压并运行下面的命令编译 jdbc 驱动
@@ -58,15 +58,15 @@ DBeaver 是一个 SQL 客户端和数据库管理工具。DBeaver 可以使用 I
```
7. 在`jdbc/target/`下找到并添加名为`apache-iotdb-jdbc-{version}-jar-with-dependencies.jar`的库,点击 `Find Class`。
- 
+ 
8. 编辑驱动设置
- 
+ 
9. 新建 DataBase Connection, 选择 iotdb
- 
+ 
10. 编辑 JDBC 连接设置
@@ -75,12 +75,12 @@ DBeaver 是一个 SQL 客户端和数据库管理工具。DBeaver 可以使用 I
Username: root
Password: root
```
- 
+ 
11. 测试连接
- 
+ 
12. 可以开始通过 DBeaver 使用 IoTDB
- 
+ 
diff --git a/docs/zh/UserGuide/Ecosystem-Integration/Grafana-Connector.md b/docs/zh/UserGuide/Ecosystem-Integration/Grafana-Connector.md
index c18f9d6d85..953f3bfa54 100644
--- a/docs/zh/UserGuide/Ecosystem-Integration/Grafana-Connector.md
+++ b/docs/zh/UserGuide/Ecosystem-Integration/Grafana-Connector.md
@@ -131,16 +131,16 @@ Grafana 以网页的 dashboard 形式为您展示数据,在使用时请您打
#### 添加 IoTDB 数据源
点击左上角的“Grafana”图标,选择`Data Source`选项,然后再点击`Add data source`。
-<img style="width:100%; max-width:800px; max-height:600px; margin-left:auto; margin-right:auto; display:block;" src="/img/github/51664777-2766ae00-1ff5-11e9-9d2f-7489f8ccbfc2.png">
+<img style="width:100%; max-width:800px; max-height:600px; margin-left:auto; margin-right:auto; display:block;" src="https://alioss.timecho.com/docs/img/github/51664777-2766ae00-1ff5-11e9-9d2f-7489f8ccbfc2.png">
在编辑数据源的时候,`Type`一栏选择`Simplejson`,`URL`一栏填写 http://\<ip\>:\<port\>,IP 为您的 IoTDB-Grafana-Connector 连接器所在的服务器 IP,Port 为运行端口(默认 8888)。之后确保 IoTDB 已经启动,点击“Save & Test”,出现“Data Source is working”提示表示配置成功。
-<img style="width:100%; max-width:800px; max-height:600px; margin-left:auto; margin-right:auto; display:block;" src="/img/github/51664842-554bf280-1ff5-11e9-97d2-54eebe0b2ca1.png">
+<img style="width:100%; max-width:800px; max-height:600px; margin-left:auto; margin-right:auto; display:block;" src="https://alioss.timecho.com/docs/img/github/51664842-554bf280-1ff5-11e9-97d2-54eebe0b2ca1.png">
#### 操作 Grafana
进入 Grafana 可视化页面后,可以选择添加时间序列,如下图。您也可以按照 Grafana 官方文档进行相应的操作,详情可参看 Grafana 官方文档:http://docs.grafana.org/guides/getting_started/。
-<img style="width:100%; max-width:800px; max-height:600px; margin-left:auto; margin-right:auto; display:block;" src="/img/github/51664878-6e54a380-1ff5-11e9-9718-4d0e24627fa8.png">
+<img style="width:100%; max-width:800px; max-height:600px; margin-left:auto; margin-right:auto; display:block;" src="https://alioss.timecho.com/docs/img/github/51664878-6e54a380-1ff5-11e9-9718-4d0e24627fa8.png">
### 配置 grafana
diff --git a/docs/zh/UserGuide/Ecosystem-Integration/Grafana-Plugin.md b/docs/zh/UserGuide/Ecosystem-Integration/Grafana-Plugin.md
index a9edfa7ede..ba333a7891 100644
--- a/docs/zh/UserGuide/Ecosystem-Integration/Grafana-Plugin.md
+++ b/docs/zh/UserGuide/Ecosystem-Integration/Grafana-Plugin.md
@@ -83,7 +83,7 @@ go get: module github.com/grafana/grafana-plugin-sdk-go: Get "https://proxy.gola
如果编译成功,我们将看到生成的目标文件夹 `dist`,它包含了编译好的 Grafana 前端插件:
-<img style="width:100%; max-width:333px; max-height:545px; margin-left:auto; margin-right:auto; display:block;" src="/img/UserGuide/Ecosystem-Integration/Grafana-plugin/grafana-plugin-build.png?raw=true">
+<img style="width:100%; max-width:333px; max-height:545px; margin-left:auto; margin-right:auto; display:block;" src="https://alioss.timecho.com/docs/img/UserGuide/Ecosystem-Integration/Grafana-plugin/grafana-plugin-build.png?raw=true">
###### 方案三 IoTDB 的分发包完整编译
@@ -108,7 +108,7 @@ git clone https://github.com/apache/iotdb.git
如果编译成功,我们将看到 `distribution/target` 路径下包含了编译好的 Grafana 前端插件:
-<img style="width:100%; max-width:333px; max-height:545px; margin-left:auto; margin-right:auto; display:block;" src="/img/UserGuide/Ecosystem-Integration/Grafana-plugin/distribution.png?raw=true">
+<img style="width:100%; max-width:333px; max-height:545px; margin-left:auto; margin-right:auto; display:block;" src="https://alioss.timecho.com/docs/img/UserGuide/Ecosystem-Integration/Grafana-plugin/distribution.png?raw=true">
@@ -187,9 +187,9 @@ Grafana 以网页的 dashboard 形式为您展示数据,在使用时请您打
点击左侧的 `设置` 图标,选择 `Data Source` 选项,然后再点击 `Add data source`。
-<img style="width:100%; max-width:800px; max-height:600px; margin-left:auto; margin-right:auto; display:block;" src="/img/UserGuide/Ecosystem-Integration/Grafana-plugin/datasource_1.png?raw=true">
+<img style="width:100%; max-width:800px; max-height:600px; margin-left:auto; margin-right:auto; display:block;" src="https://alioss.timecho.com/docs/img/UserGuide/Ecosystem-Integration/Grafana-plugin/datasource_1.png?raw=true">
-<img style="width:100%; max-width:800px; max-height:600px; margin-left:auto; margin-right:auto; display:block;" src="/img/UserGuide/Ecosystem-Integration/Grafana-plugin/datasource_2.png?raw=true">
+<img style="width:100%; max-width:800px; max-height:600px; margin-left:auto; margin-right:auto; display:block;" src="https://alioss.timecho.com/docs/img/UserGuide/Ecosystem-Integration/Grafana-plugin/datasource_2.png?raw=true">
选择 `Apache IoTDB` 数据源,`URL` 一栏填写 `http://<ip>:<port>`。
@@ -197,7 +197,7 @@ Ip 为您的 IoTDB 服务器所在的宿主机 IP,port 为 REST 服务的运
输入 IoTDB 服务器的 username 和 password,点击 `Save & Test`,出现 `Success` 则提示配置成功。
-<img style="width:100%; max-width:800px; max-height:600px; margin-left:auto; margin-right:auto; display:block;" src="/img/UserGuide/Ecosystem-Integration/Grafana-plugin/datasource_3.png?raw=true">
+<img style="width:100%; max-width:800px; max-height:600px; margin-left:auto; margin-right:auto; display:block;" src="https://alioss.timecho.com/docs/img/UserGuide/Ecosystem-Integration/Grafana-plugin/datasource_3.png?raw=true">
@@ -205,15 +205,15 @@ Ip 为您的 IoTDB 服务器所在的宿主机 IP,port 为 REST 服务的运
点击左侧的 `Dashboards` 图标,选择 `Manage`,如下图所示:
-<img style="width:100%; max-width:800px; max-height:600px; margin-left:auto; margin-right:auto; display:block;" src="/img/UserGuide/Ecosystem-Integration/Grafana-plugin/manage.png?raw=true">
+<img style="width:100%; max-width:800px; max-height:600px; margin-left:auto; margin-right:auto; display:block;" src="https://alioss.timecho.com/docs/img/UserGuide/Ecosystem-Integration/Grafana-plugin/manage.png?raw=true">
点击右上方的 `New Dashboard` 图标,选择 `Add an empty panel`,如下图所示:
-<img style="width:100%; max-width:800px; max-height:600px; margin-left:auto; margin-right:auto; display:block;" src="/img/UserGuide/Ecosystem-Integration/Grafana-plugin/add-empty-panel.png?raw=true">
+<img style="width:100%; max-width:800px; max-height:600px; margin-left:auto; margin-right:auto; display:block;" src="https://alioss.timecho.com/docs/img/UserGuide/Ecosystem-Integration/Grafana-plugin/add-empty-panel.png?raw=true">
Grafana Plugin 支持SQL: Full Customized和SQL: Drop-down List 两种方式,默认是SQL: Full Customized方式。
-<img style="width:100%; max-width:800px; max-height:600px; margin-left:auto; margin-right:auto; display:block;" src="/img/UserGuide/Ecosystem-Integration/Grafana-plugin/grafana_input_style.png?raw=true">
+<img style="width:100%; max-width:800px; max-height:600px; margin-left:auto; margin-right:auto; display:block;" src="https://alioss.timecho.com/docs/img/UserGuide/Ecosystem-Integration/Grafana-plugin/grafana_input_style.png?raw=true">
###### SQL: Full Customized 输入方式
@@ -221,7 +221,7 @@ Grafana Plugin 支持SQL: Full Customized和SQL: Drop-down List 两种方式,
如果一个查询涉及多个表达式,我们可以点击 SELECT 输入框右侧的 `+` 来添加 SELECT 子句中的表达式,也可以点击 FROM 输入框右侧的 `+` 来添加路径前缀,如下图所示:
-<img style="width:100%; max-width:800px; max-height:600px; margin-left:auto; margin-right:auto; display:block;" src="/img/UserGuide/Ecosystem-Integration/Grafana-plugin/grafana_input.png?raw=true">
+<img style="width:100%; max-width:800px; max-height:600px; margin-left:auto; margin-right:auto; display:block;" src="https://alioss.timecho.com/docs/img/UserGuide/Ecosystem-Integration/Grafana-plugin/grafana_input.png?raw=true">
SELECT 输入框中的内容可以是时间序列的后缀,可以是函数或自定义函数,可以是算数表达式,也可以是它们的嵌套表达式。您还可以使用 as 子句来重命名需要显示的结果序列名字。
@@ -254,7 +254,7 @@ CONTROL 输入框为非必须填写项目,填写内容应当是控制查询类
###### SQL: Drop-down List 输入方式
在 TIME-SERIES 选择框中选择一条时间序列、FUNCTION 选择一个函数、SAMPLING INTERVAL、SLIDING STEP、LEVEL、FILL 输入框中输入内容,其中 TIME-SERIESL 为必填项其余为非必填项。
-<img style="width:100%; max-width:800px; max-height:600px; margin-left:auto; margin-right:auto; display:block;" src="/img/UserGuide/Ecosystem-Integration/Grafana-plugin/grafana_input2.png?raw=true">
+<img style="width:100%; max-width:800px; max-height:600px; margin-left:auto; margin-right:auto; display:block;" src="https://alioss.timecho.com/docs/img/UserGuide/Ecosystem-Integration/Grafana-plugin/grafana_input2.png?raw=true">
##### 变量与模板功能的支持
@@ -262,32 +262,32 @@ SQL: Full Customized和SQL: Drop-down List两种输入方式都支持 Grafana
创建一个新的 Panel 后,点击右上角的设置按钮,如下图所示:
-<img style="width:100%; max-width:800px; max-height:600px; margin-left:auto; margin-right:auto; display:block;" src="/img/UserGuide/Ecosystem-Integration/Grafana-plugin/setconf.png?raw=true">
+<img style="width:100%; max-width:800px; max-height:600px; margin-left:auto; margin-right:auto; display:block;" src="https://alioss.timecho.com/docs/img/UserGuide/Ecosystem-Integration/Grafana-plugin/setconf.png?raw=true">
选择 `Variables`,点击 `Add variable` ,如下图所示:
-<img style="width:100%; max-width:800px; max-height:600px; margin-left:auto; margin-right:auto; display:block;" src="/img/UserGuide/Ecosystem-Integration/Grafana-plugin/addvaribles.png?raw=true">
+<img style="width:100%; max-width:800px; max-height:600px; margin-left:auto; margin-right:auto; display:block;" src="https://alioss.timecho.com/docs/img/UserGuide/Ecosystem-Integration/Grafana-plugin/addvaribles.png?raw=true">
示例一:输入 `Name`,`Label`,选择Type的`Query`、在Query 中输入show child paths xx , 点击 `Update` 按钮,如下图所示:
-<img style="width:100%; max-width:800px; max-height:600px; margin-left:auto; margin-right:auto; display:block;" src="/img/UserGuide/Ecosystem-Integration/Grafana-plugin/variblesinput.png?raw=true">
+<img style="width:100%; max-width:800px; max-height:600px; margin-left:auto; margin-right:auto; display:block;" src="https://alioss.timecho.com/docs/img/UserGuide/Ecosystem-Integration/Grafana-plugin/variblesinput.png?raw=true">
应用 Variables,在 `grafana panel` 中输入变量点击 `save` 按钮,如下图所示
-<img style="width:100%; max-width:800px; max-height:600px; margin-left:auto; margin-right:auto; display:block;" src="/img/UserGuide/Ecosystem-Integration/Grafana-plugin/applyvariables.png?raw=true">
+<img style="width:100%; max-width:800px; max-height:600px; margin-left:auto; margin-right:auto; display:block;" src="https://alioss.timecho.com/docs/img/UserGuide/Ecosystem-Integration/Grafana-plugin/applyvariables.png?raw=true">
示例二:变量嵌套使用,如下图所示
-<img style="width:100%; max-width:800px; max-height:600px; margin-left:auto; margin-right:auto; display:block;" src="/img/UserGuide/Ecosystem-Integration/Grafana-plugin/variblesinput2.png?raw=true">
+<img style="width:100%; max-width:800px; max-height:600px; margin-left:auto; margin-right:auto; display:block;" src="https://alioss.timecho.com/docs/img/UserGuide/Ecosystem-Integration/Grafana-plugin/variblesinput2.png?raw=true">
-<img style="width:100%; max-width:800px; max-height:600px; margin-left:auto; margin-right:auto; display:block;" src="/img/UserGuide/Ecosystem-Integration/Grafana-plugin/variblesinput2-1.png?raw=true">
+<img style="width:100%; max-width:800px; max-height:600px; margin-left:auto; margin-right:auto; display:block;" src="https://alioss.timecho.com/docs/img/UserGuide/Ecosystem-Integration/Grafana-plugin/variblesinput2-1.png?raw=true">
-<img style="width:100%; max-width:800px; max-height:600px; margin-left:auto; margin-right:auto; display:block;" src="/img/UserGuide/Ecosystem-Integration/Grafana-plugin/variblesinput2-2.png?raw=true">
+<img style="width:100%; max-width:800px; max-height:600px; margin-left:auto; margin-right:auto; display:block;" src="https://alioss.timecho.com/docs/img/UserGuide/Ecosystem-Integration/Grafana-plugin/variblesinput2-2.png?raw=true">
示例三:函数变量使用,如下图所示
-<img style="width:100%; max-width:800px; max-height:600px; margin-left:auto; margin-right:auto; display:block;" src="/img/UserGuide/Ecosystem-Integration/Grafana-plugin/variablesinput3.png?raw=true">
+<img style="width:100%; max-width:800px; max-height:600px; margin-left:auto; margin-right:auto; display:block;" src="https://alioss.timecho.com/docs/img/UserGuide/Ecosystem-Integration/Grafana-plugin/variablesinput3.png?raw=true">
-<img style="width:100%; max-width:800px; max-height:600px; margin-left:auto; margin-right:auto; display:block;" src="/img/UserGuide/Ecosystem-Integration/Grafana-plugin/variablesinput3-1.png?raw=true">
+<img style="width:100%; max-width:800px; max-height:600px; margin-left:auto; margin-right:auto; display:block;" src="https://alioss.timecho.com/docs/img/UserGuide/Ecosystem-Integration/Grafana-plugin/variablesinput3-1.png?raw=true">
上图中Name 是变量名称也是将来我们在panel中使用的变量名称,Label是变量的展示名称如果为空就显示Name的变量反之则显示Label的名称,
Type下拉中有Query、Custom、Text box、Constant、DataSource、Interval、Ad hoc filters等这些都可以在IoTDB的Grafana Plugin 中使用
@@ -309,29 +309,29 @@ Type下拉中有Query、Custom、Text box、Constant、DataSource、Interval、A
1、在 Grafana 侧栏中,将光标悬停在`Alerting`图标上,然后单击`Notification channels`。
-<img style="width:100%; max-width:800px; max-height:600px; margin-left:auto; margin-right:auto; display:block;" src="/img/UserGuide/Ecosystem-Integration/Grafana-plugin/alerting1.png?raw=true">
+<img style="width:100%; max-width:800px; max-height:600px; margin-left:auto; margin-right:auto; display:block;" src="https://alioss.timecho.com/docs/img/UserGuide/Ecosystem-Integration/Grafana-plugin/alerting1.png?raw=true">
2、单击添加频道。
-<img style="width:100%; max-width:800px; max-height:600px; margin-left:auto; margin-right:auto; display:block;" src="/img/UserGuide/Ecosystem-Integration/Grafana-plugin/alerting2.png?raw=true">
+<img style="width:100%; max-width:800px; max-height:600px; margin-left:auto; margin-right:auto; display:block;" src="https://alioss.timecho.com/docs/img/UserGuide/Ecosystem-Integration/Grafana-plugin/alerting2.png?raw=true">
3、填写下面描述的字段或选择选项,Type有好多种类型包括DingDing、Email、Slack、WebHook、Prometheus Alertmanager等。
本次示例Type使用`Prometheus Alertmanager`,需要提前安装好Prometheus Alertmanager,更多详细的配置及参数介绍请参考官方文档:https://grafana.com/docs/grafana/v8.0/alerting/old-alerting/notifications/。
-<img style="width:100%; max-width:800px; max-height:600px; margin-left:auto; margin-right:auto; display:block;" src="/img/UserGuide/Ecosystem-Integration/Grafana-plugin/alerting3.png?raw=true">
+<img style="width:100%; max-width:800px; max-height:600px; margin-left:auto; margin-right:auto; display:block;" src="https://alioss.timecho.com/docs/img/UserGuide/Ecosystem-Integration/Grafana-plugin/alerting3.png?raw=true">
4、点击`Test`按钮,出现`Test notification sent`点击`Save`按钮保存
-<img style="width:100%; max-width:800px; max-height:600px; margin-left:auto; margin-right:auto; display:block;" src="/img/UserGuide/Ecosystem-Integration/Grafana-plugin/alerting4.png?raw=true">
+<img style="width:100%; max-width:800px; max-height:600px; margin-left:auto; margin-right:auto; display:block;" src="https://alioss.timecho.com/docs/img/UserGuide/Ecosystem-Integration/Grafana-plugin/alerting4.png?raw=true">
5、创建一个新的 Panel 后,输入查询参数后点击保存然后选择`Alert`点击`Create Alert`,如下图所示:
-<img style="width:100%; max-width:800px; max-height:600px; margin-left:auto; margin-right:auto; display:block;" src="/img/UserGuide/Ecosystem-Integration/Grafana-plugin/alertpanle1.png?raw=true">
+<img style="width:100%; max-width:800px; max-height:600px; margin-left:auto; margin-right:auto; display:block;" src="https://alioss.timecho.com/docs/img/UserGuide/Ecosystem-Integration/Grafana-plugin/alertpanle1.png?raw=true">
6、填写下面描述的字段或选择选项, 其中`Name`是规则名称,`Evaluate every` 指定调度程序评估警报规则的频率,称为评估间隔,
`FOR` 指定在触发警报通知之前查询需要在多长时间内违反配置的阈值。`Conditions` 表示查询条件,可以配置多个组合查询条件。
-<img style="width:100%; max-width:800px; max-height:600px; margin-left:auto; margin-right:auto; display:block;" src="/img/UserGuide/Ecosystem-Integration/Grafana-plugin/alertpanle2.jpg?raw=true">
+<img style="width:100%; max-width:800px; max-height:600px; margin-left:auto; margin-right:auto; display:block;" src="https://alioss.timecho.com/docs/img/UserGuide/Ecosystem-Integration/Grafana-plugin/alertpanle2.jpg?raw=true">
图中的查询条件:avg() OF query(A,5m,now) IS ABOVE -1
@@ -346,19 +346,19 @@ IS ABOVE -1 定义阈值的类型和阈值。IS ABOVE表示在-1之上,可以
7、点击`Test rule` 按钮出现`firing: true`则配置成功,点击`save` 按钮
-<img style="width:100%; max-width:800px; max-height:600px; margin-left:auto; margin-right:auto; display:block;" src="/img/UserGuide/Ecosystem-Integration/Grafana-plugin/alertpanel3.png?raw=true">
+<img style="width:100%; max-width:800px; max-height:600px; margin-left:auto; margin-right:auto; display:block;" src="https://alioss.timecho.com/docs/img/UserGuide/Ecosystem-Integration/Grafana-plugin/alertpanel3.png?raw=true">
8、下图为grafana panel 中显示告警
-<img style="width:100%; max-width:800px; max-height:600px; margin-left:auto; margin-right:auto; display:block;" src="/img/UserGuide/Ecosystem-Integration/Grafana-plugin/alertpanel4.png?raw=true">
+<img style="width:100%; max-width:800px; max-height:600px; margin-left:auto; margin-right:auto; display:block;" src="https://alioss.timecho.com/docs/img/UserGuide/Ecosystem-Integration/Grafana-plugin/alertpanel4.png?raw=true">
9、查看告警规则
-<img style="width:100%; max-width:800px; max-height:600px; margin-left:auto; margin-right:auto; display:block;" src="/img/UserGuide/Ecosystem-Integration/Grafana-plugin/alertPanel5.png?raw=true">
+<img style="width:100%; max-width:800px; max-height:600px; margin-left:auto; margin-right:auto; display:block;" src="https://alioss.timecho.com/docs/img/UserGuide/Ecosystem-Integration/Grafana-plugin/alertPanel5.png?raw=true">
10、在promehthus alertmanager 中查看告警记录
-<img style="width:100%; max-width:800px; max-height:600px; margin-left:auto; margin-right:auto; display:block;" src="/img/UserGuide/Ecosystem-Integration/Grafana-plugin/alertpanel6.png?raw=true">
+<img style="width:100%; max-width:800px; max-height:600px; margin-left:auto; margin-right:auto; display:block;" src="https://alioss.timecho.com/docs/img/UserGuide/Ecosystem-Integration/Grafana-plugin/alertpanel6.png?raw=true">
#### 更多
diff --git a/docs/zh/UserGuide/Ecosystem-Integration/Workbench.md b/docs/zh/UserGuide/Ecosystem-Integration/Workbench.md
index a3cc33b3f4..60486c284a 100644
--- a/docs/zh/UserGuide/Ecosystem-Integration/Workbench.md
+++ b/docs/zh/UserGuide/Ecosystem-Integration/Workbench.md
@@ -35,7 +35,7 @@ Workbench是一个可创建多个连接的图形化数据库管理工具,用
1、下载并解压软件。第一步是从官方网站或一个可信赖的来源下载软件,下载地址为https://www.timecho.com/product。
软件号不同组件也不同,应包含前端组件"frontend"与后端组件"backend"。将"frontend"压缩包解压,得到名为"dist"的文件。
-
+
2、配置Nginx。复制以下代码到"Nginx.conf"配置文件对应位置。注意需修改项目路径。数据看板地址、端口和数据库可在后端组件"backend"文件夹中的application-prod.properties文件修改。
@@ -102,7 +102,7 @@ server {
默认用户名为root,密码为123456。用户名必须由字母、数字、下划线组成,不能以数字和下划线开始,须大于等于4个字符,密码必须大于等于6位。点击"**文A**"可切换语言,有中文、英文可选。
-
+
## 用户界面
@@ -110,7 +110,7 @@ server {
主界面由操作栏、导航栏、工具栏和几个窗格组成。
-
+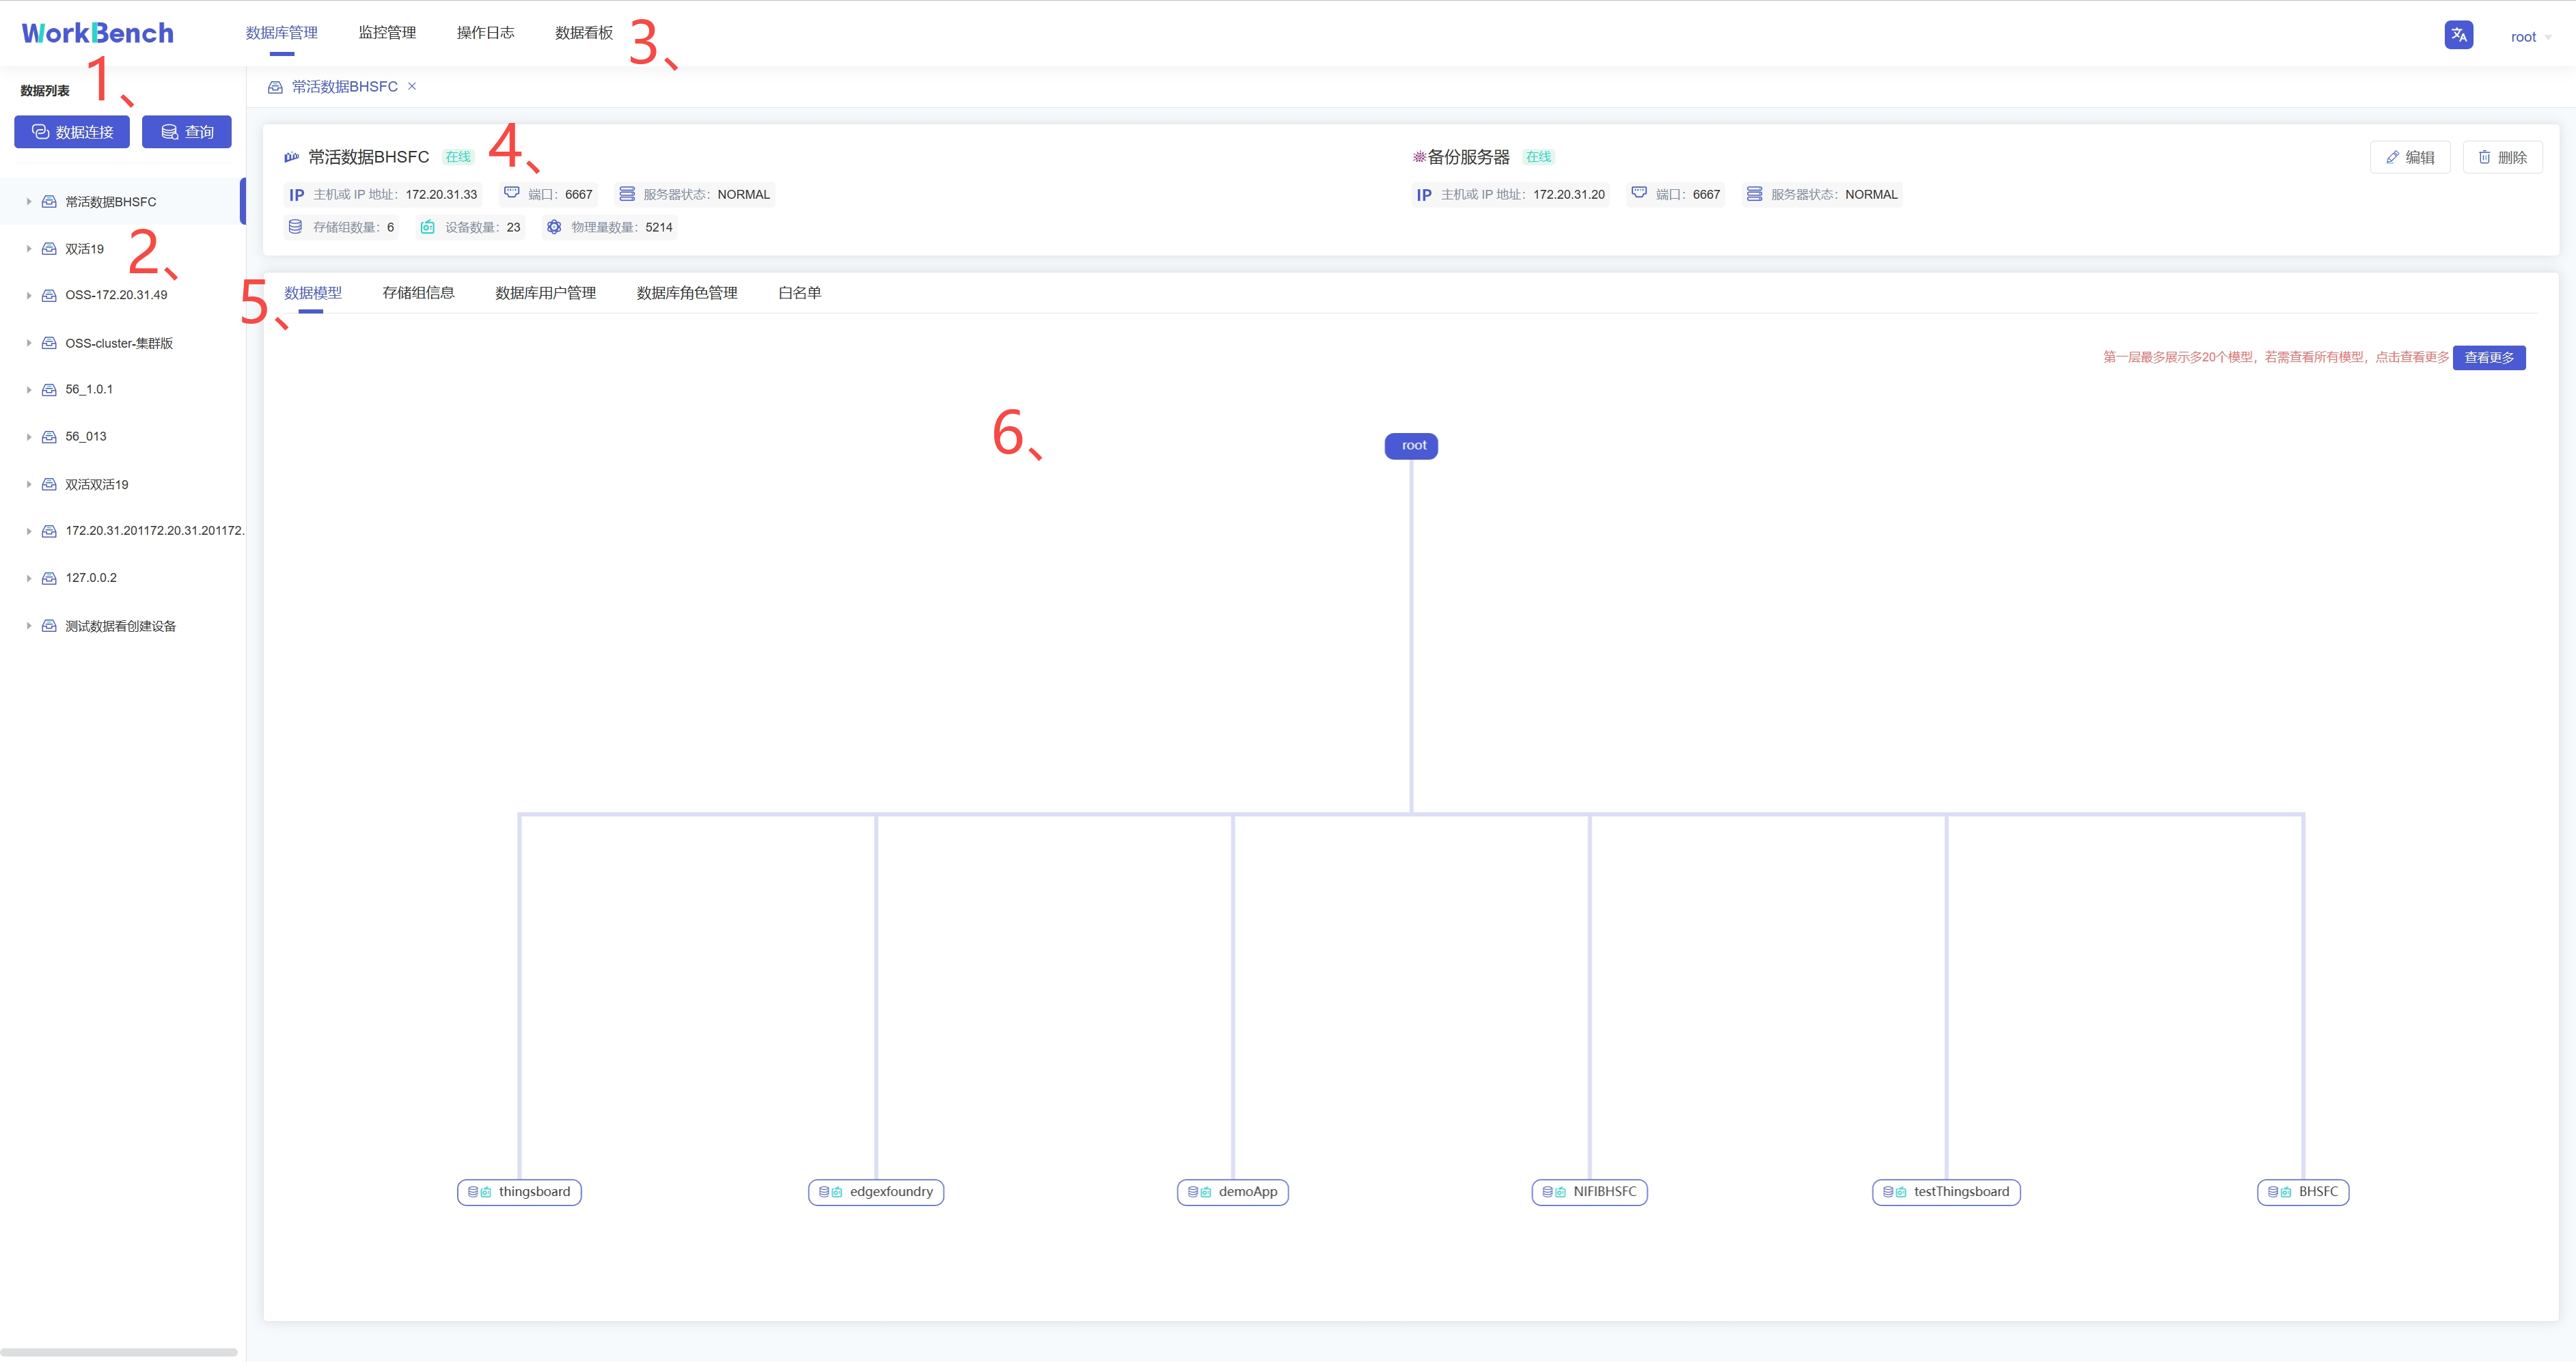
1、连接操作栏
@@ -120,7 +120,7 @@ server {
对象窗格显示已连接的数据库实例,采用树状结构设计,点击出现子节点可以方便地处理数据库和它们管理的对象,展示的最低层级是设备。
-
+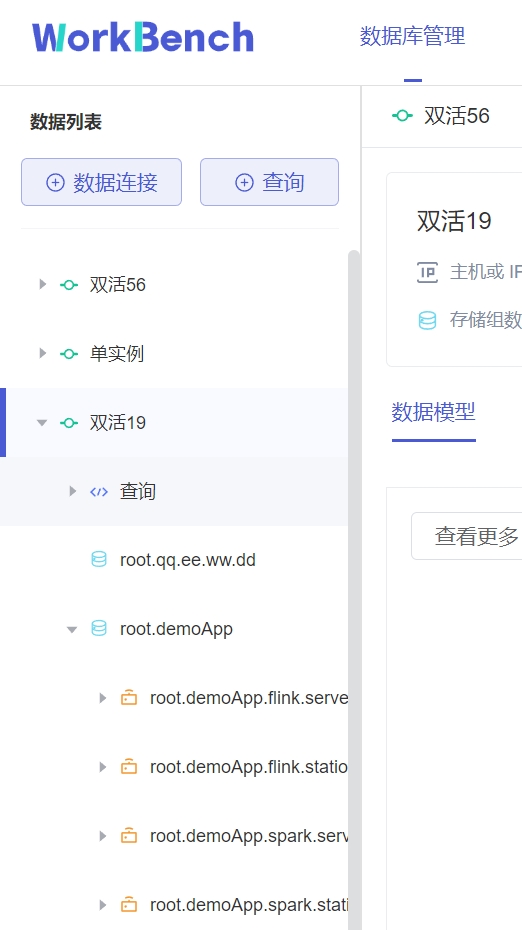
3、导航栏
@@ -130,11 +130,11 @@ server {
状态栏显示当前选项下的状态信息,当选中"**数据库管理**"时,状态栏显示数据库的在线情况、IP、端口、服务器状态及其存储组、设备、物理量的数量信息。
-
+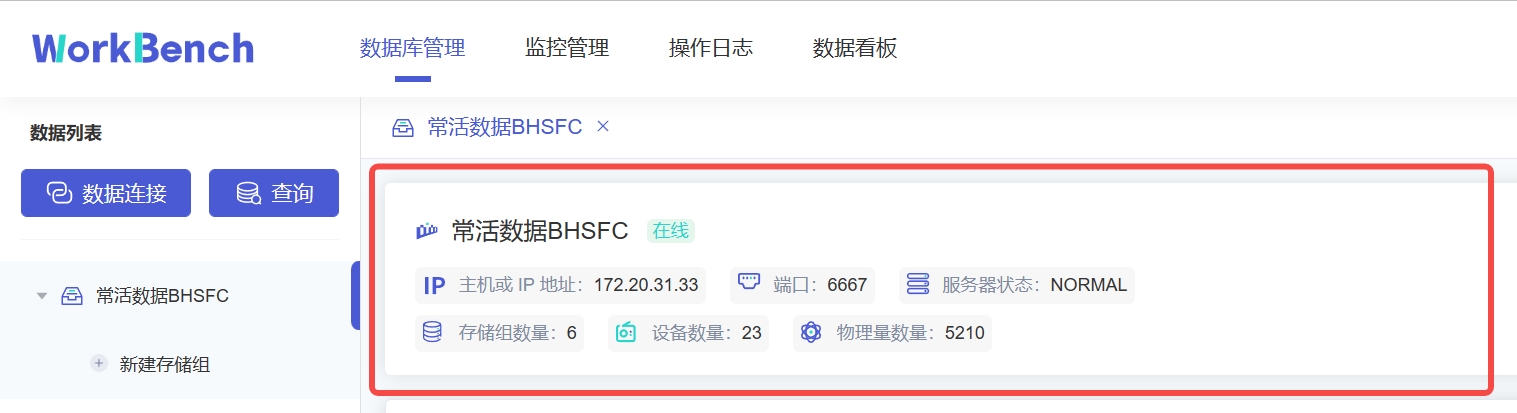
当选\"**监控管理**\"时,状态栏显示数据库的在线情况、IP、端口、服务器状态、数据库版本、激活信息及到期时间。z注:"**数据库版本**"处的图标表示企业版或开源版,Workbench部分功能在开源版上无法使用。
-
+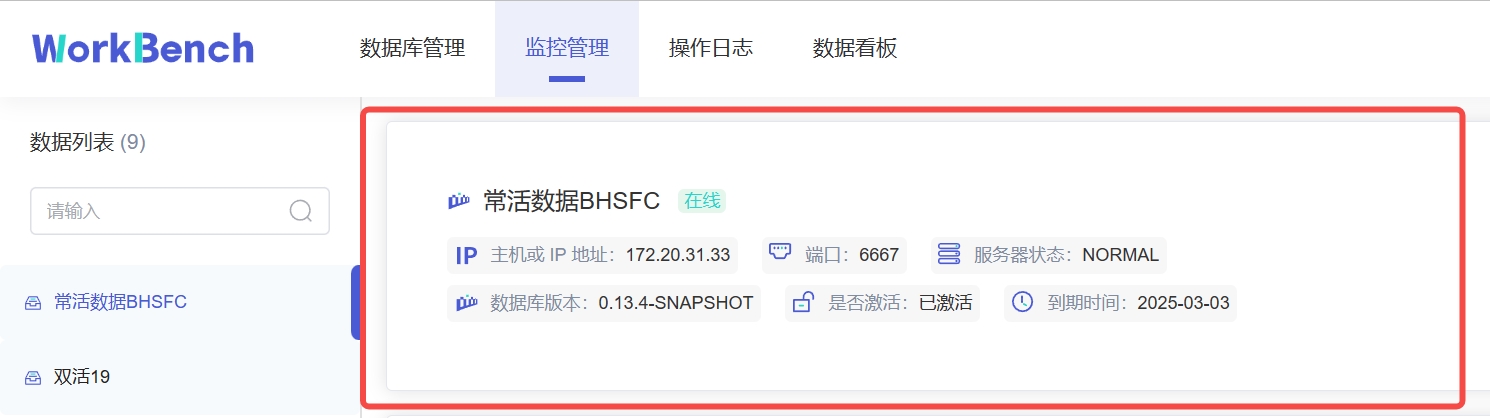
5、操作列
@@ -148,15 +148,15 @@ server {
首先用连接窗口创建一个或多个连接。点击"**数据连接**"创建新建连接。
-
+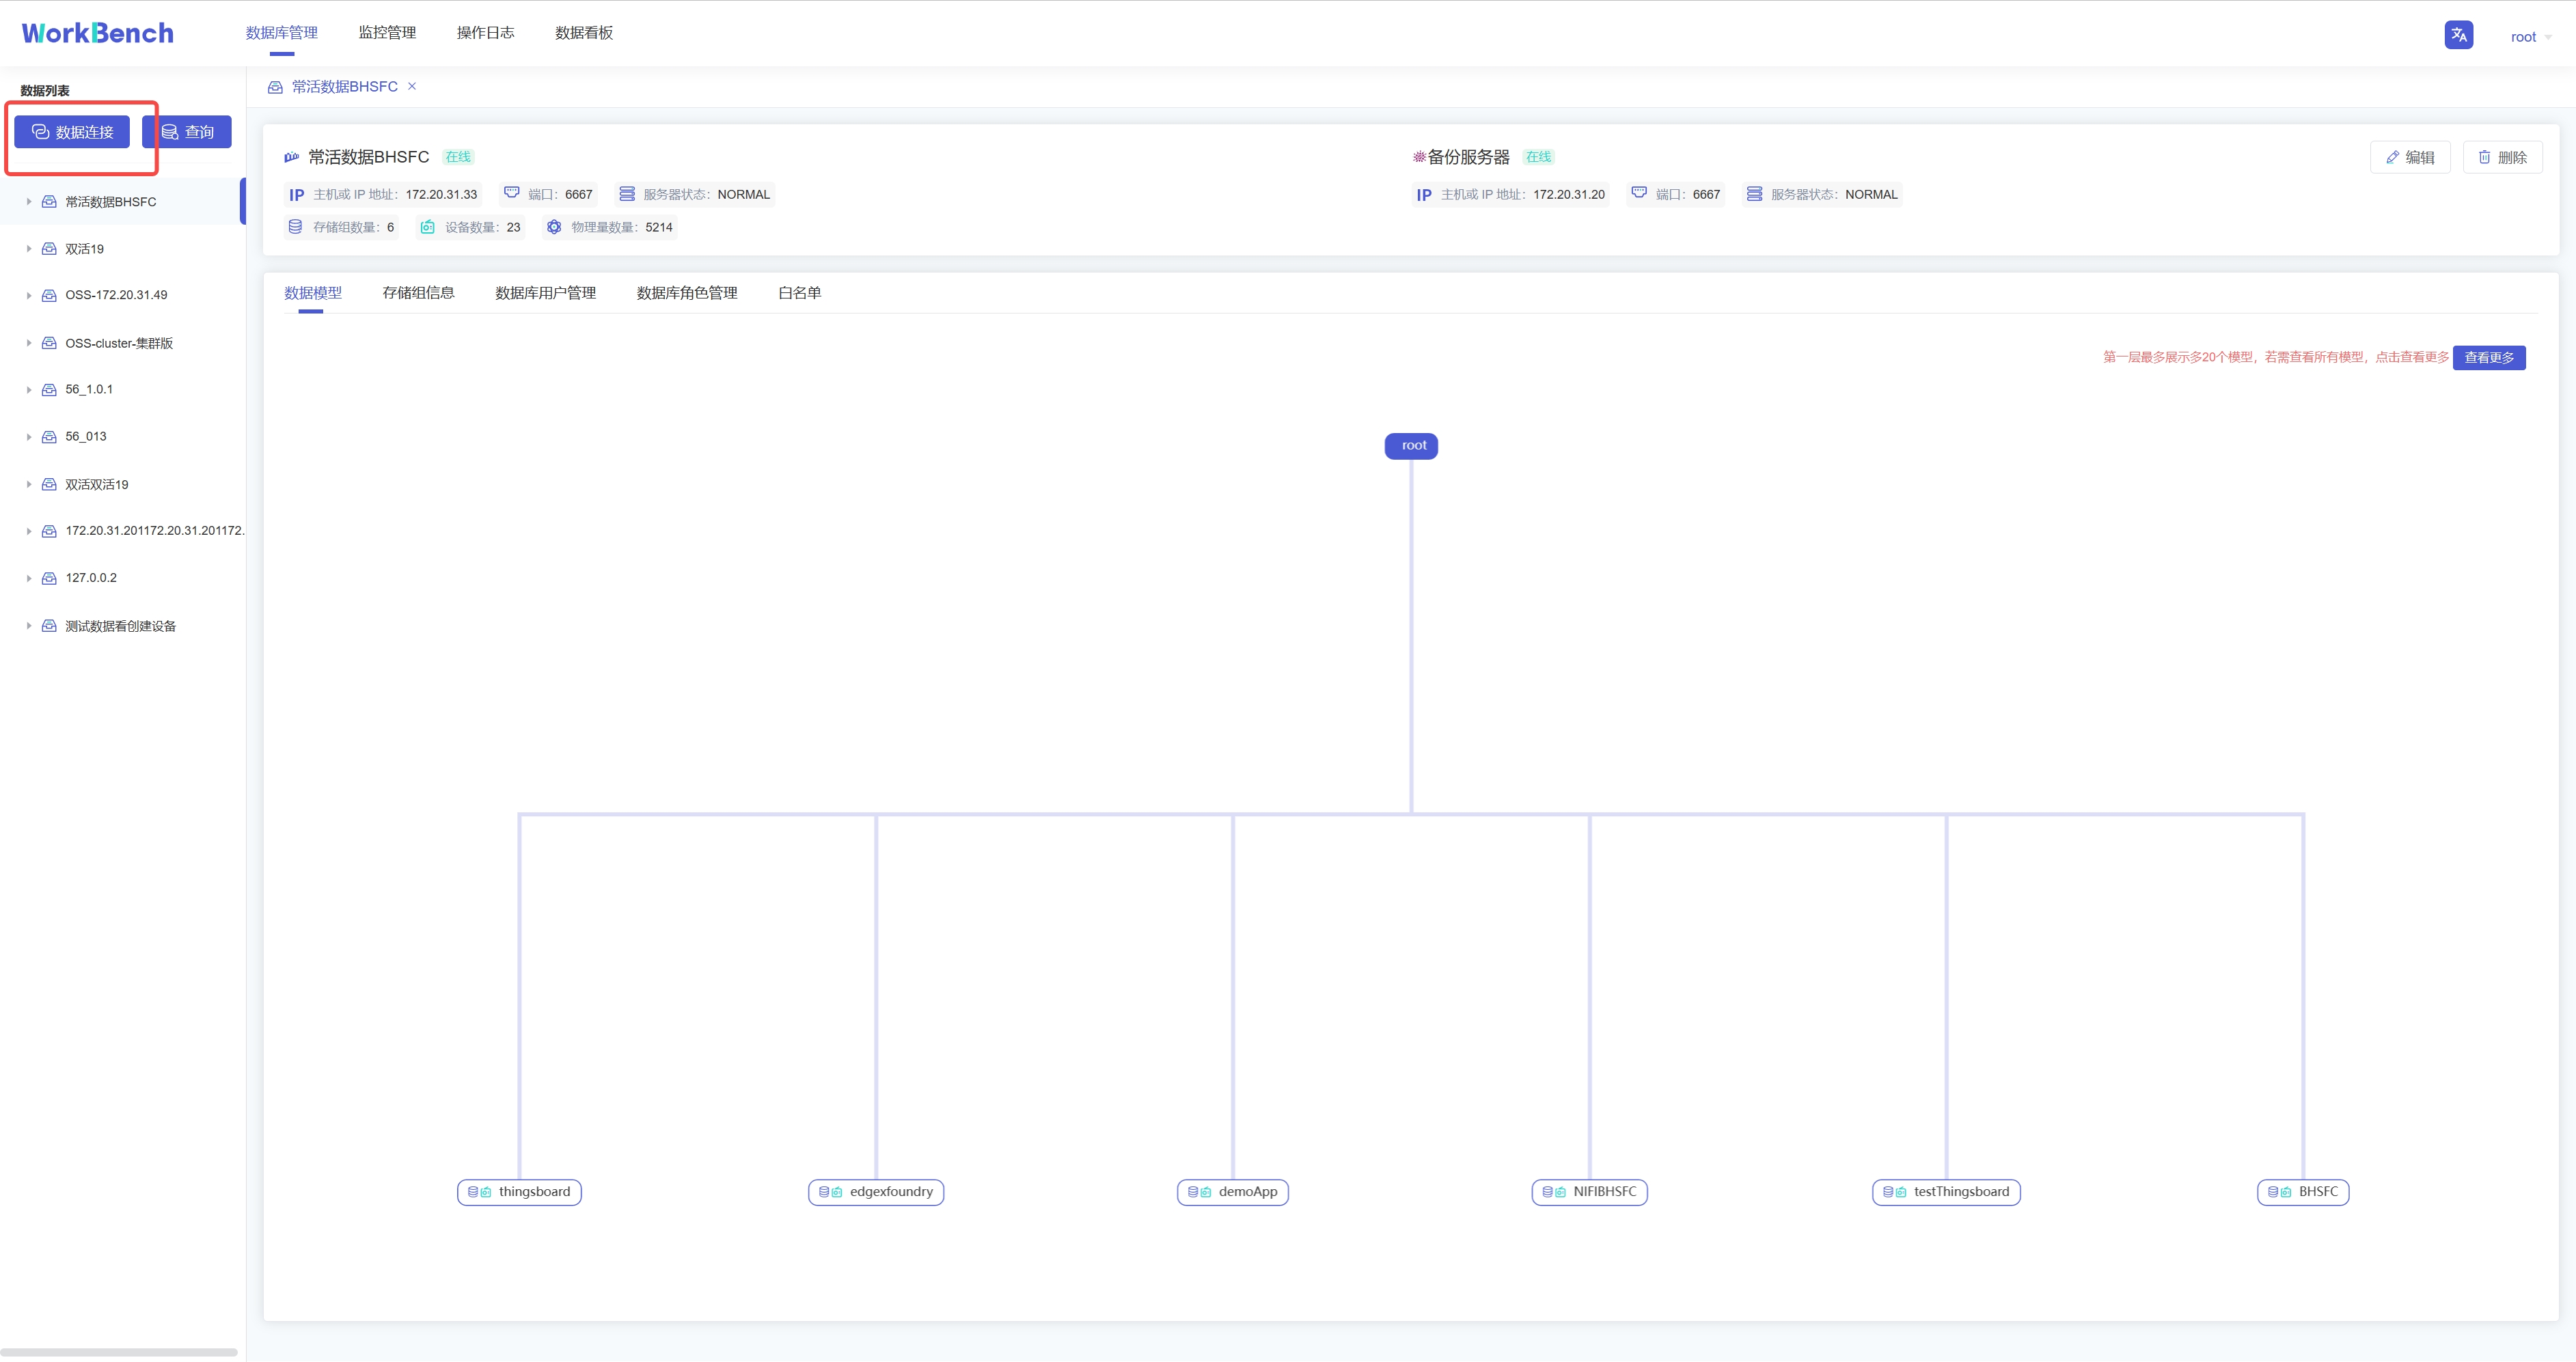
在弹出的连接窗口输入需要填写的信息,其中数据连接名称必须大于等于3个字符。然后点击"**连接测试**",显示"**连接测试通过**"则表示正确连接,点击确定即可新建连接。
-
+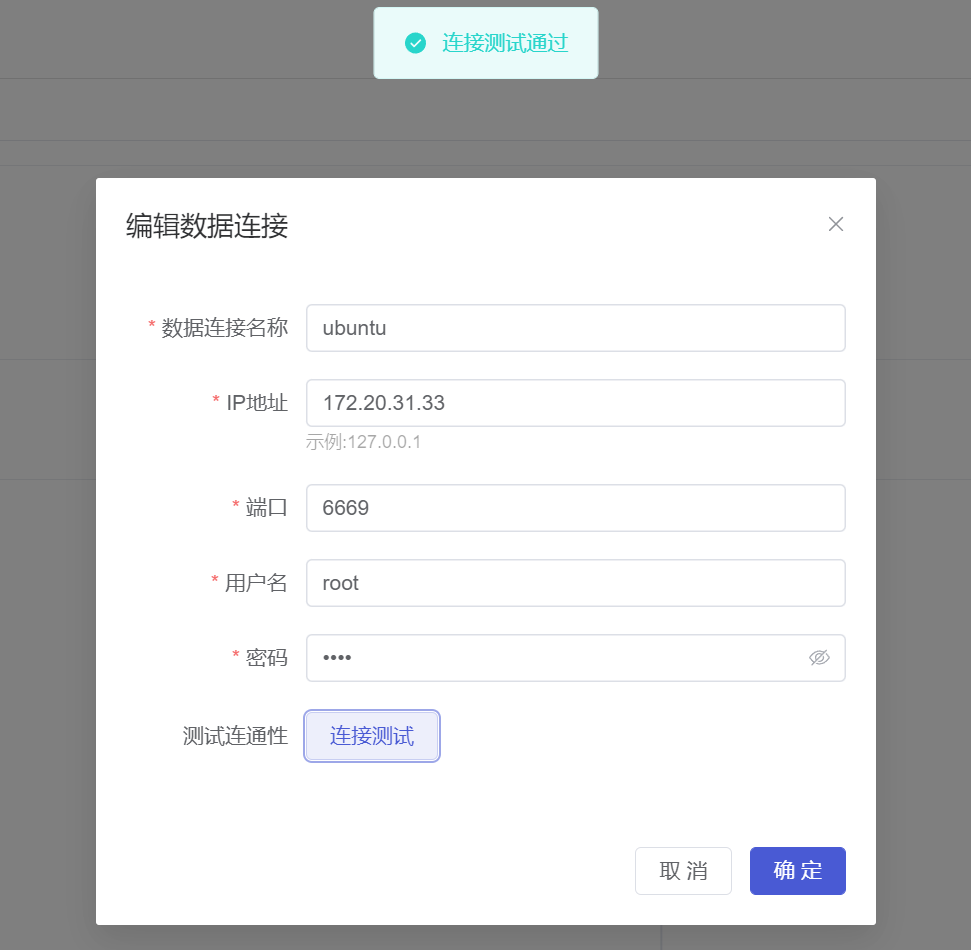
若要修改连接情况,则可在状态栏右侧点"**编辑**"选项即可修改数据库连接信息。
-
+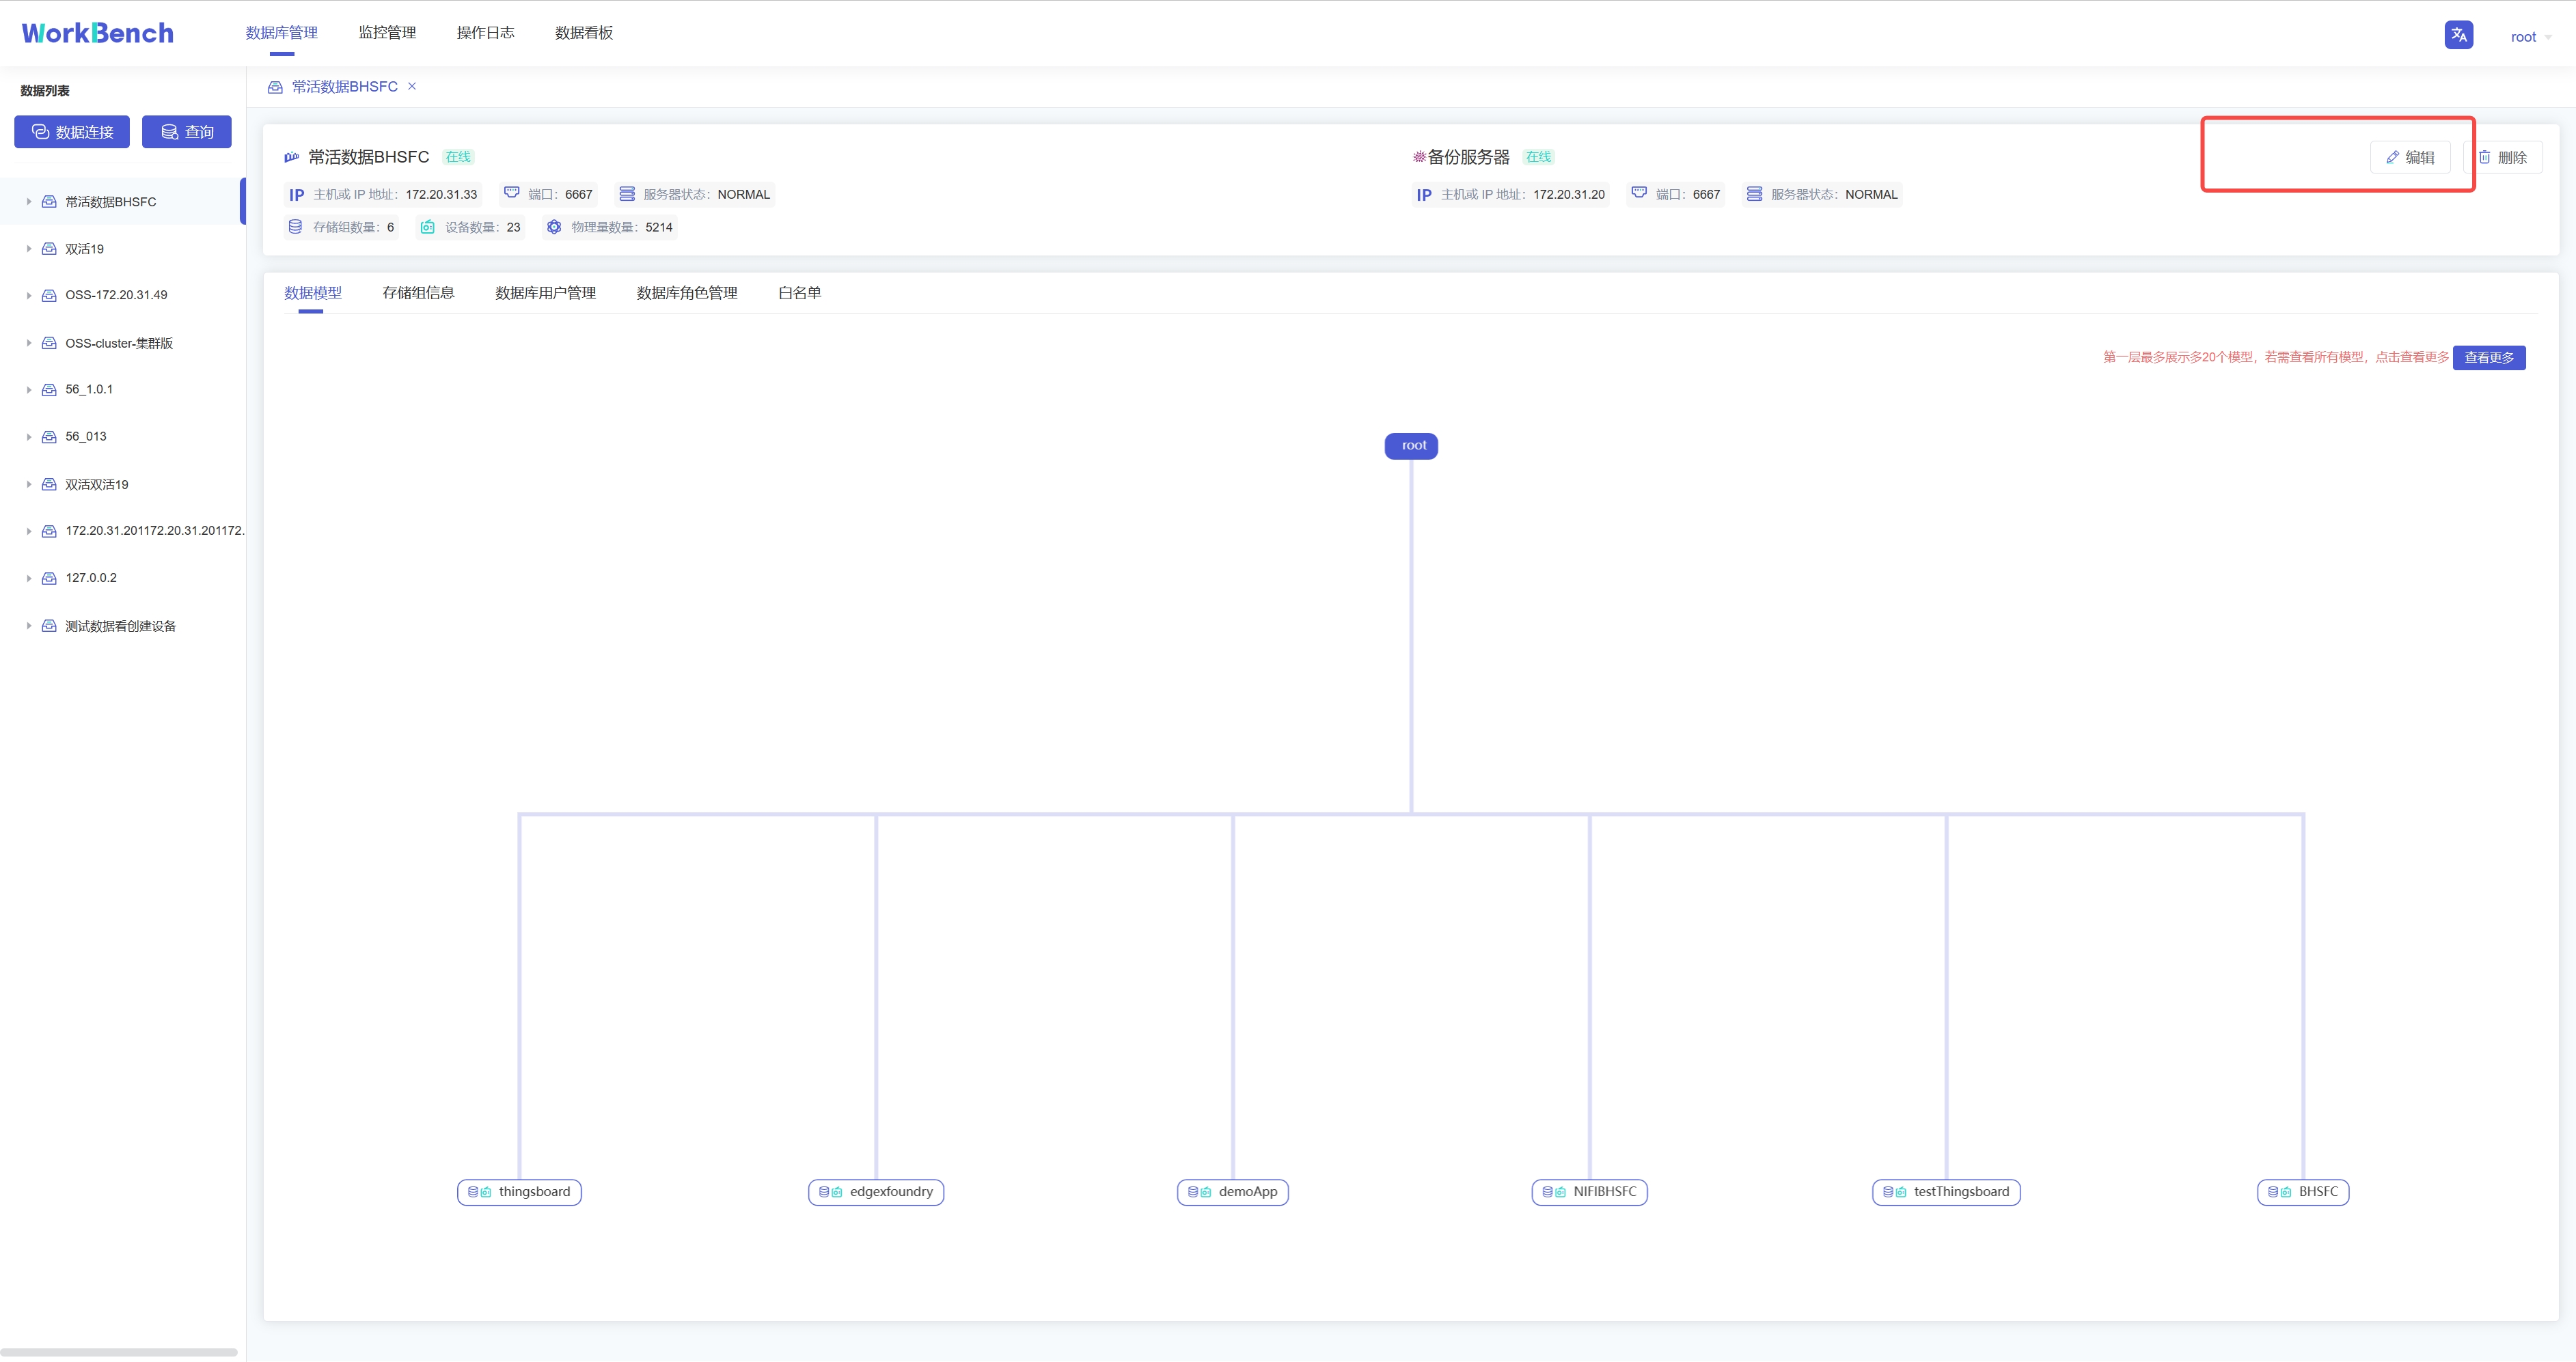
## 服务器安全性
@@ -166,7 +166,7 @@ server {
从导航栏选择"**数据库管理**"-\>"**白名单**"可查看已添加的白名单IP列表。
-
+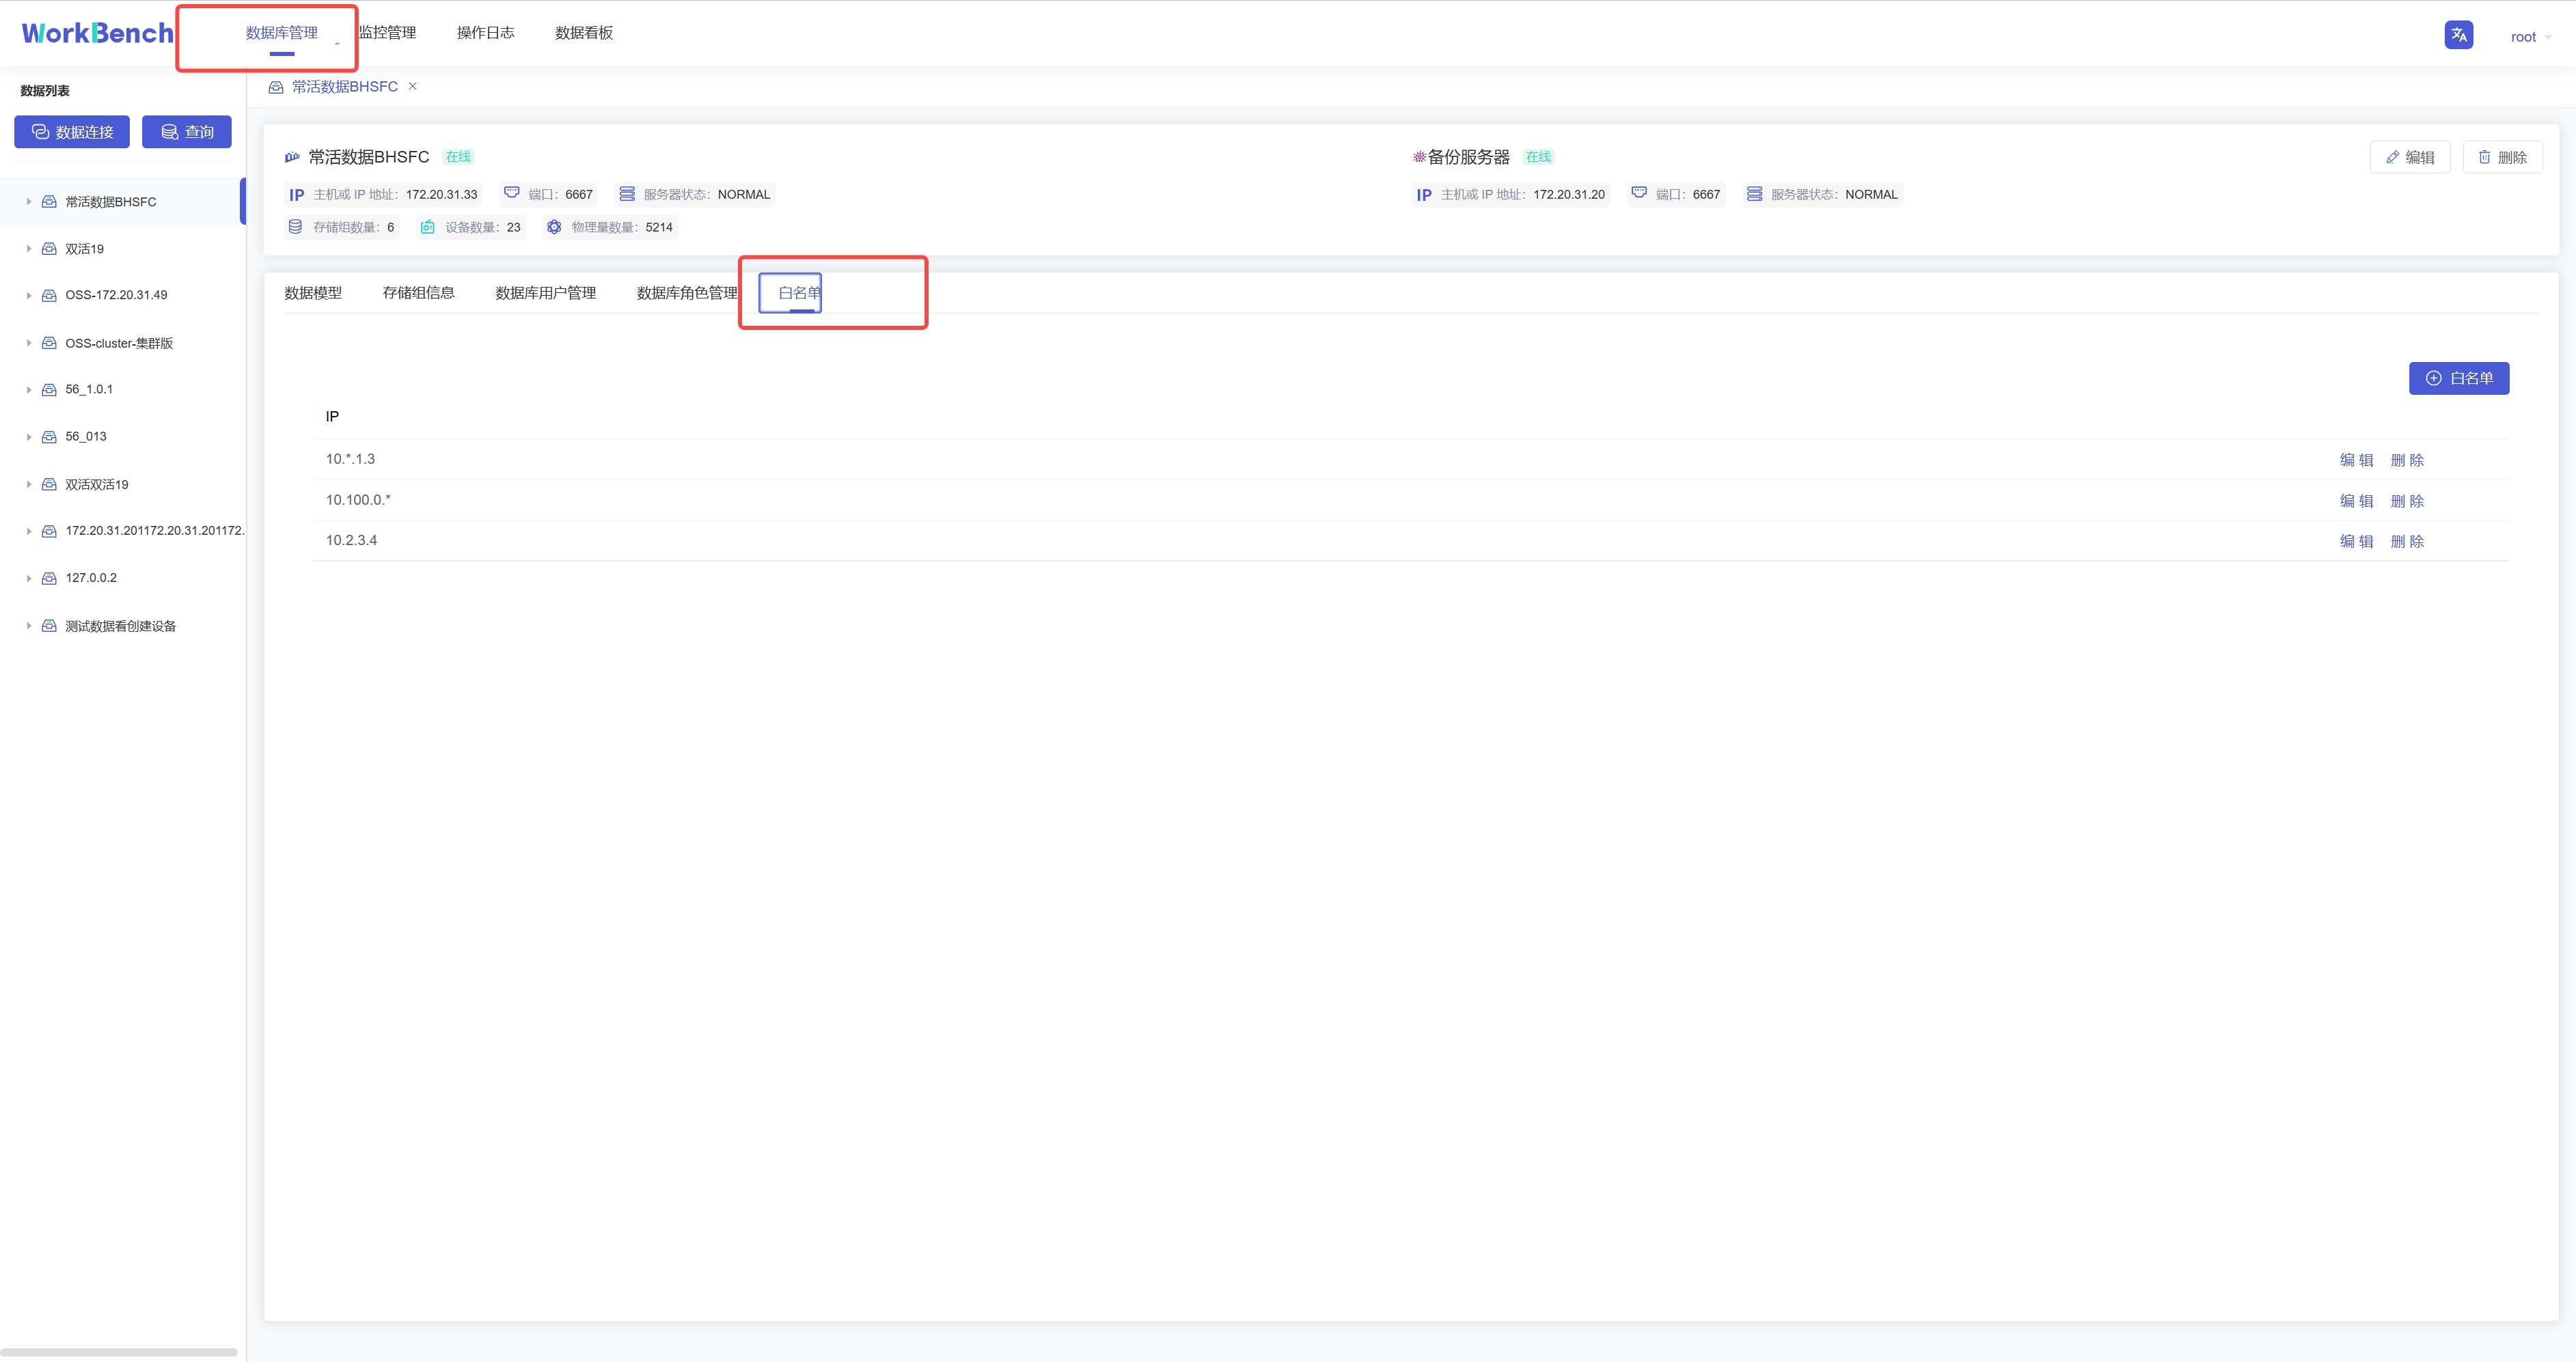
点击"**白名单**"可新增白名单IP,点击"**编辑**"/"**删除**"可修改白名单列表的IP信息。
@@ -175,23 +175,23 @@ server {
Workbench提供强大的工具以管理服务器用户帐号和数据库对象的权限。在操作列中点击
"**数据库用户管理**"或 "**数据库角色管理**"来打开用户或角色的对象列表。
-
+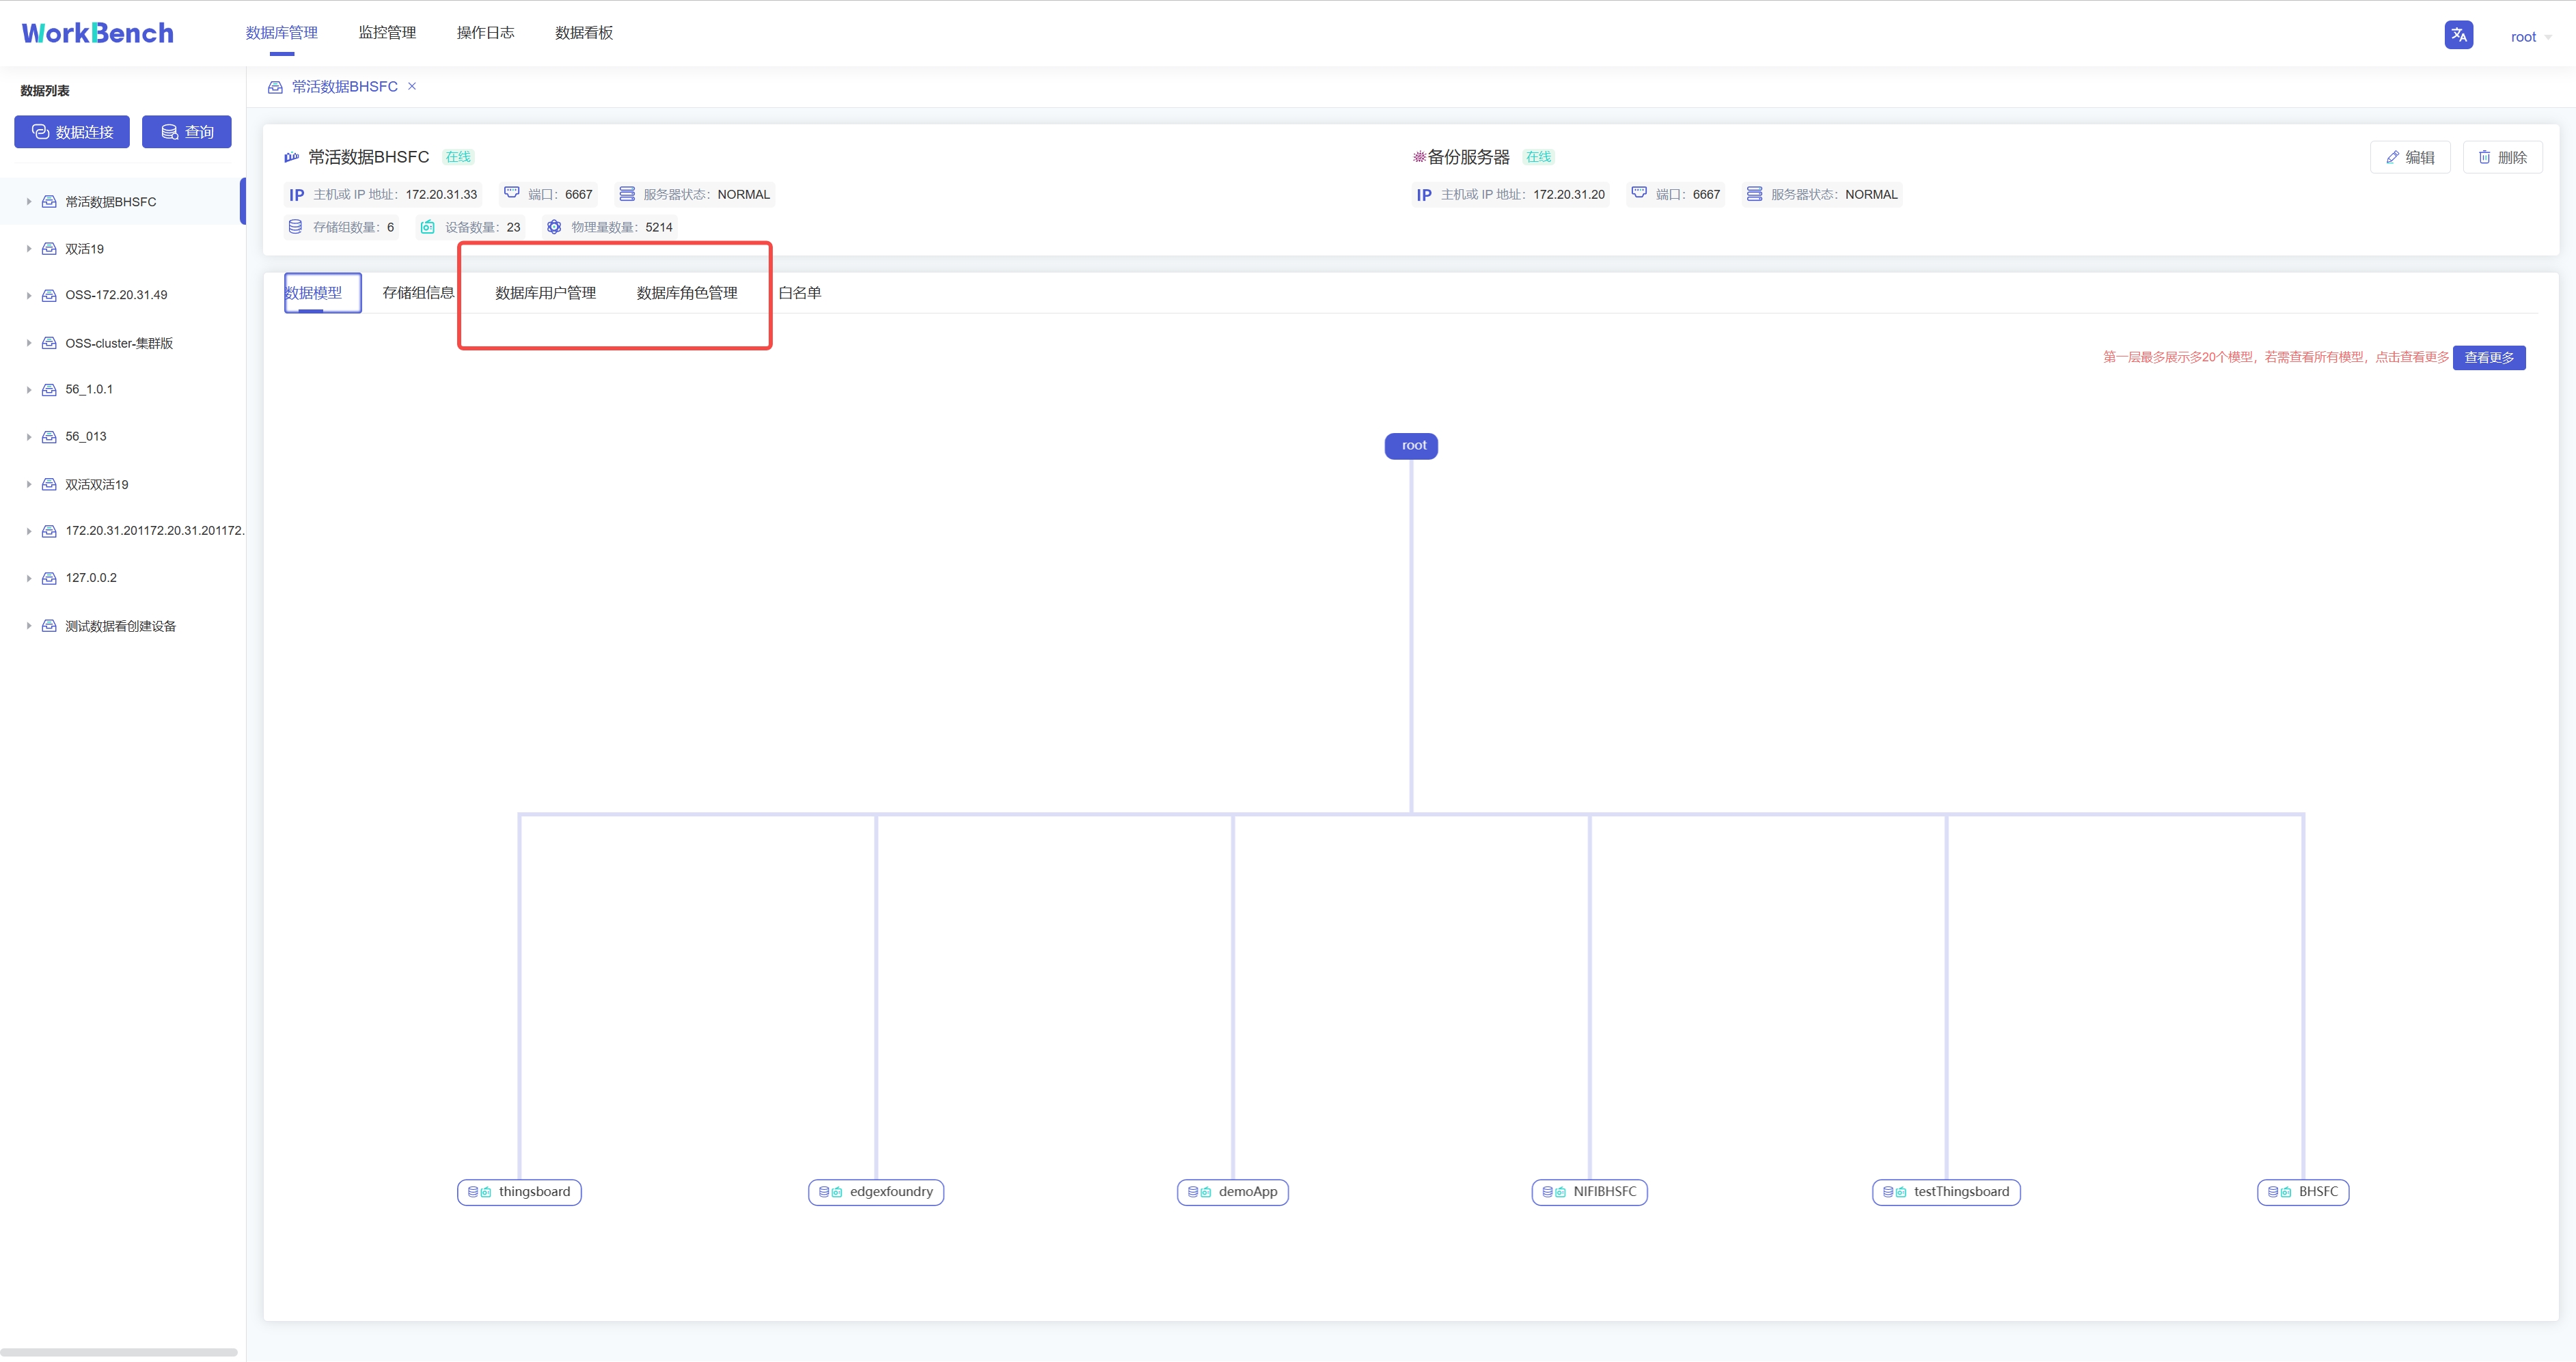
**新增用户**。选择"**数据库用户管理**"-\>"**用户账号+**"可新增用户,按要求填写用户名和密码即可,可以为用户添加角色信息。
-
+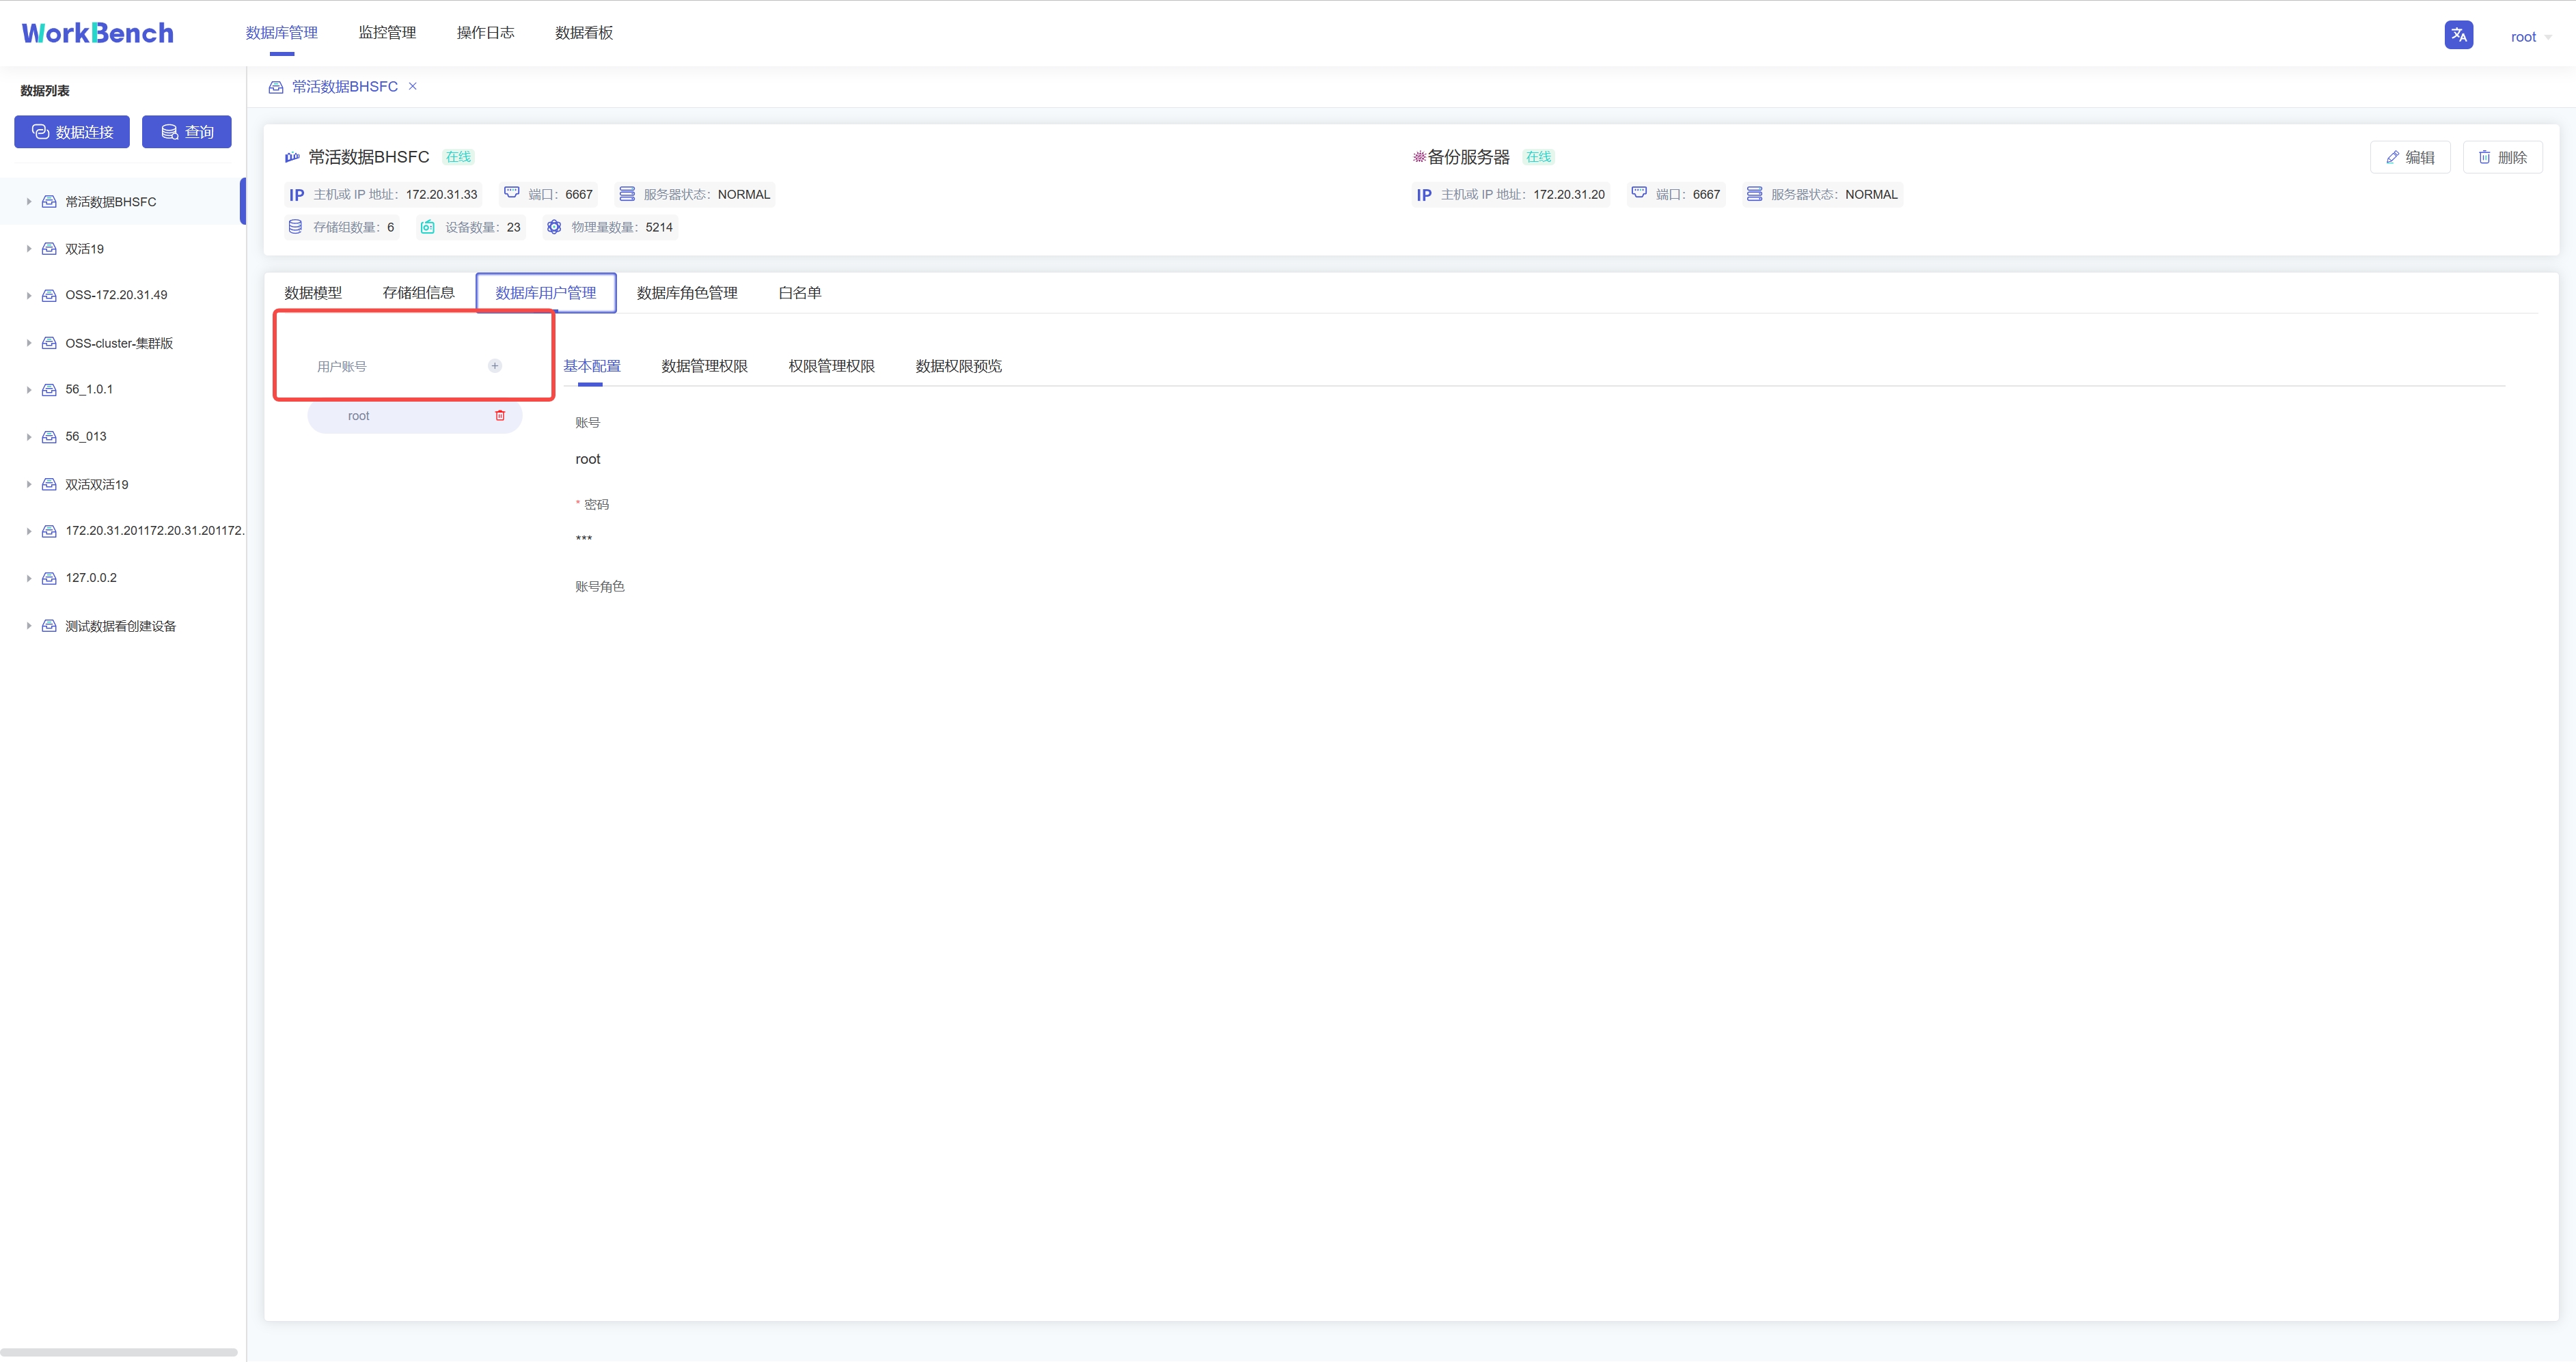
**添加权限**。权限可分为数据管理权限(如对数据进行增删改查)以及权限管理权限(用户、角色的创建与删除,权限的赋予与撤销等)。选择"**数据库用户管理**"-\>"**数据管理权限**"-\>"**添加权限**"可为用户添加数据管理权限。在已添加的权限处可以选择"**编辑**"或"**删除**"以修改权限信息。
-
+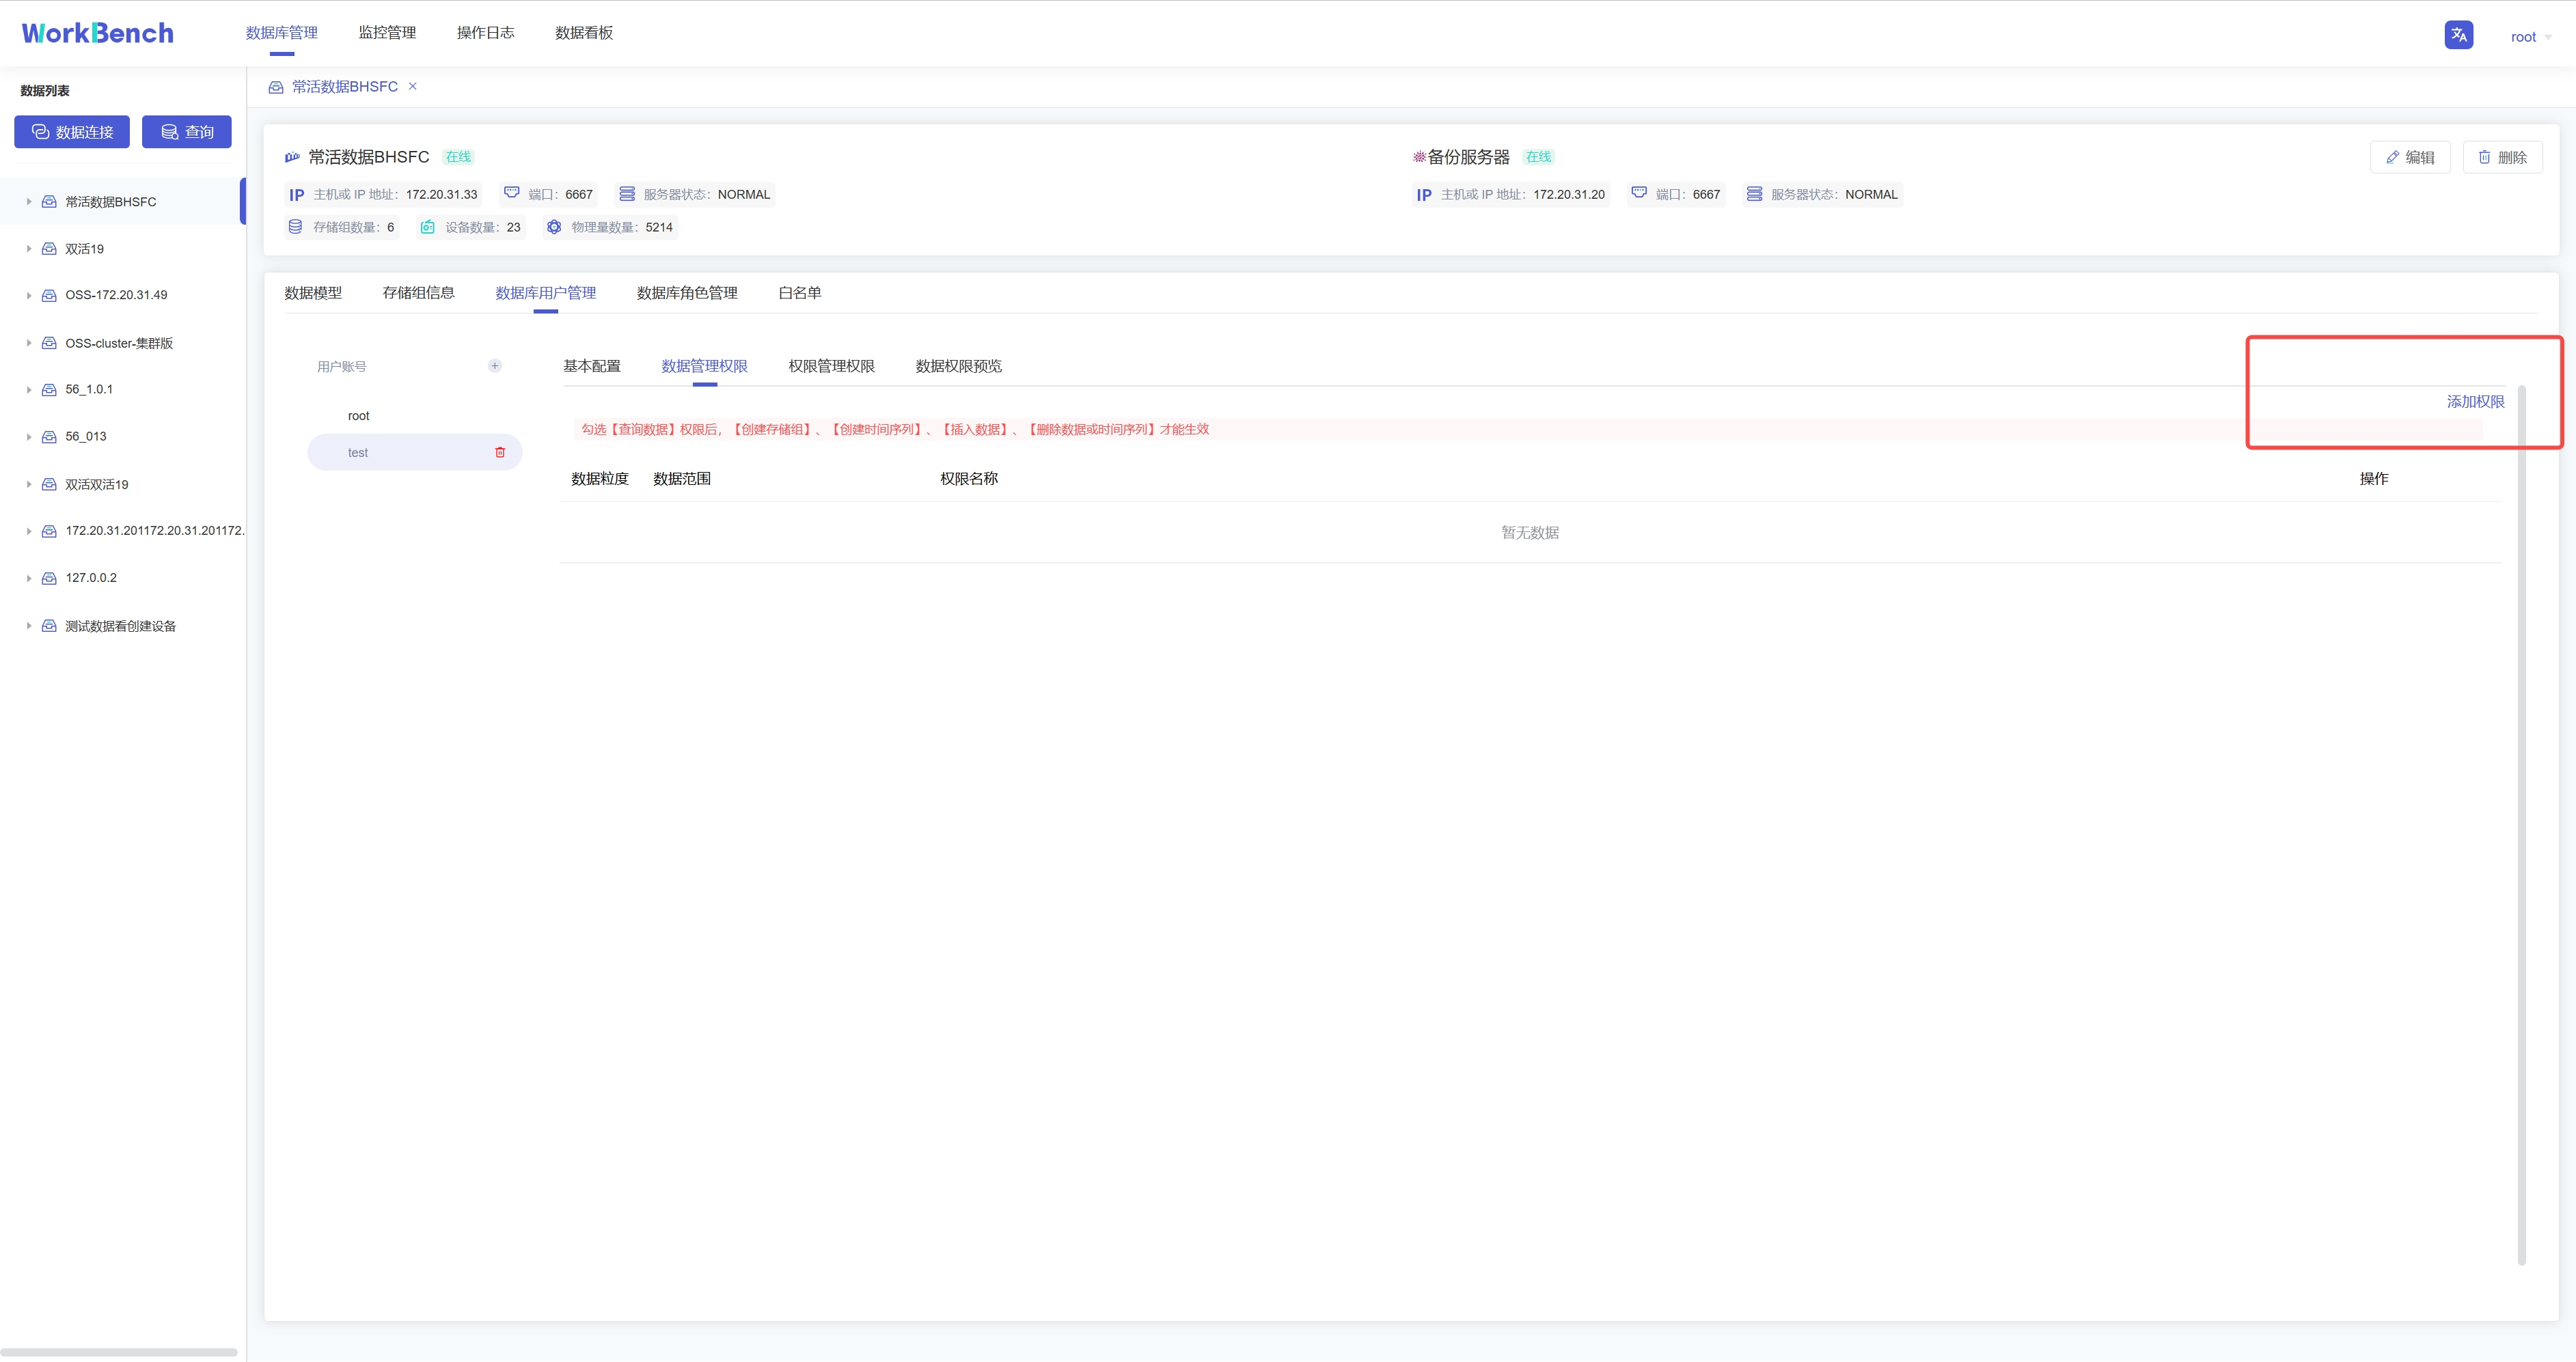
弹出的界面可以选择权限作用的粒度以及具体权限内容。注意只有勾选【查询数据】权限和【查看用户】权限,其他权限才能在Workbench中生效查看。
-
+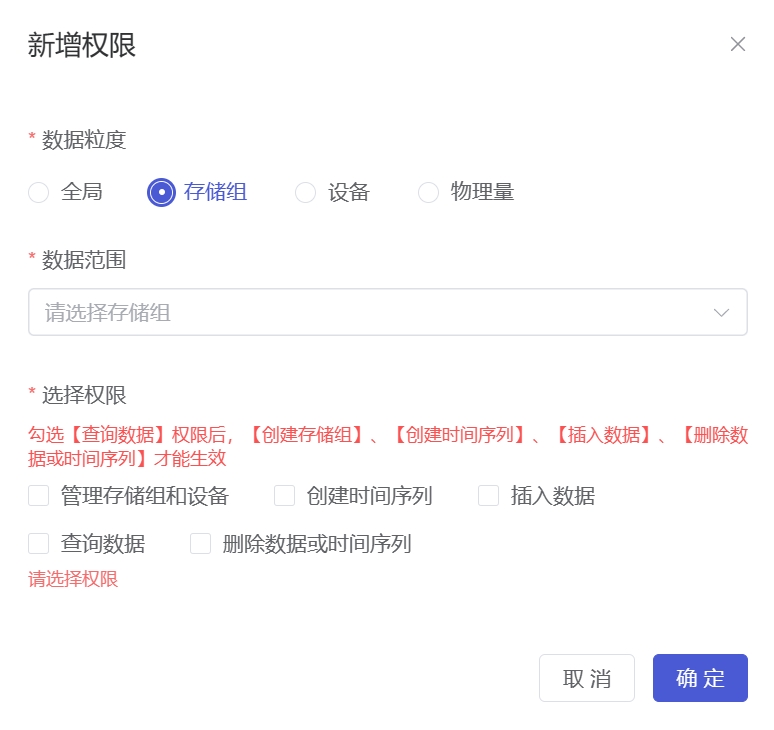
选择"**数据库用户管理**"-\>"**权限管理权限**"勾选信息窗格中具体的权限信息,点击"保存"可为用户添加权限管理权限。
-
+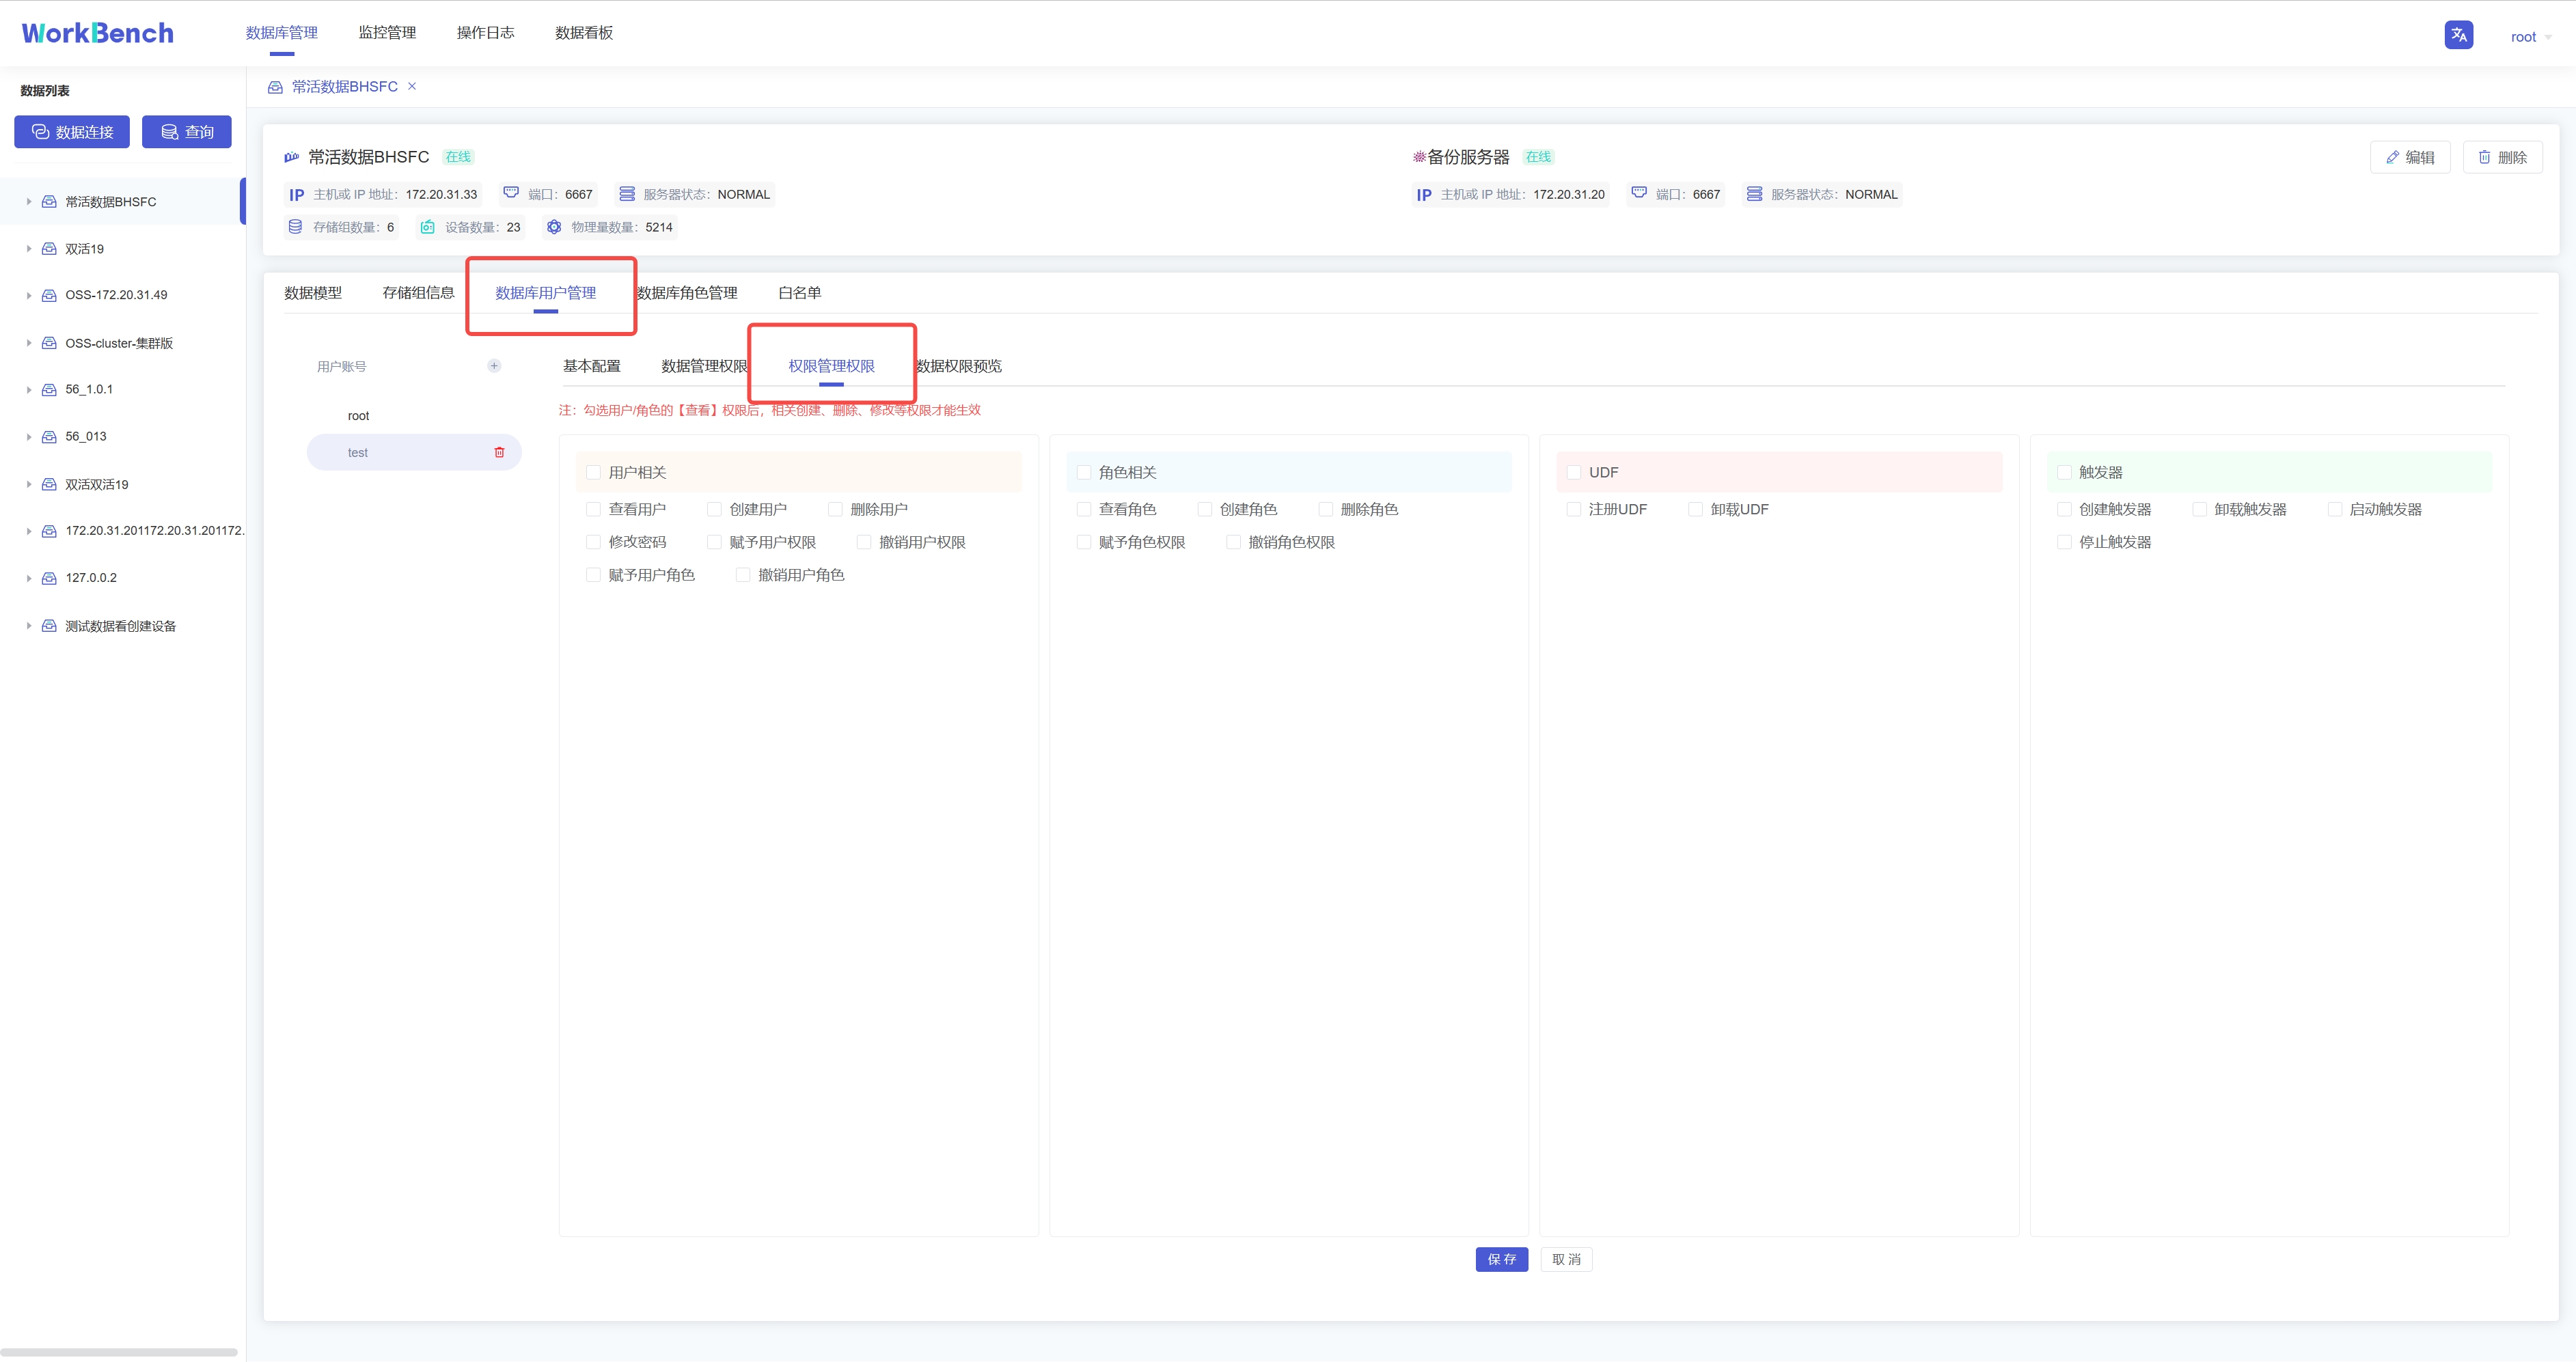
**权限预览**。选择"**数据库用户管理**"-\>"**数据权限预览**"可预览该用户名下所有的数据权限。注:该功能仅支持企业版。
@@ -203,21 +203,21 @@ Workbench提供强大的工具以管理服务器用户帐号和数据库对象
批量导入功能仅在企业版中支持。在对象窗格中选择要操作的数据库,选择到设备节点,则右侧信息窗格将出现"**设备结构"**信息,点击"**导入物理量**",下载模板填写物理量信息,再上传该CSV文件即可批量导入物理量。注:当前版本不支持导入对齐物理量。
-
+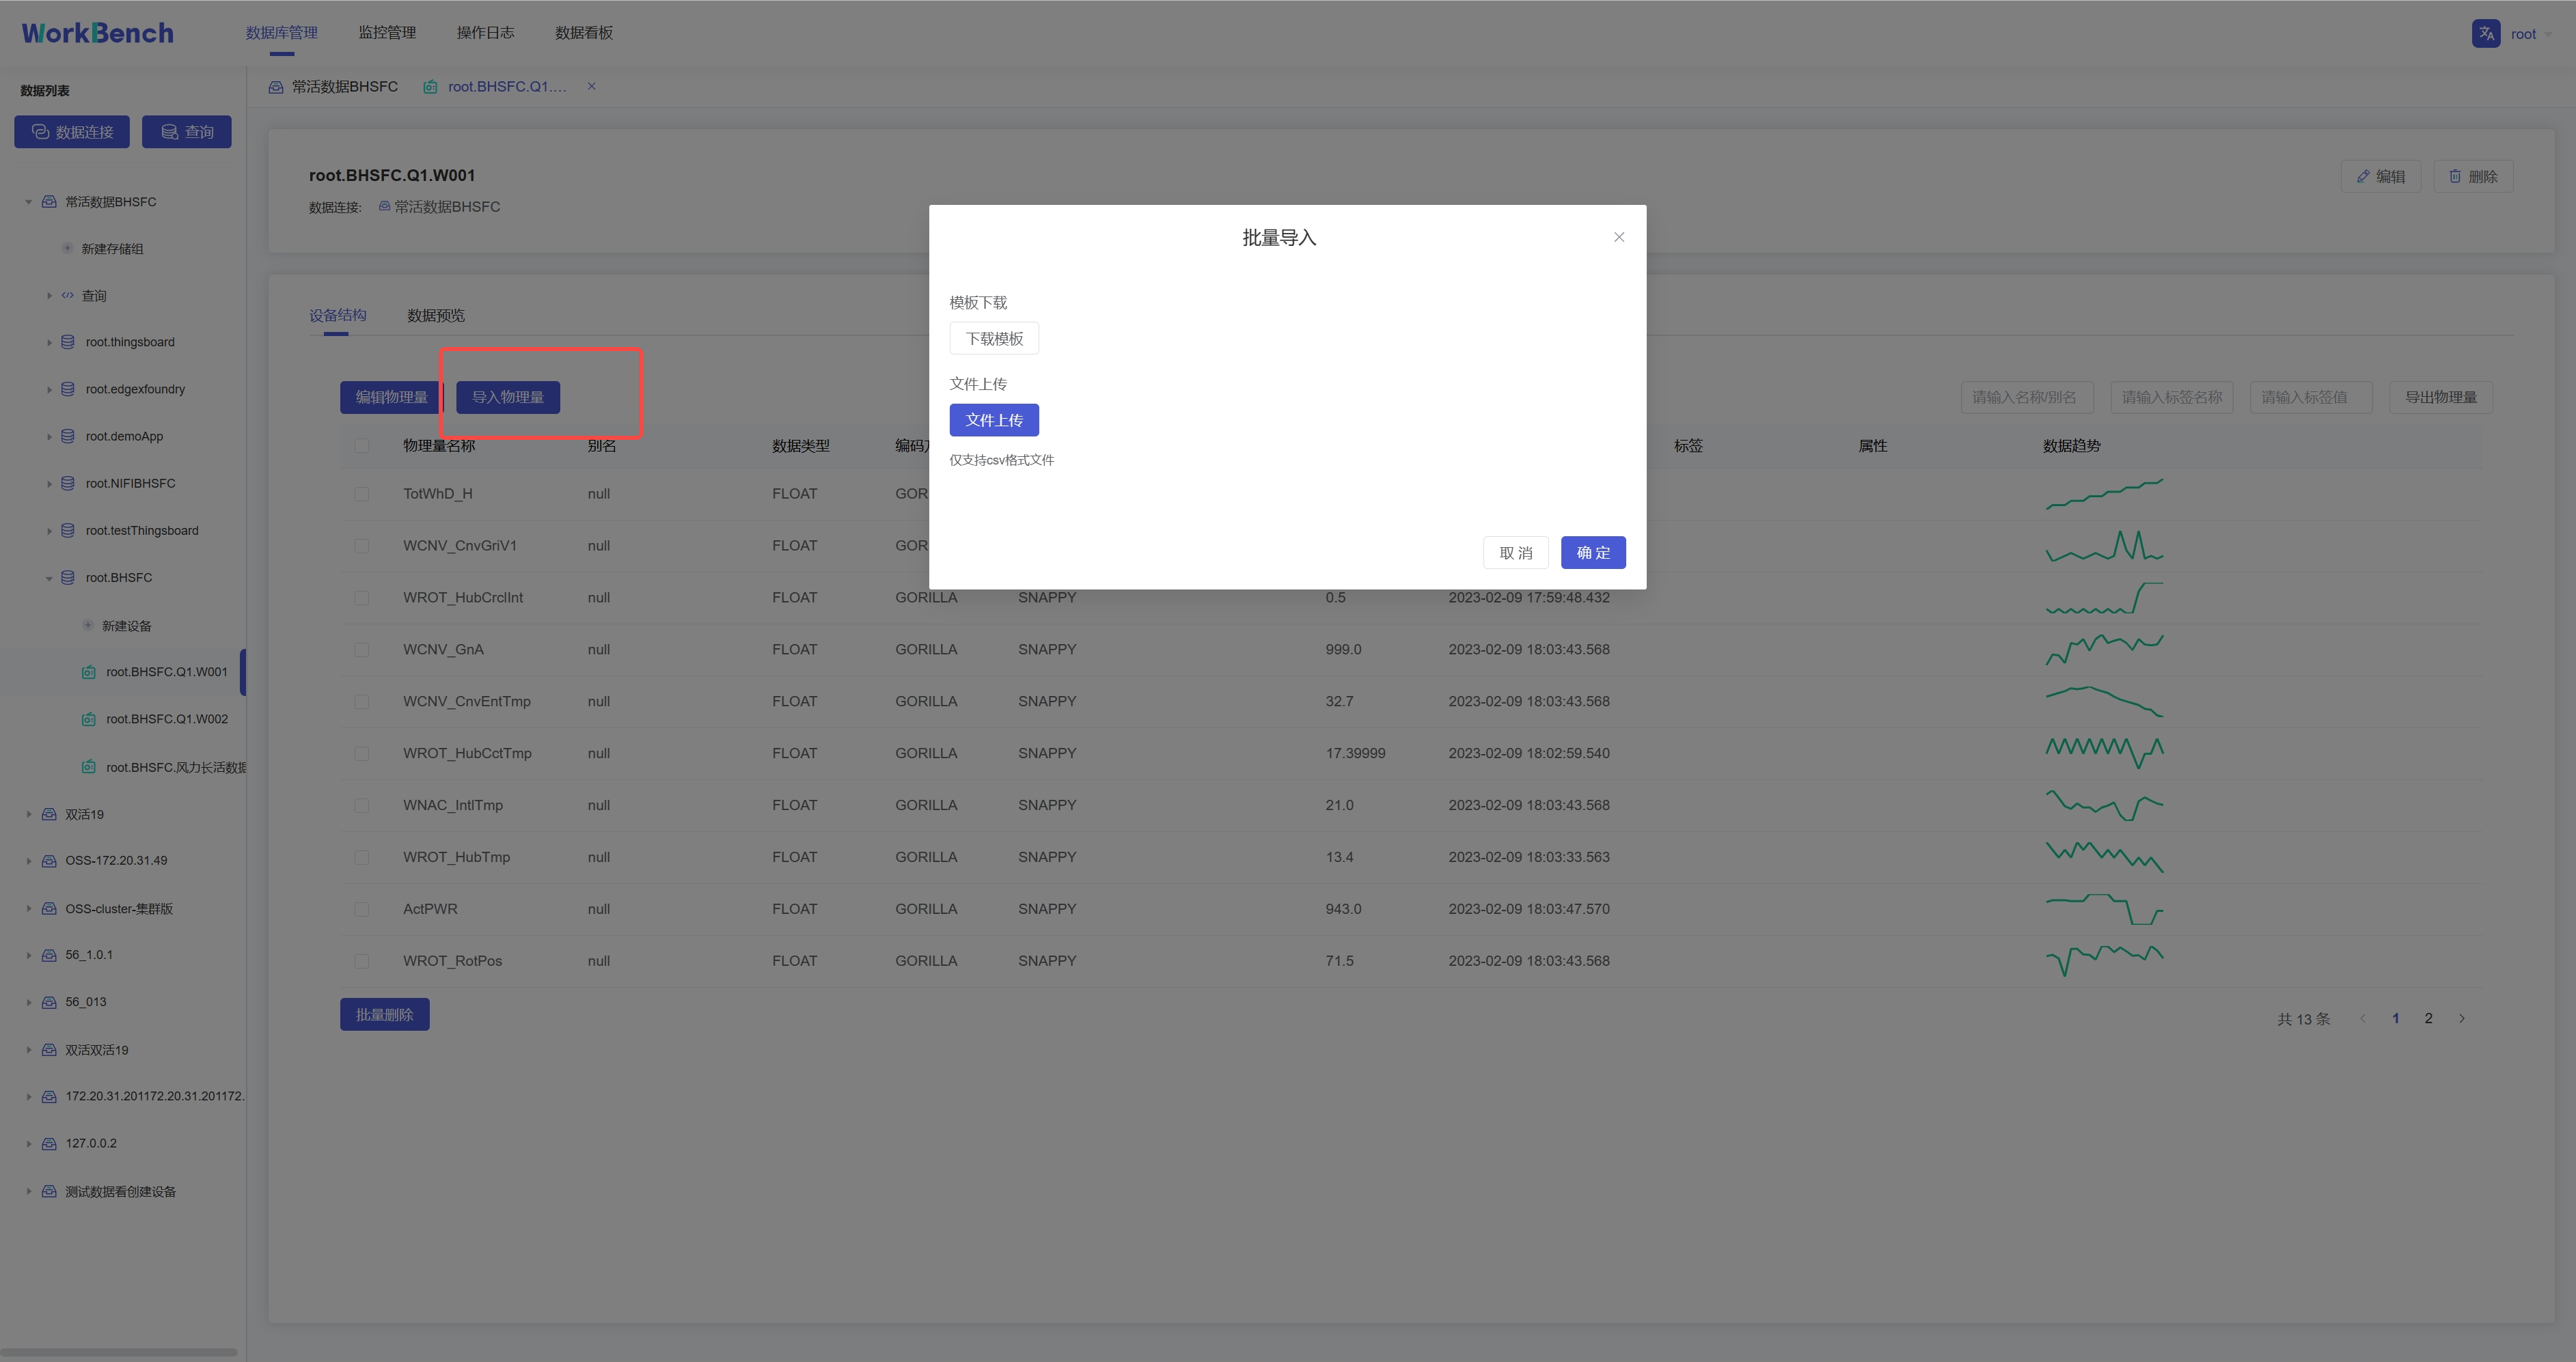
选择"**数据预览**"-\>"**批量导入**"则可将符合模板要求的CSV文件数据导入,当前支持导入对齐时间序列。
-
+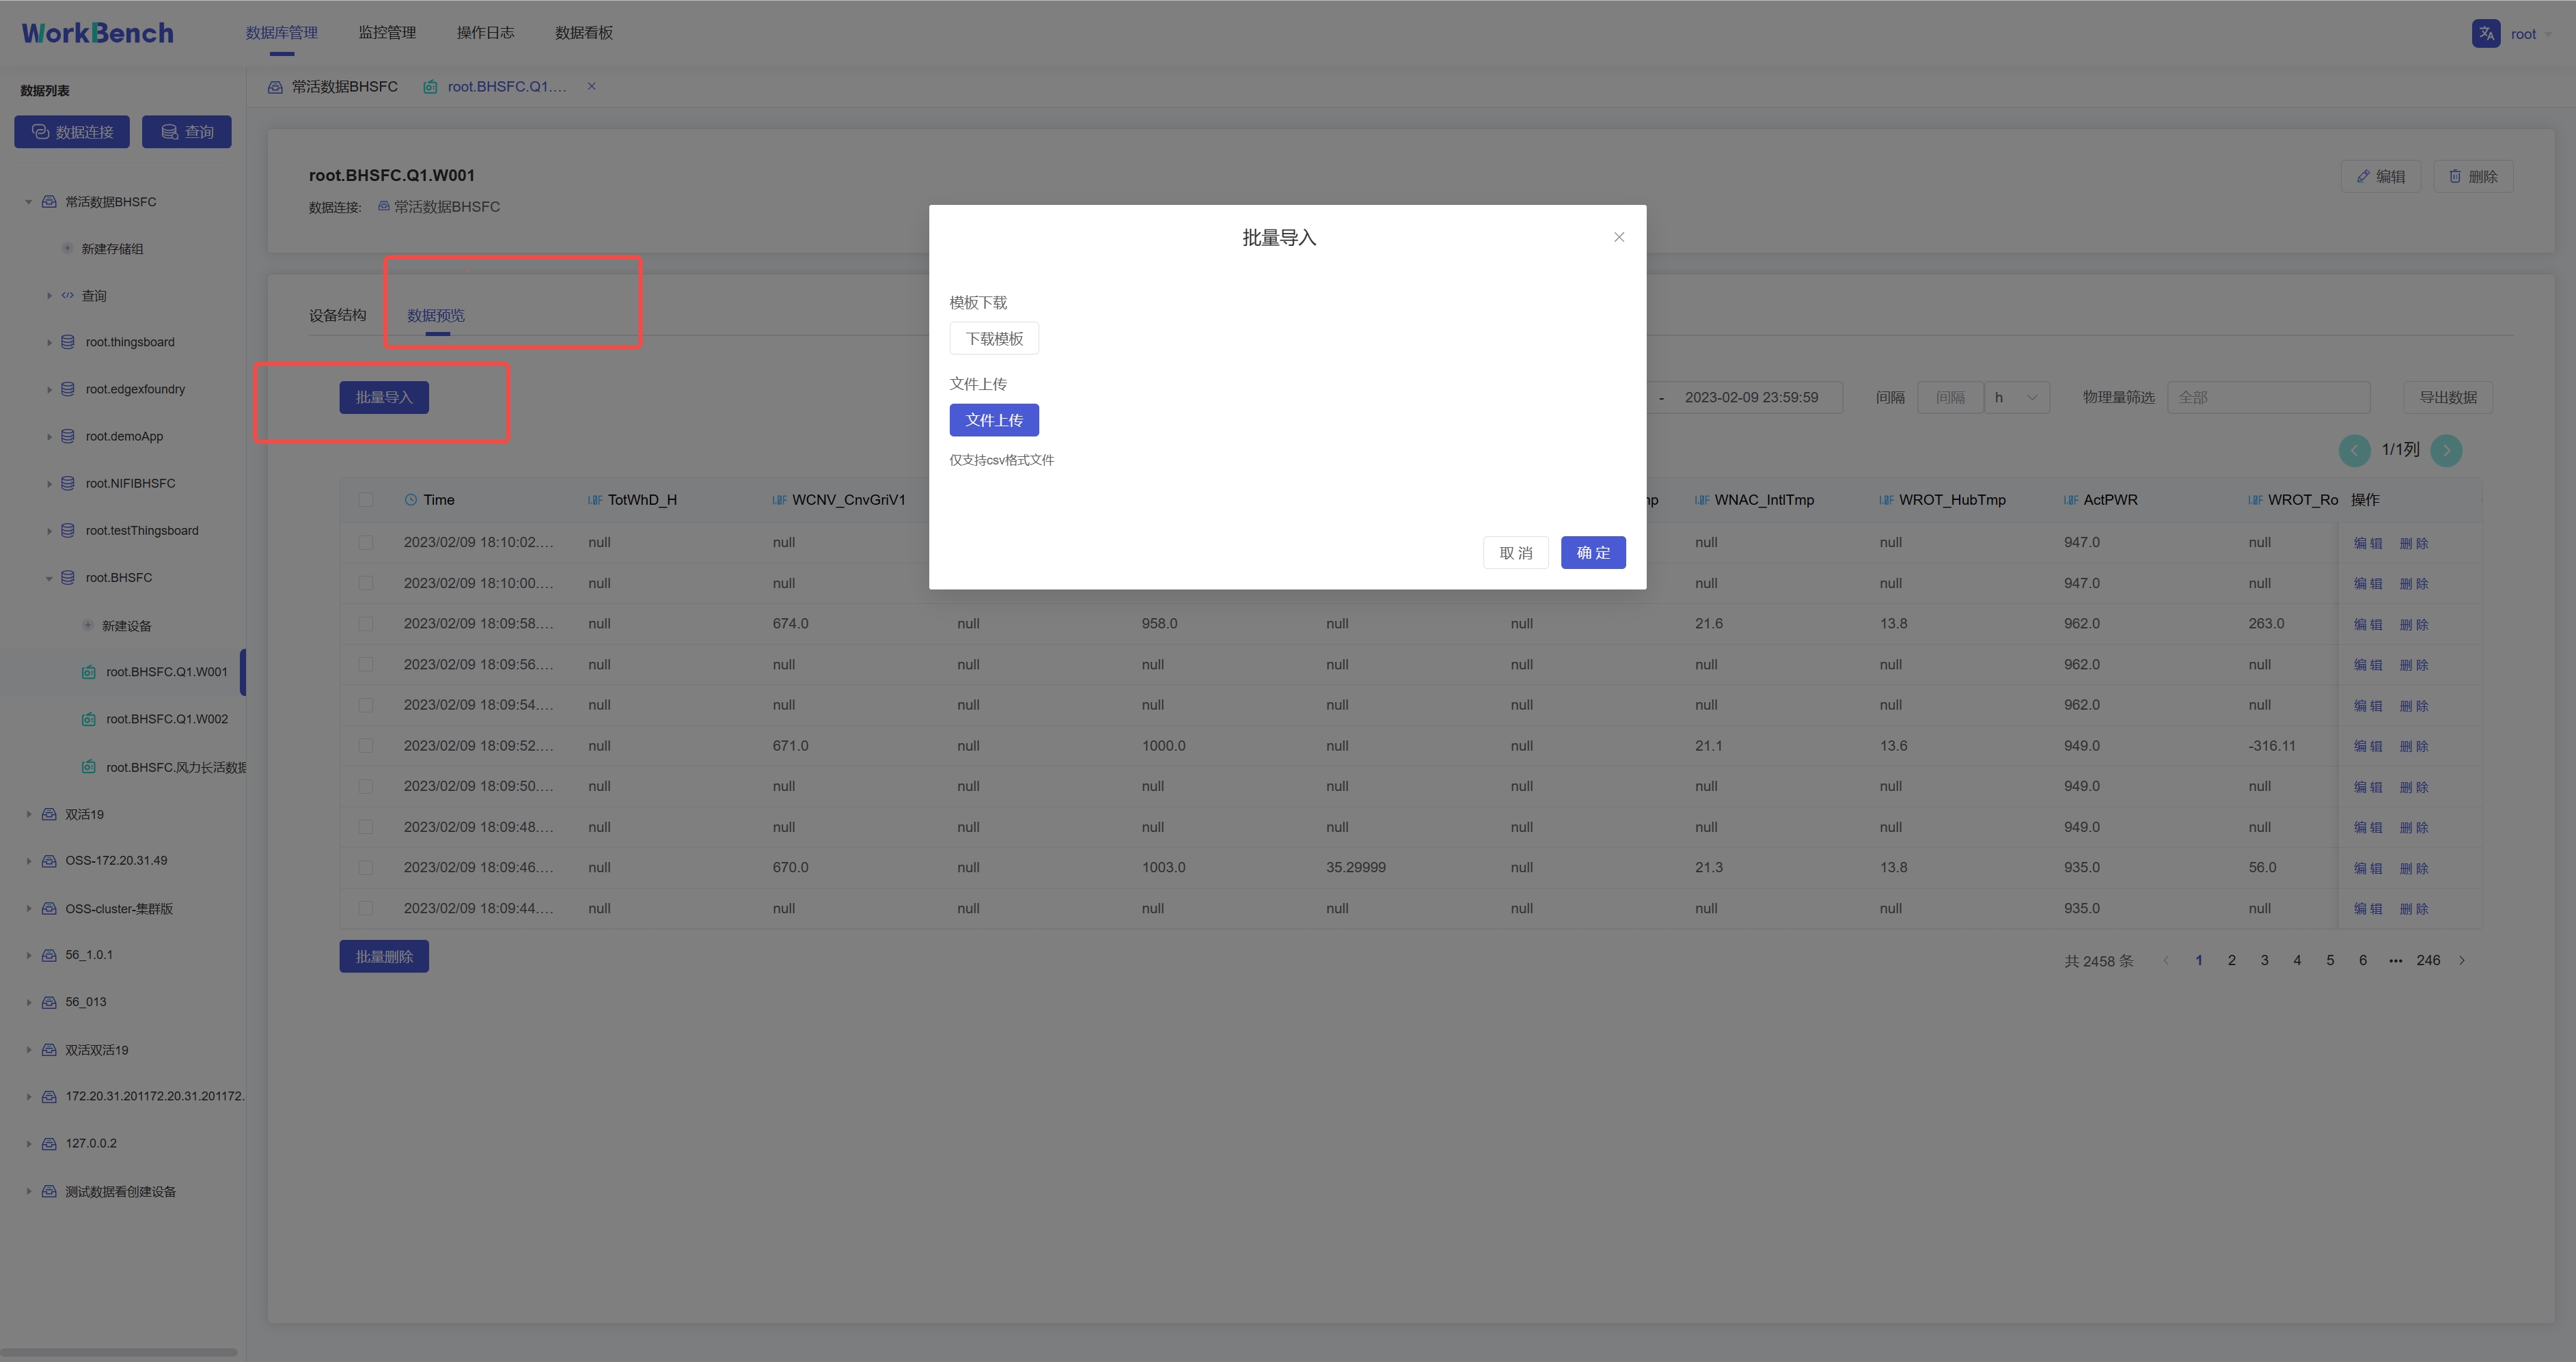
**批量导出**
批量导出功能仅在企业版中支持。在对象窗格中选择要操作的数据库,进入设备节点,选择"**设备结构**"-\>"**导出物理量**"即可批量导出该实体下的物理量元数据。搜索框内可输入名称/别名、标签名称、标签值进行过滤。
-
+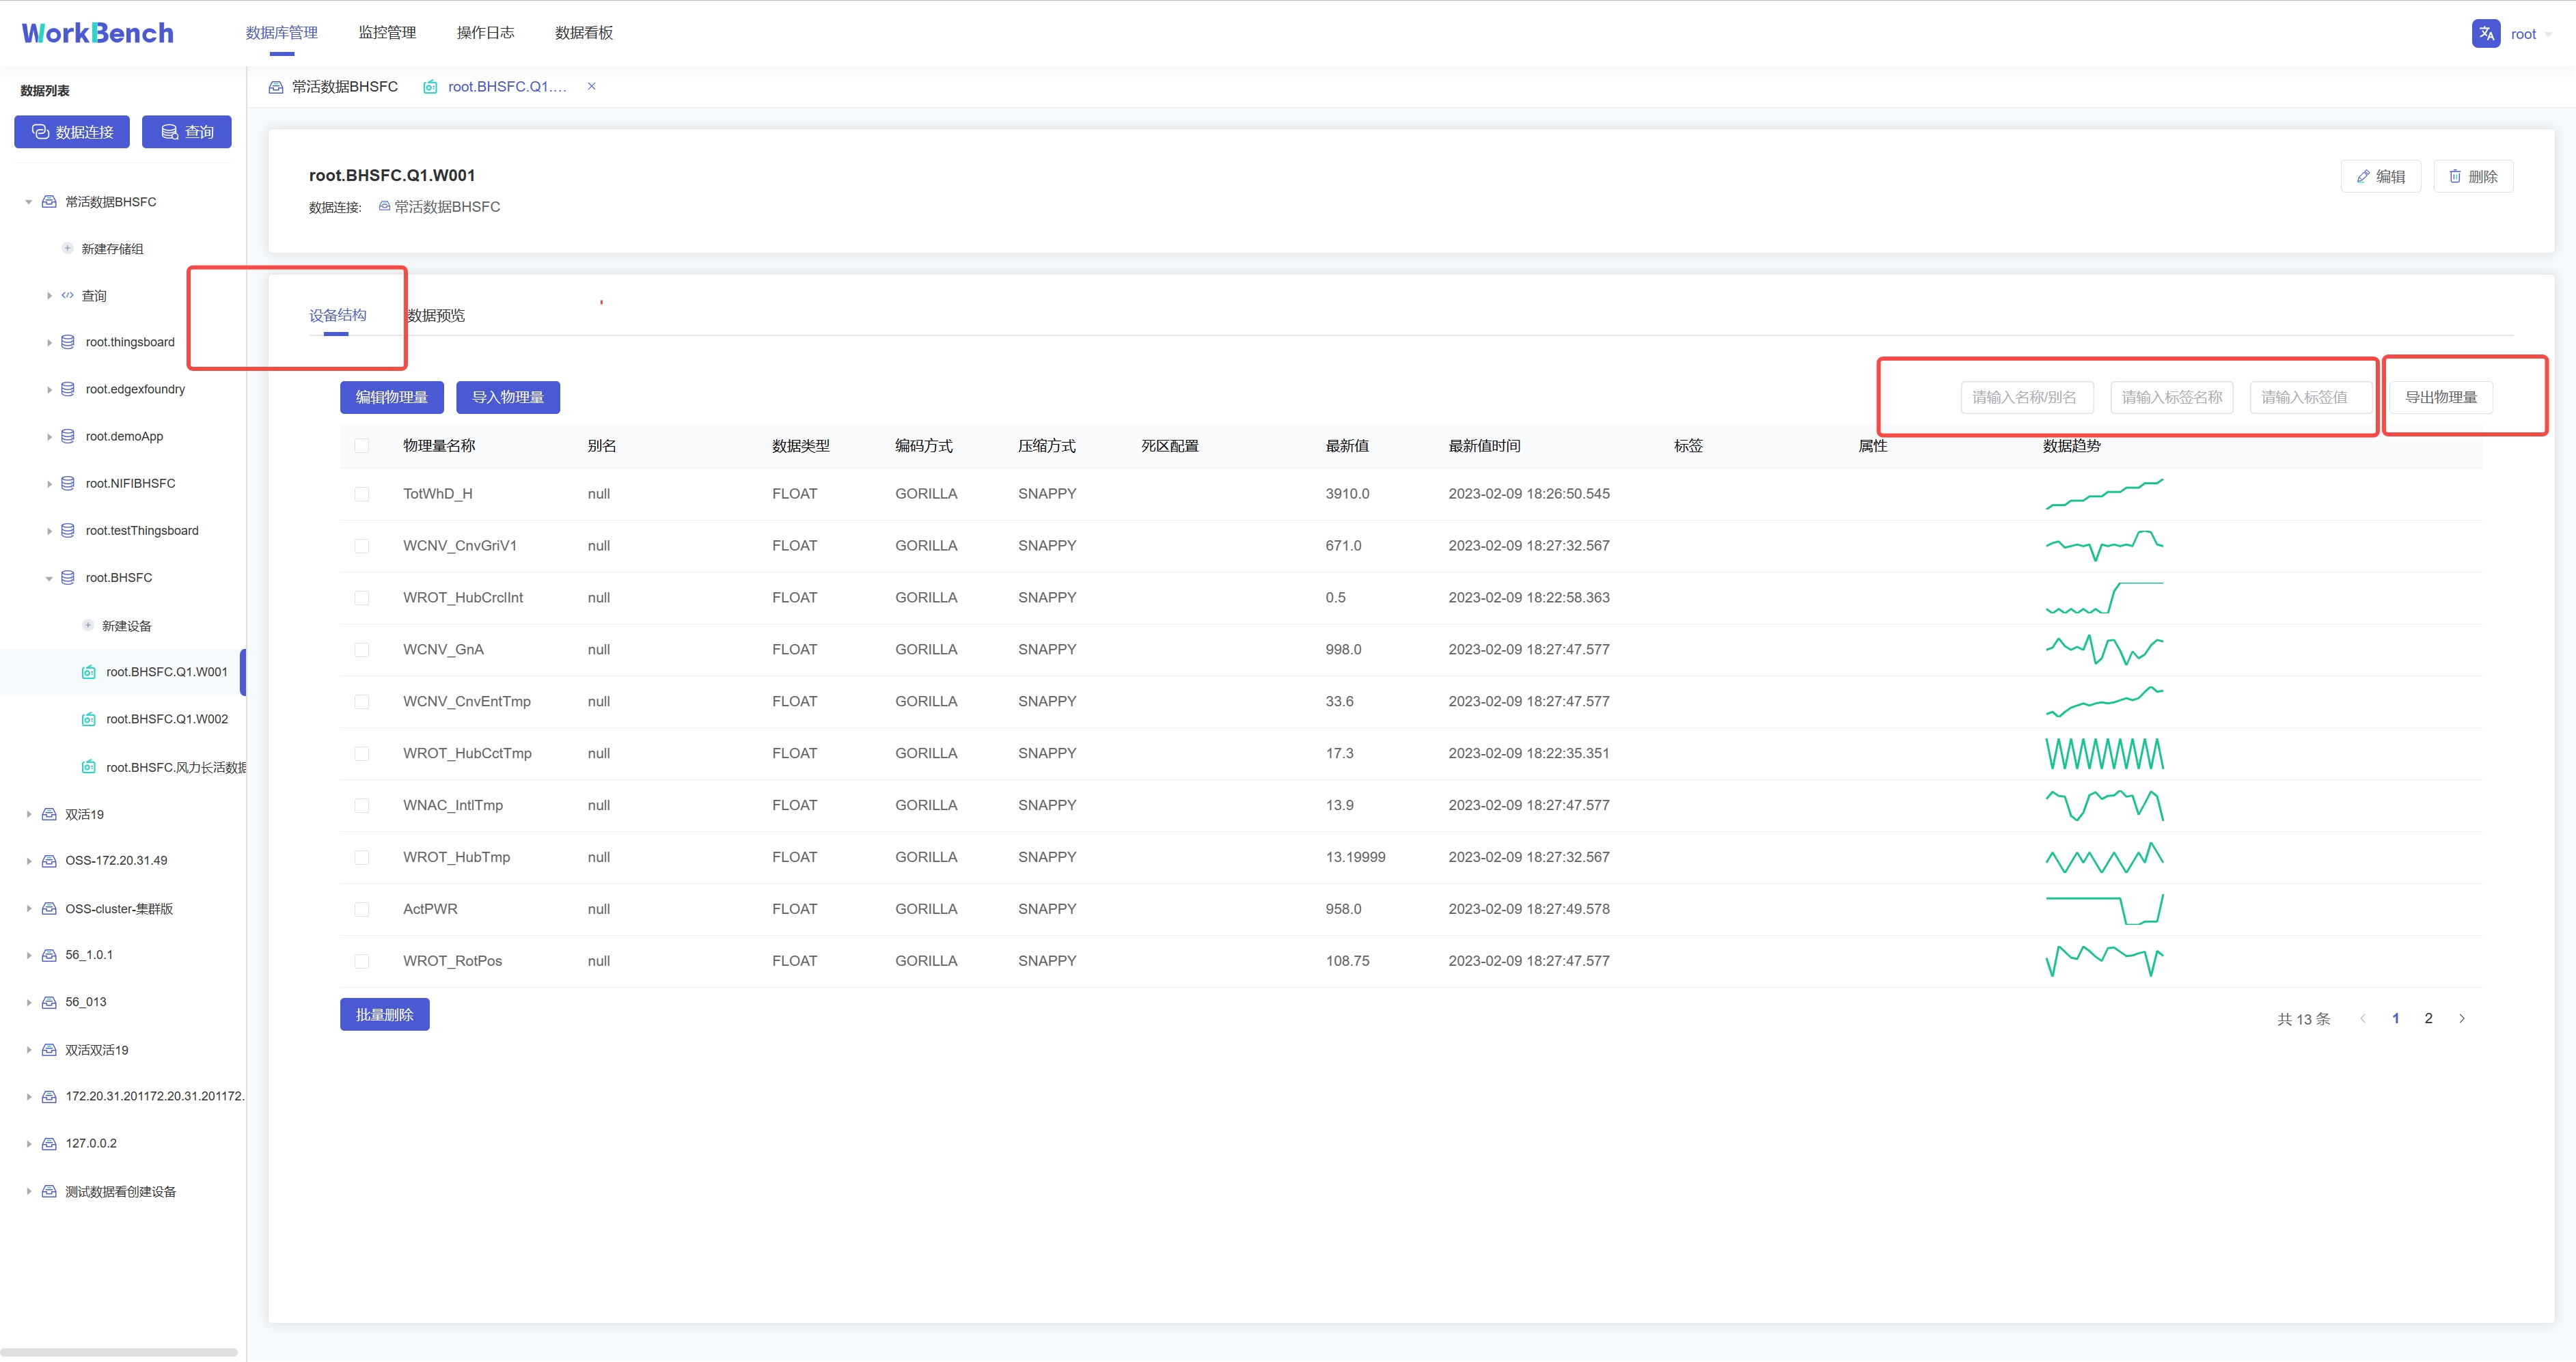
选择"**数据预览**"-\>"**导出数据**"则可批量导出该实体下的数据。搜索框内可按时间范围、时间间隔和物理量进行过滤。
-
+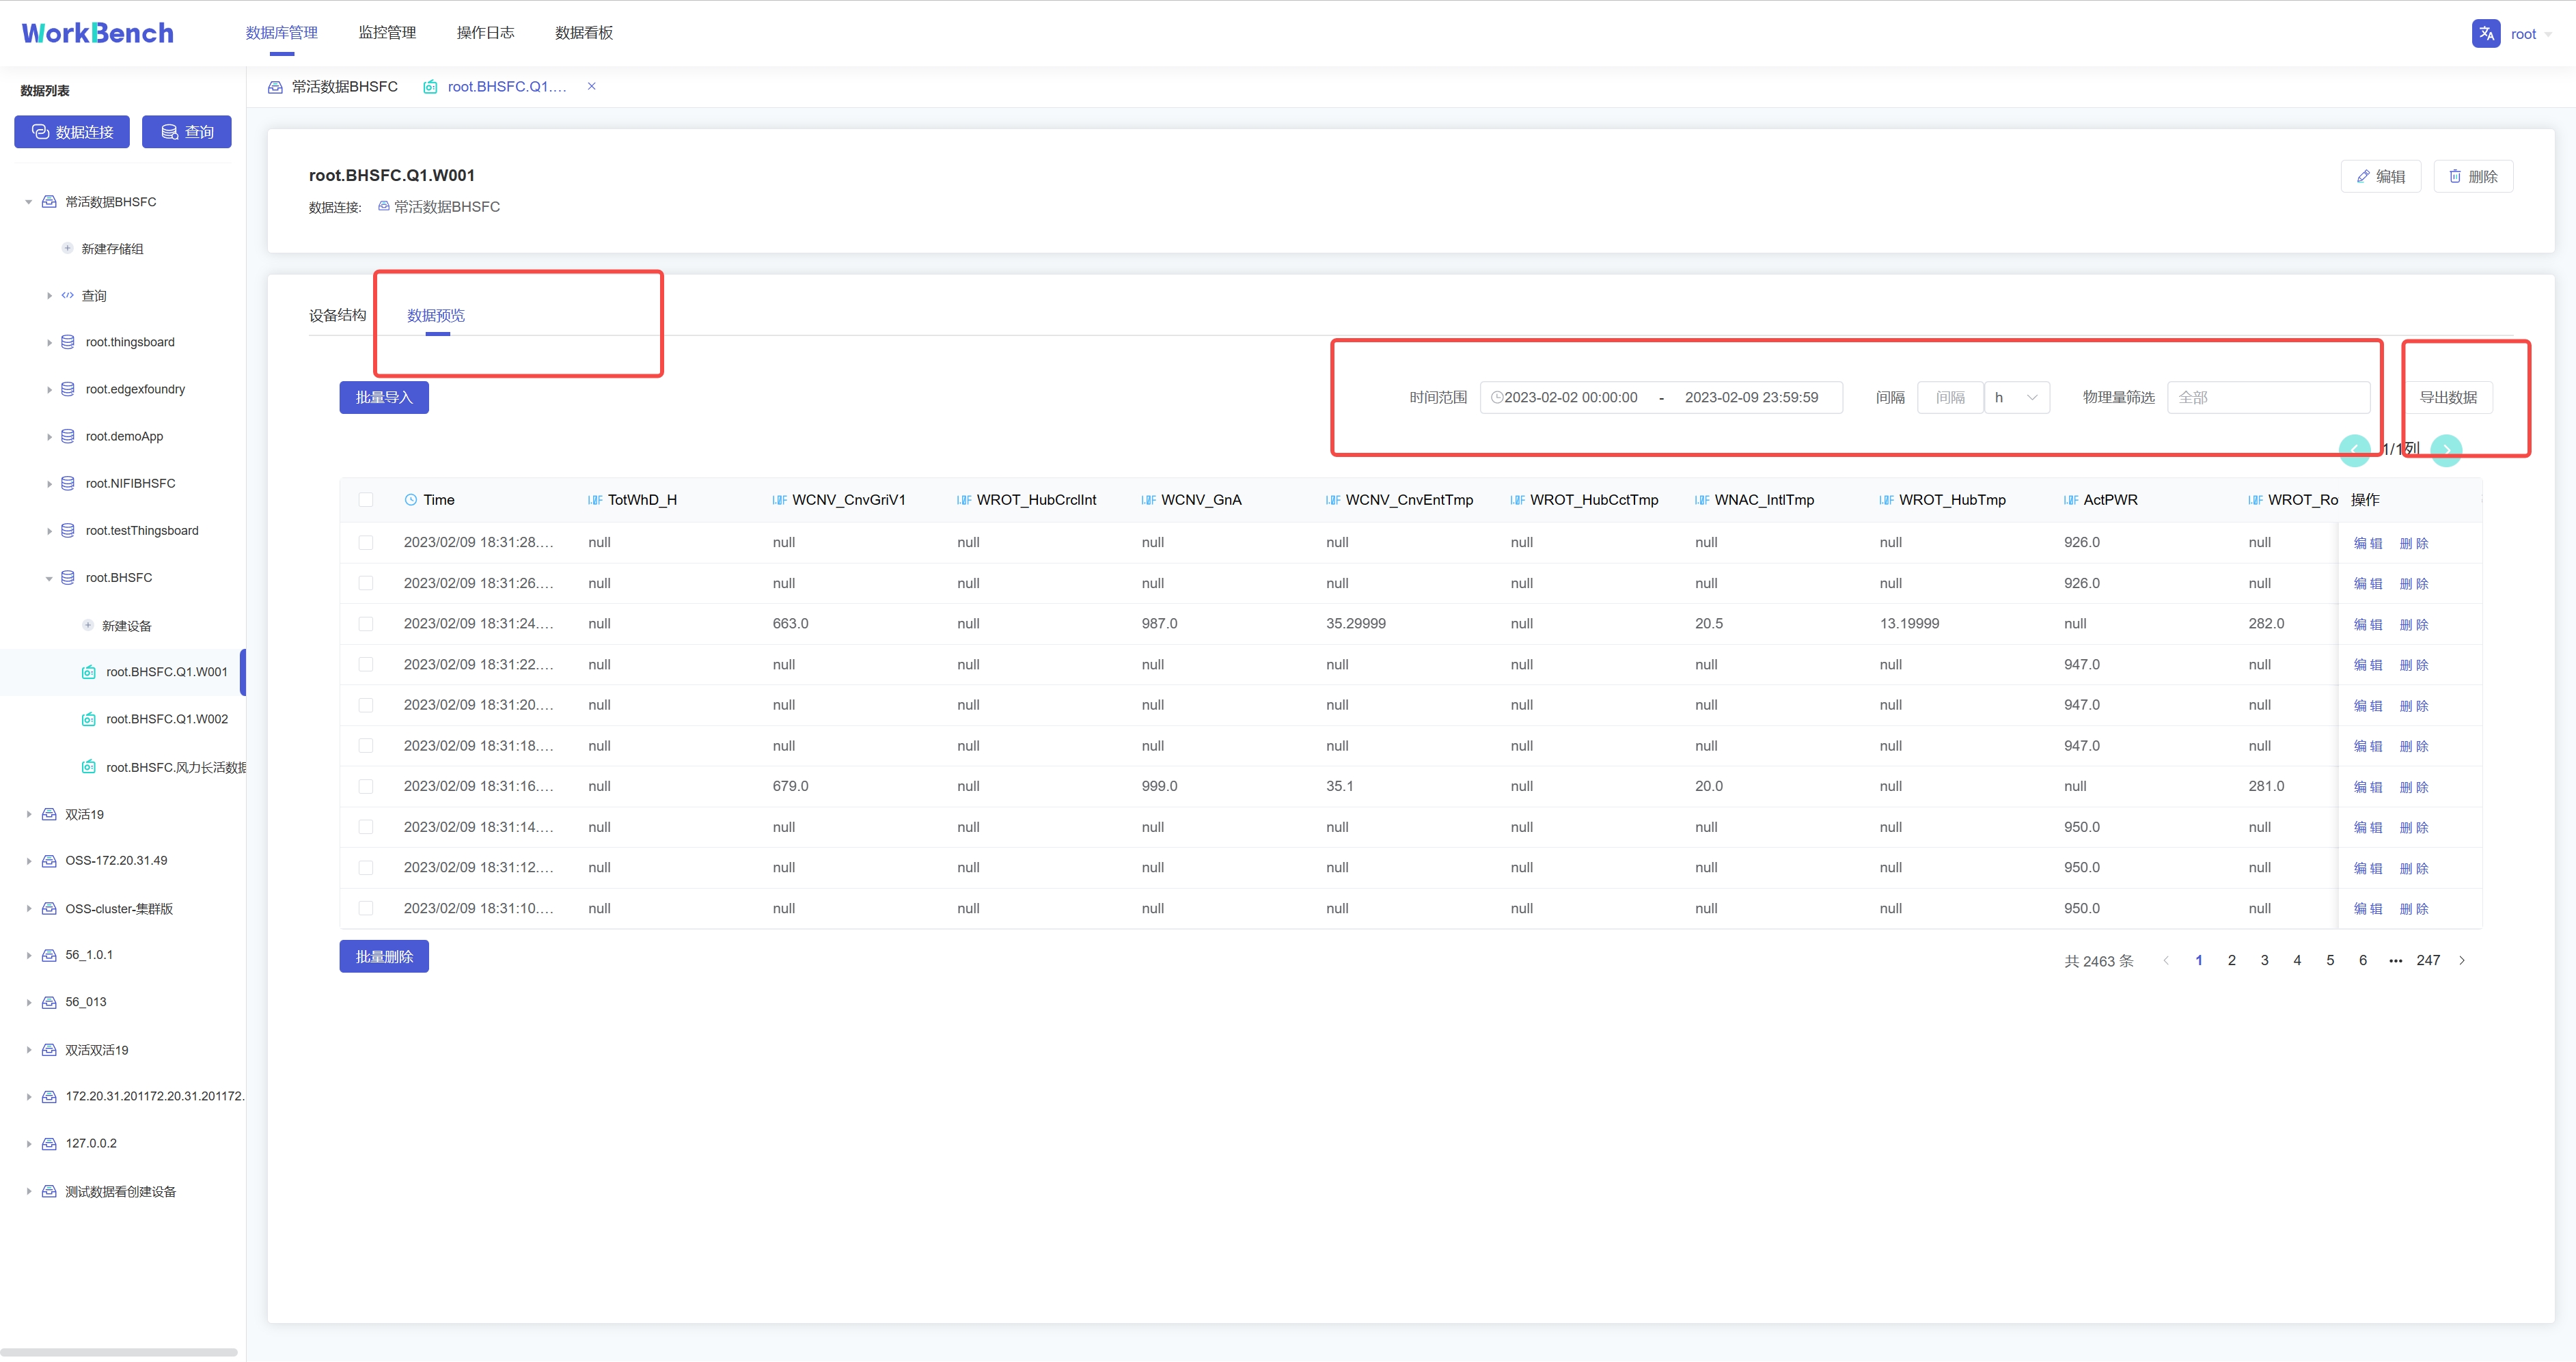
## 数据预览
@@ -227,13 +227,13 @@ Workbench提供多层次的数据预览工具。
在对象窗格中选择要预览的数据连接,点击操作列的"**数据模型**"即可预览数据模型,root被定义为LEVEL=0,Workbench中默认显示到LEVEL=1,点击"**查看更多**"可查看更多层级的数据模型信息。"**查看更多**"功能仅在企业版中支持。
-
+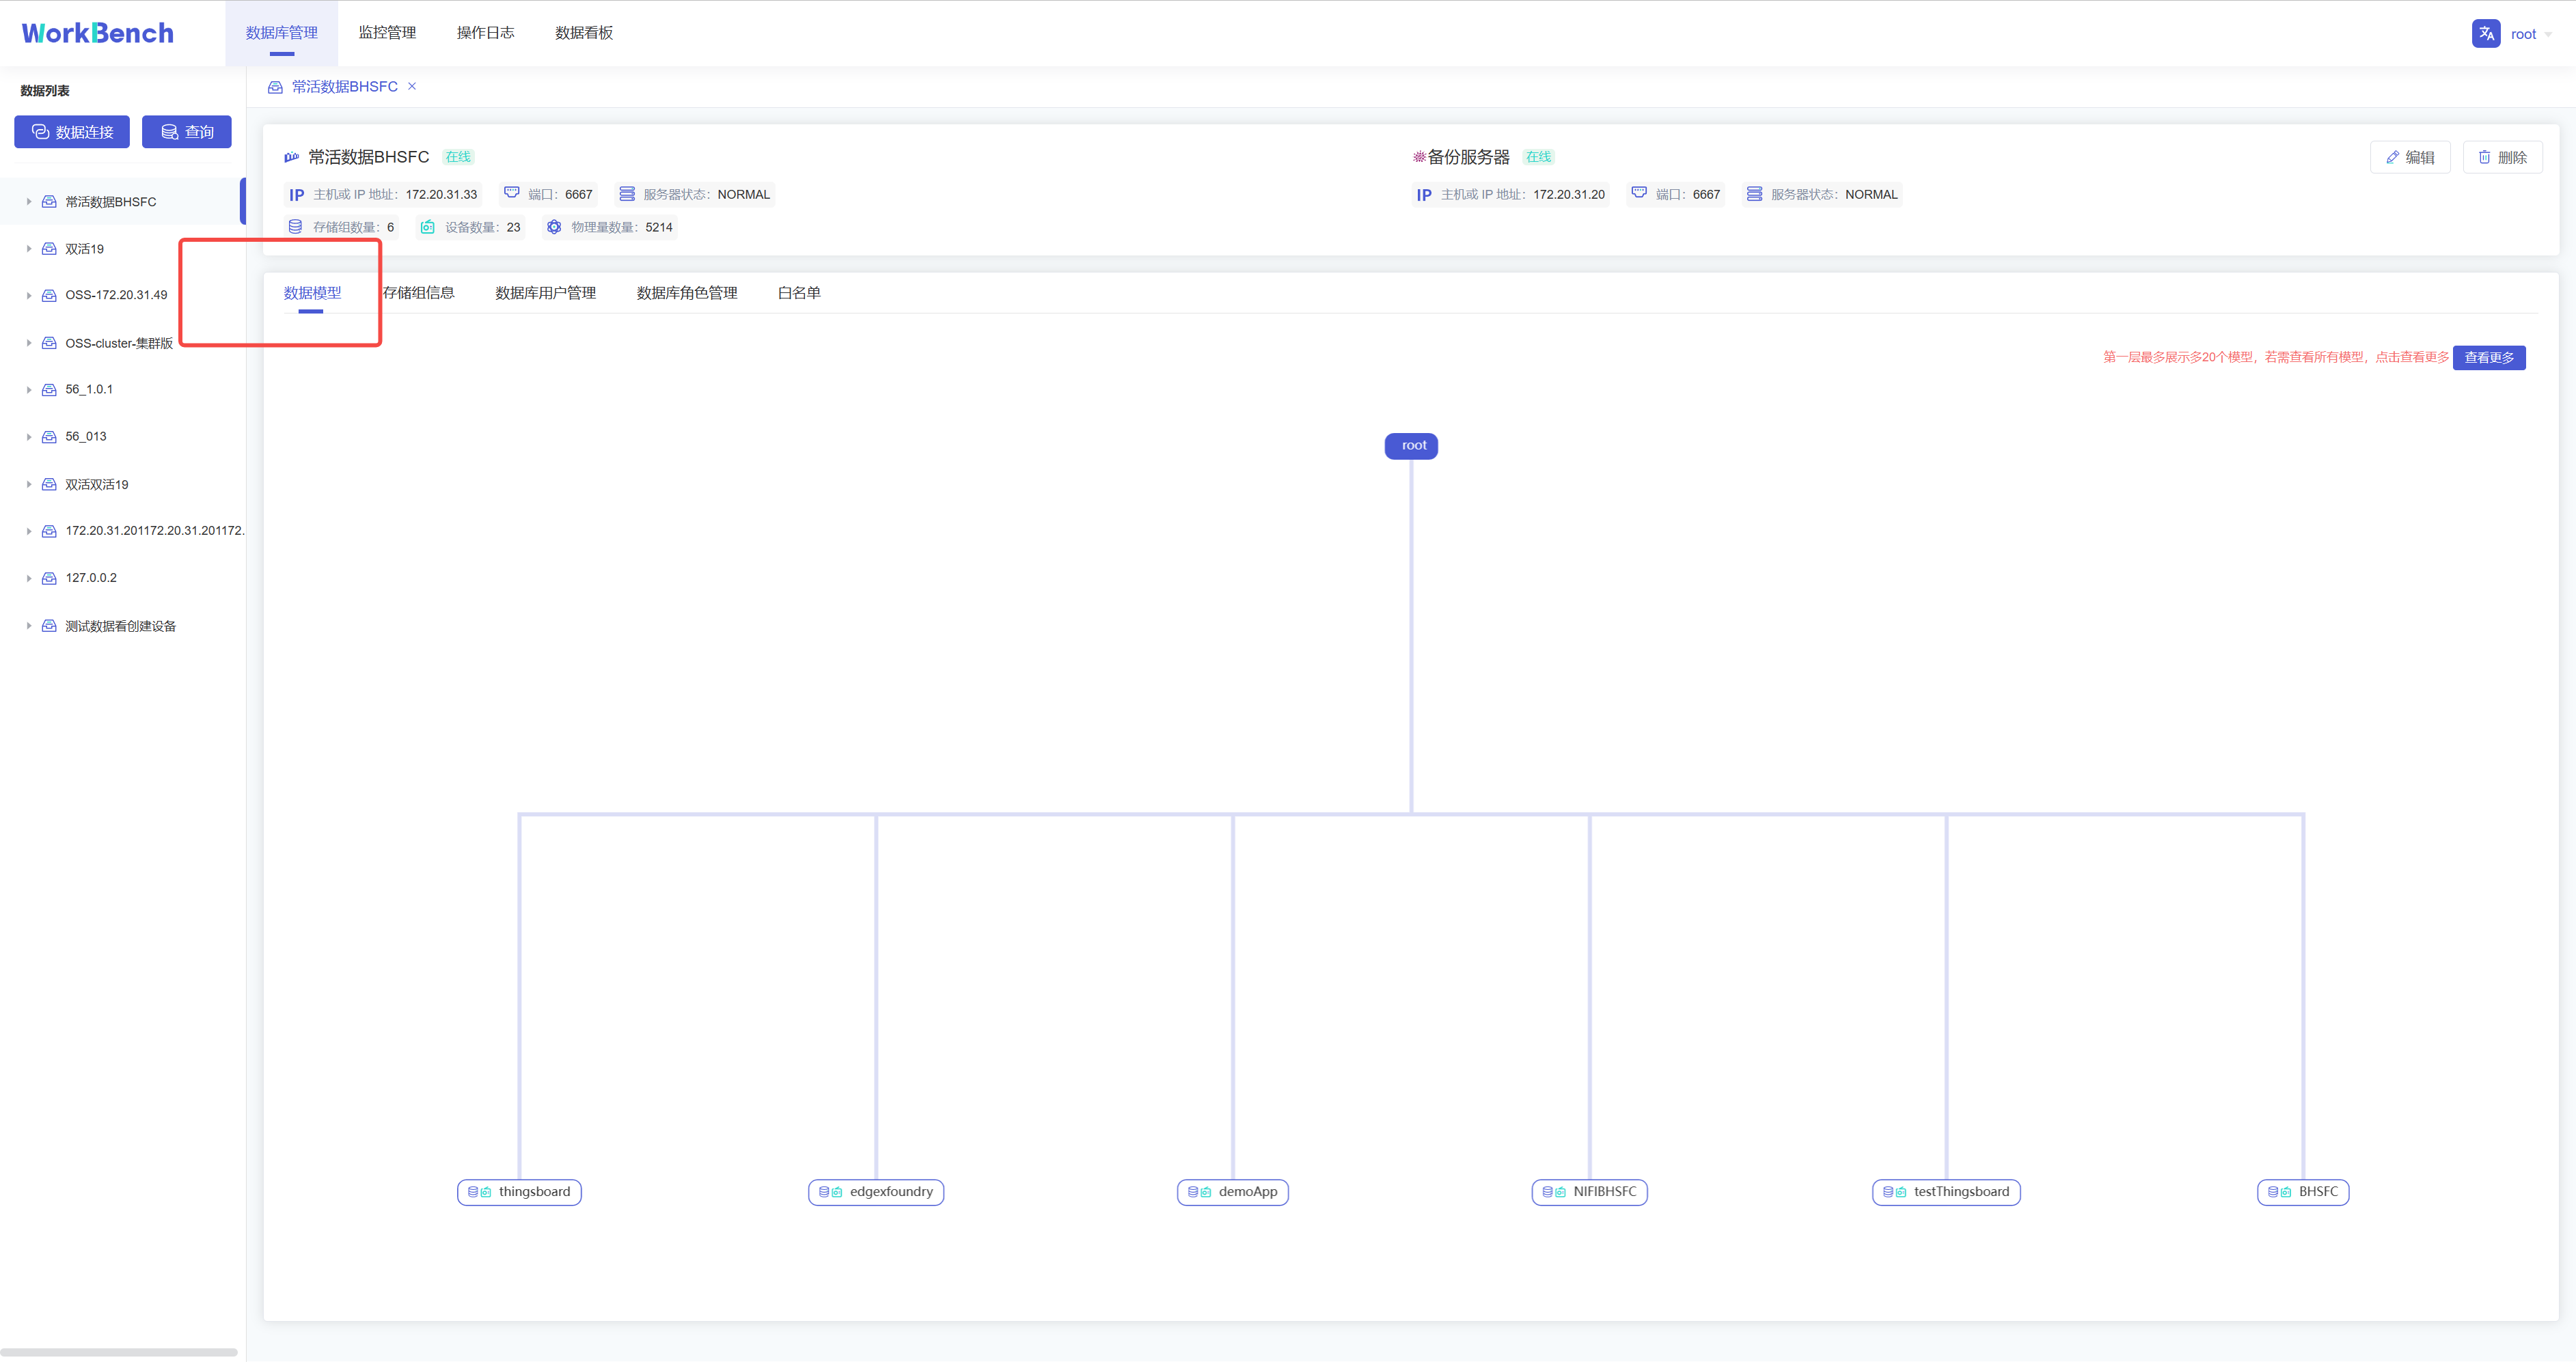
**存储组信息**
点击操作列的"**存储组信息**"即可预览该数据连接的所有存储组信息,点击"**详情**"可查看该存储组下的实体详情,继续点击实体详情可查看物理量详情。点击"**编辑**"可编辑该存储组的TTL信息。
-
+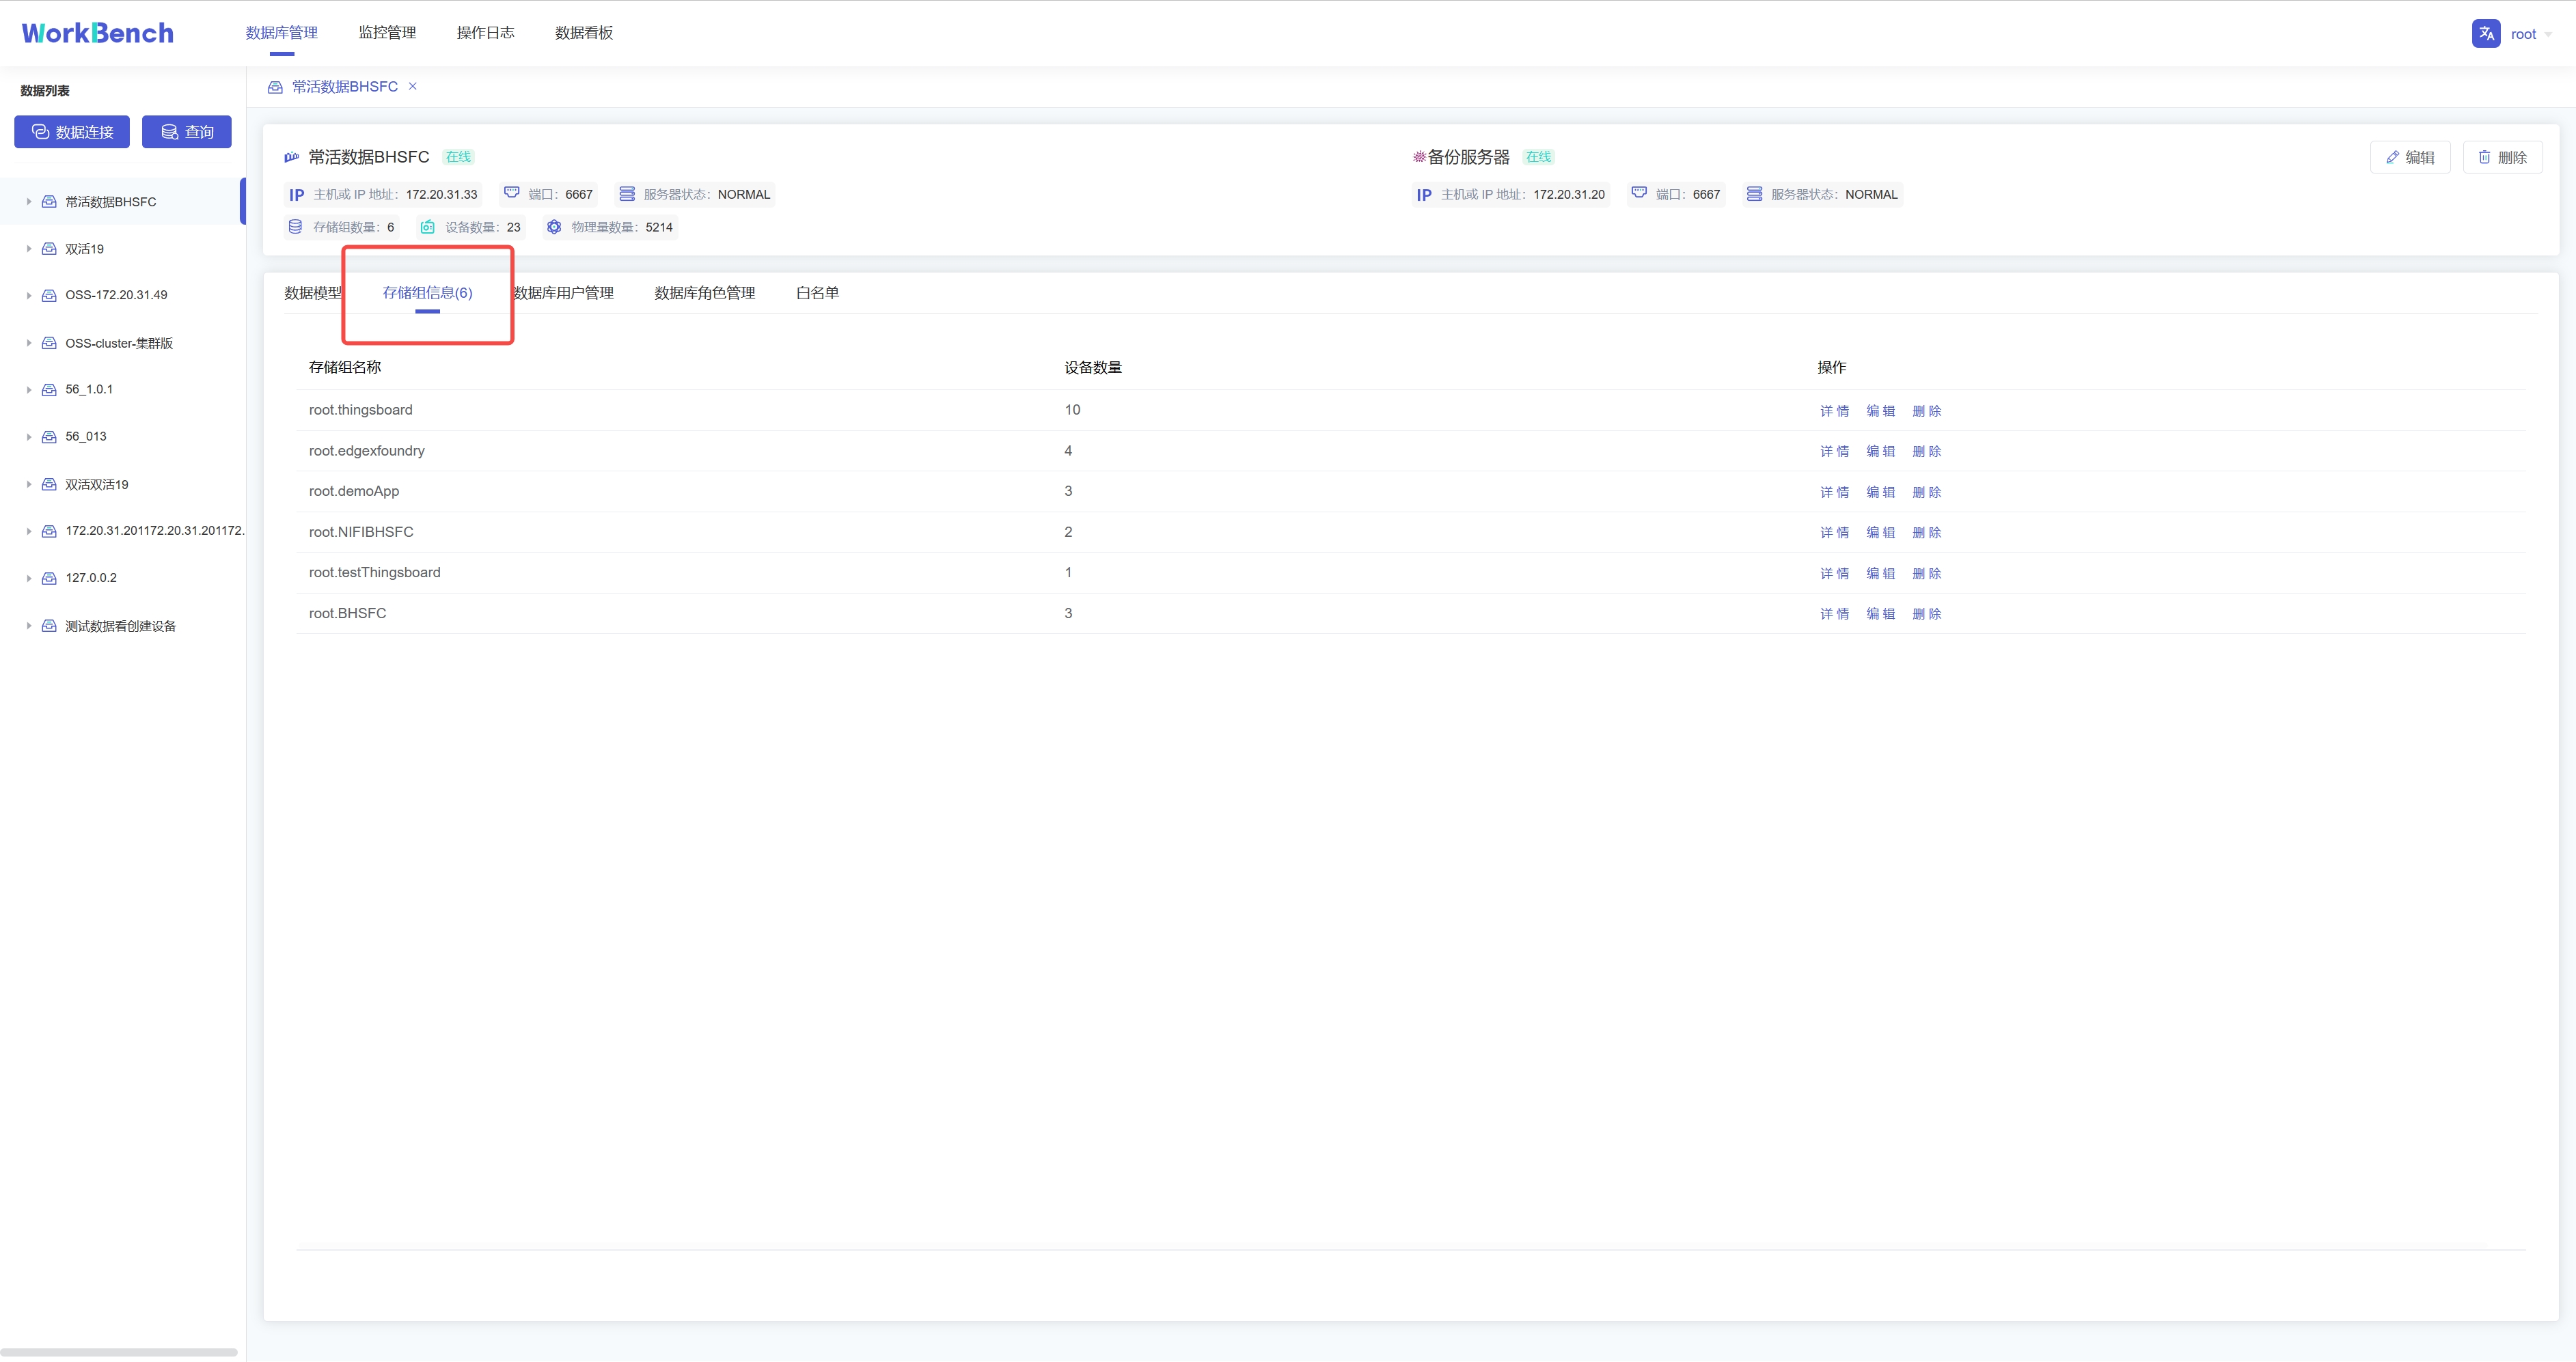
## 查询
@@ -243,21 +243,21 @@ Workbench提供强大的查询工具,可直接编辑查询文本,保存查
点击"**连接操作栏**"的"**查询**",选择要进行操作的数据连接,即可进入查询编辑器。
-
+
在查询编辑器界面可输入SQL语句,提示框会提示符合条件的关键字。右侧可按要求选择函数或数据进行计算。
-{width="5.90625in" height="3.125in"}
+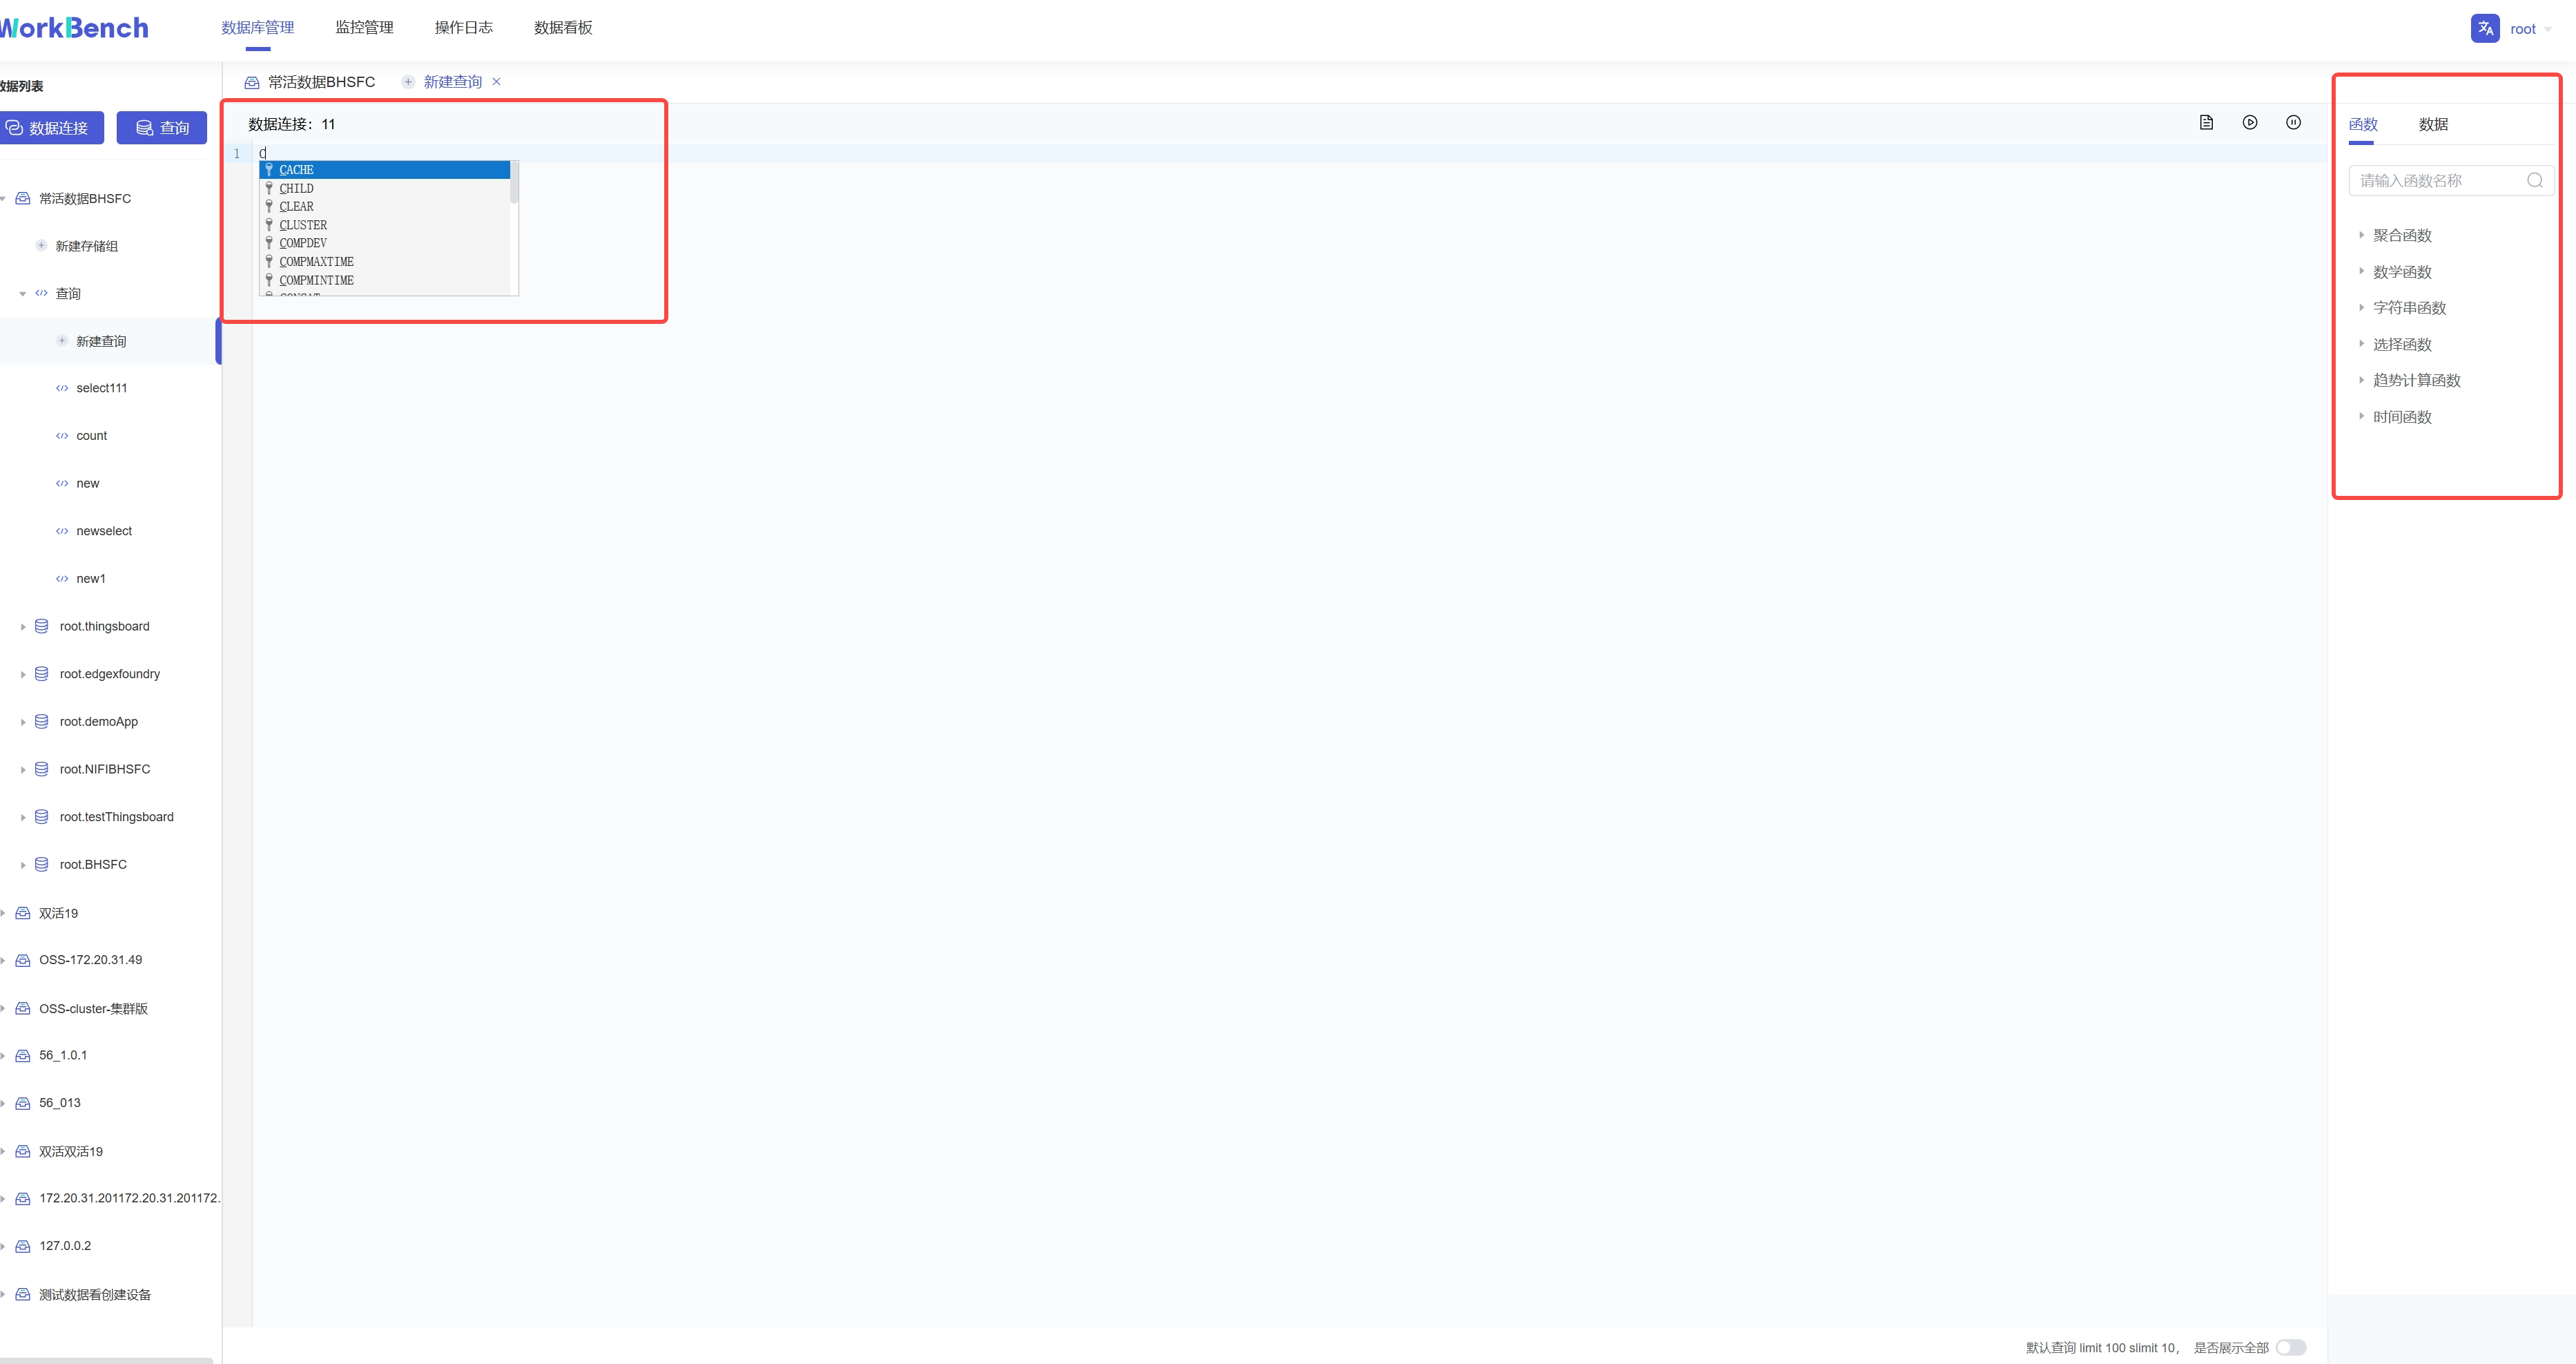{width="5.90625in" height="3.125in"}
输入SQL语句后,点击右上角可选择操作,分别是"保存"、"运行"、"暂停"和"删除"。运行结果显示10行每页,默认限制返回结果100行,也可选择取消限制全部展示。
-
+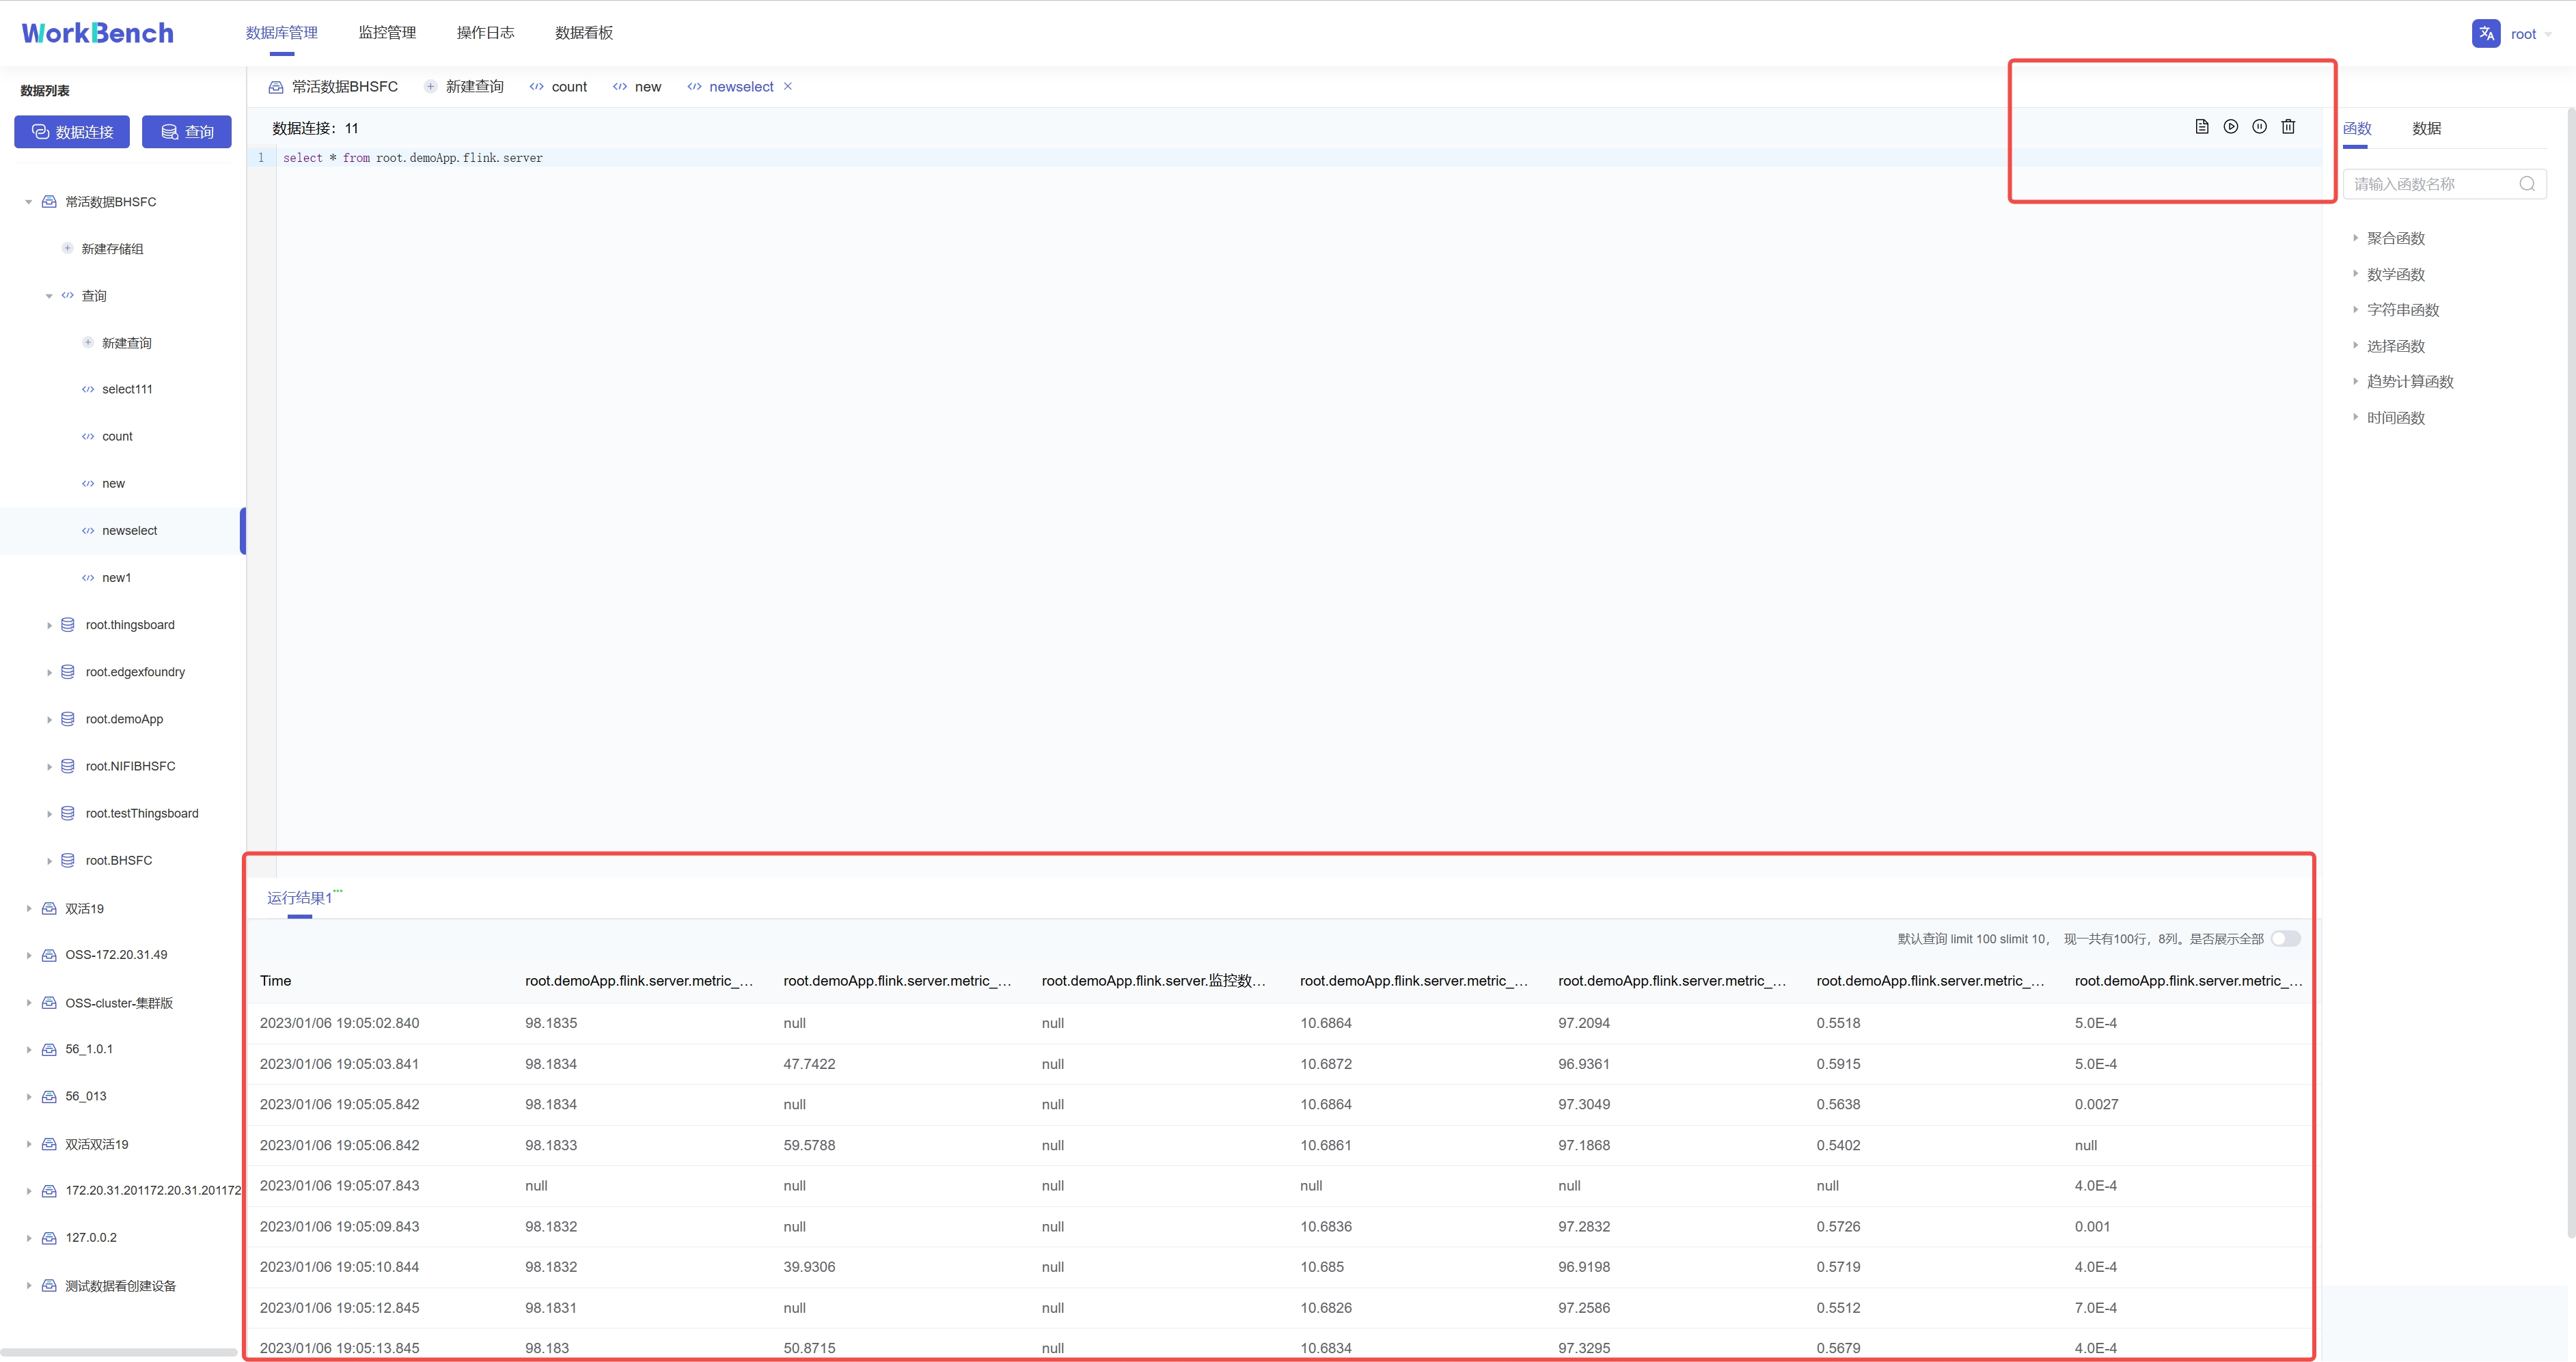
**查看查询**
已保存的连接可在对象窗格中该数据连接下的"**查询**"下查看。
-
+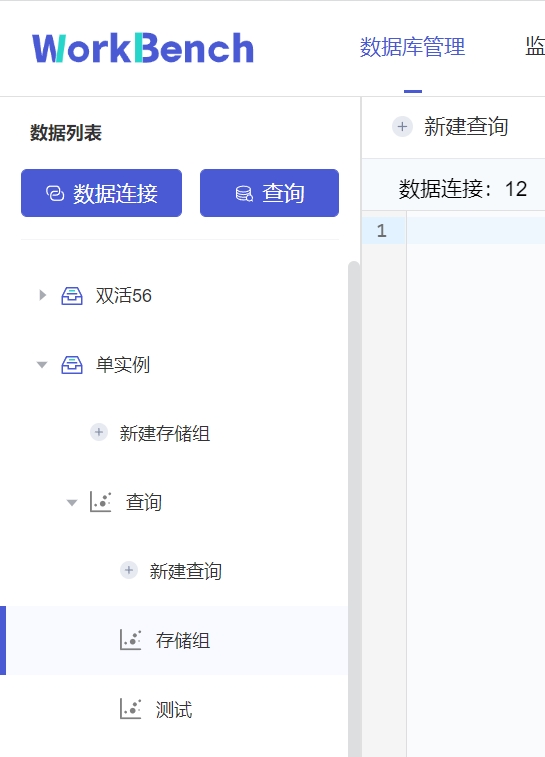
## 集群管理
@@ -265,23 +265,23 @@ Workbench提供强大的查询工具,可直接编辑查询文本,保存查
Workbench提供对集群拓扑图的查看。选择"**数据库管理**"-\>"**节点管理**"\>"**拓扑管理**"可以查看拓扑图。"拓扑管理"功能仅在企业版中支持。
-
+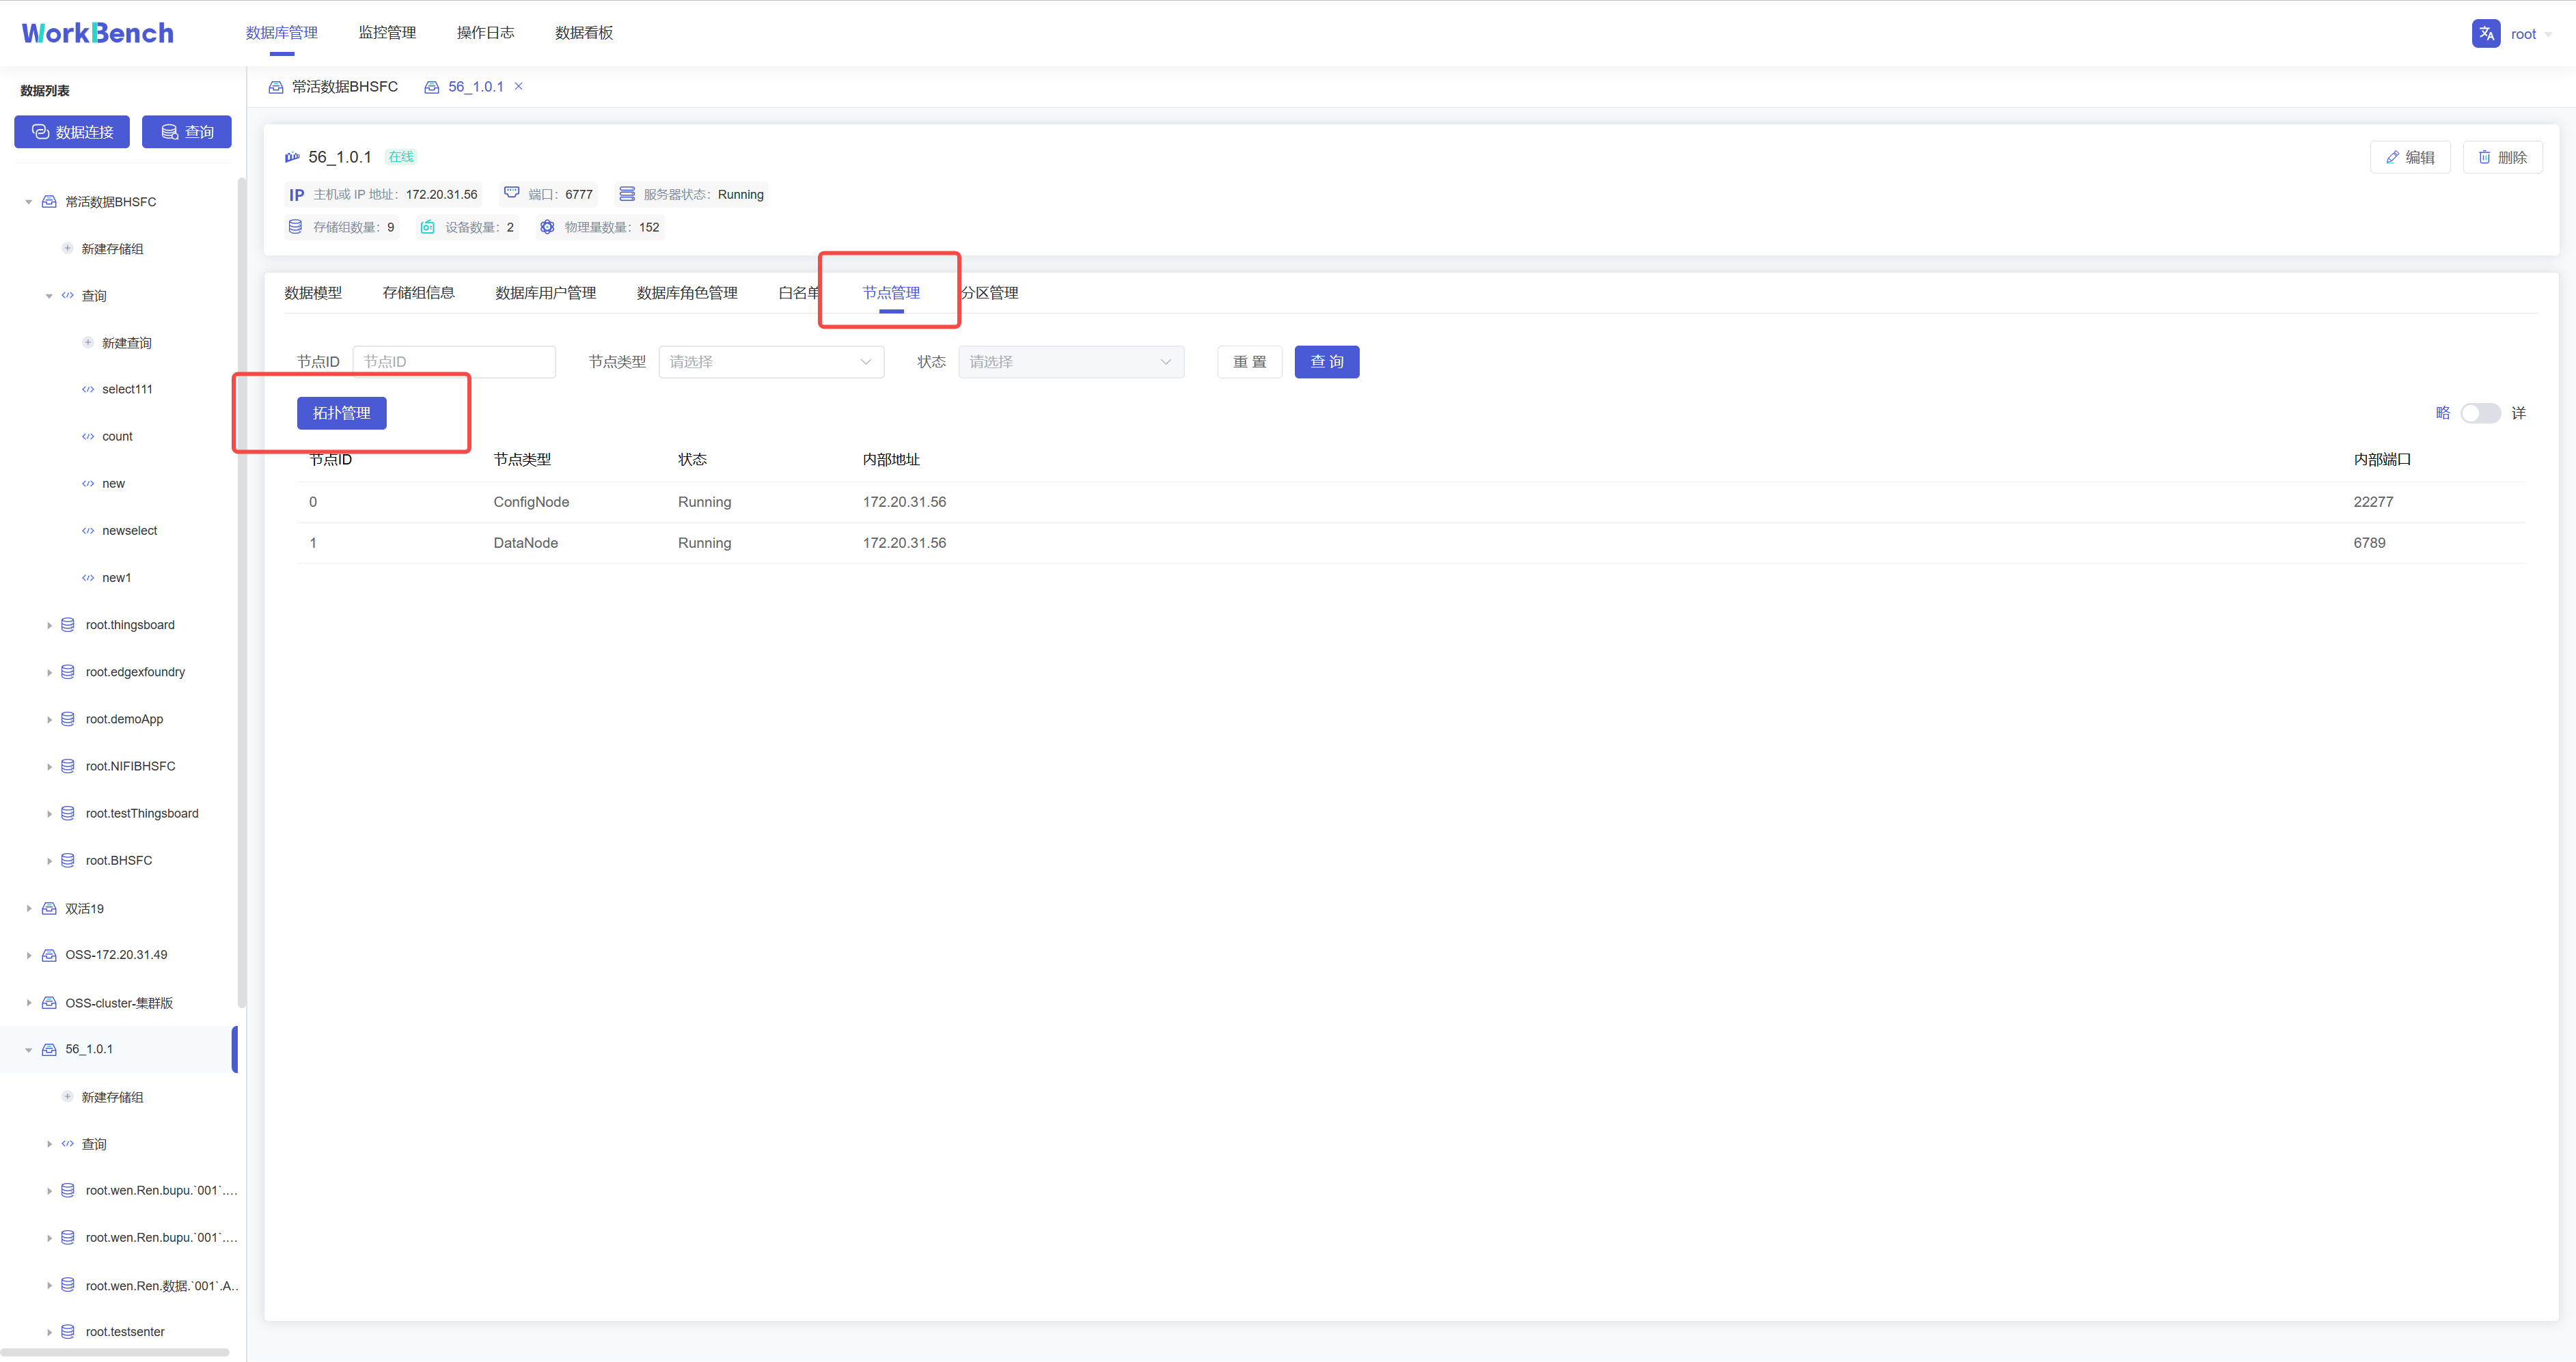
拓扑图显示节点IP、节点类型及端口。
-
+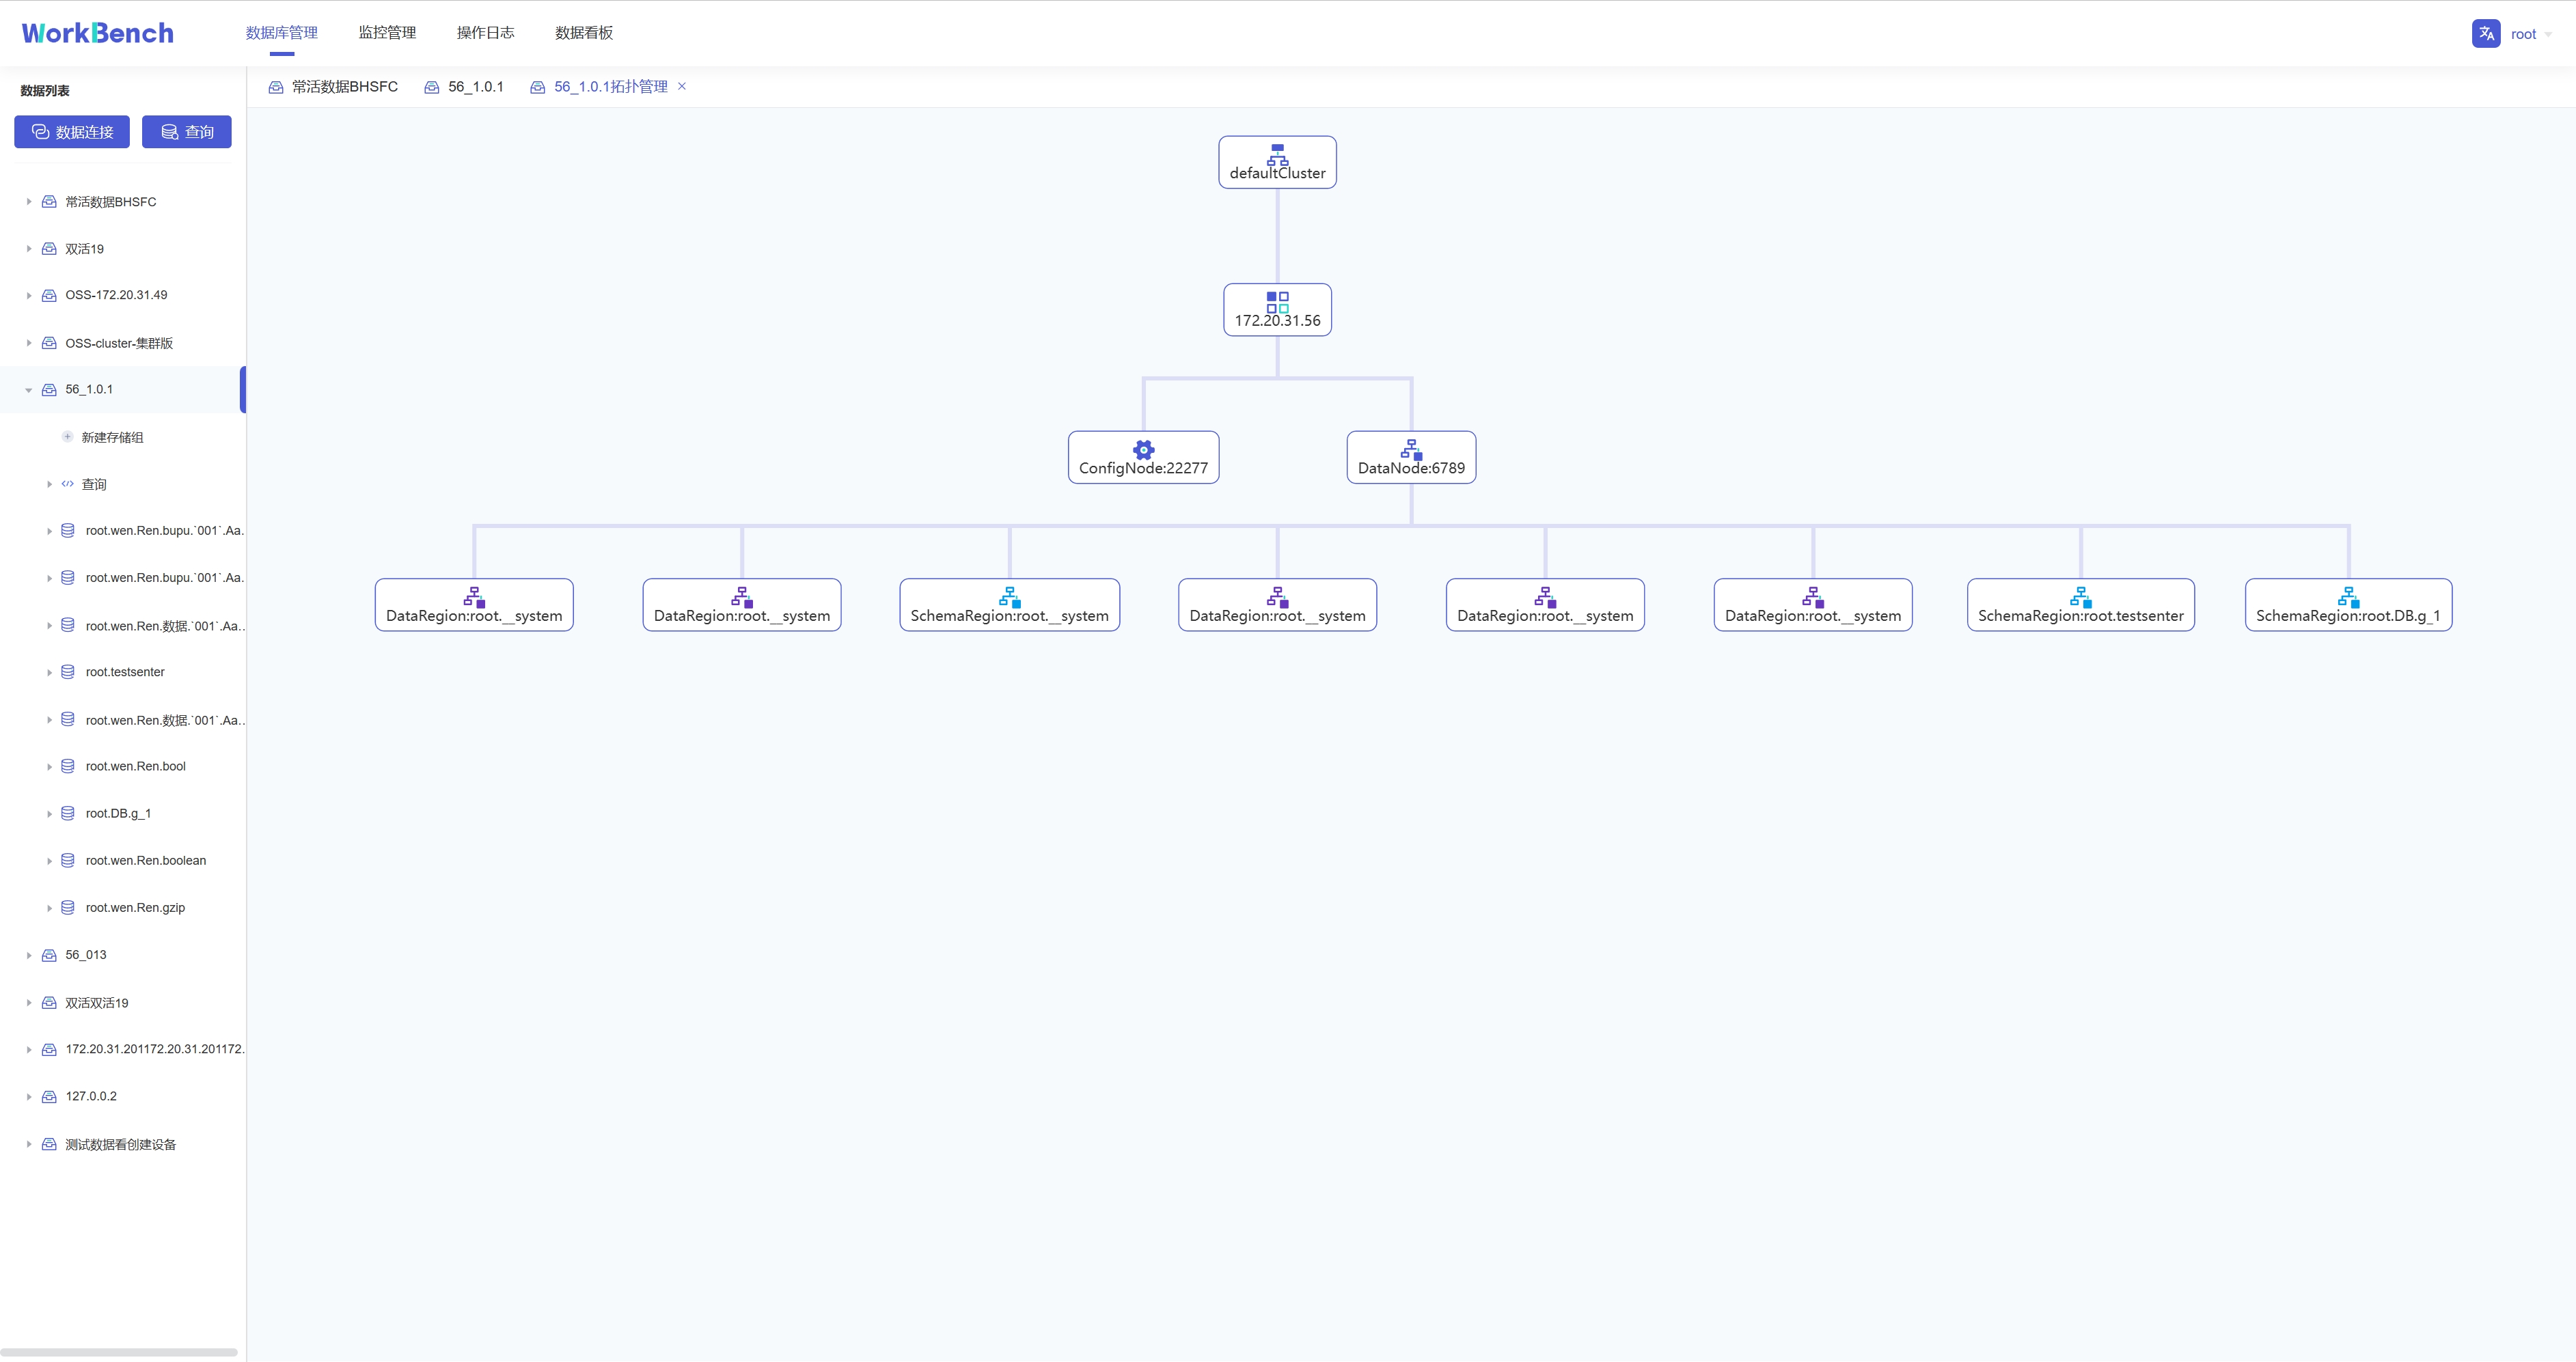
**节点管理**
Workbench提供对集群节点的管理。选择"**数据库管理**"-\>"**节点管理**"可以查看节点状态。可按节点ID或节点类型进行查询。
-
+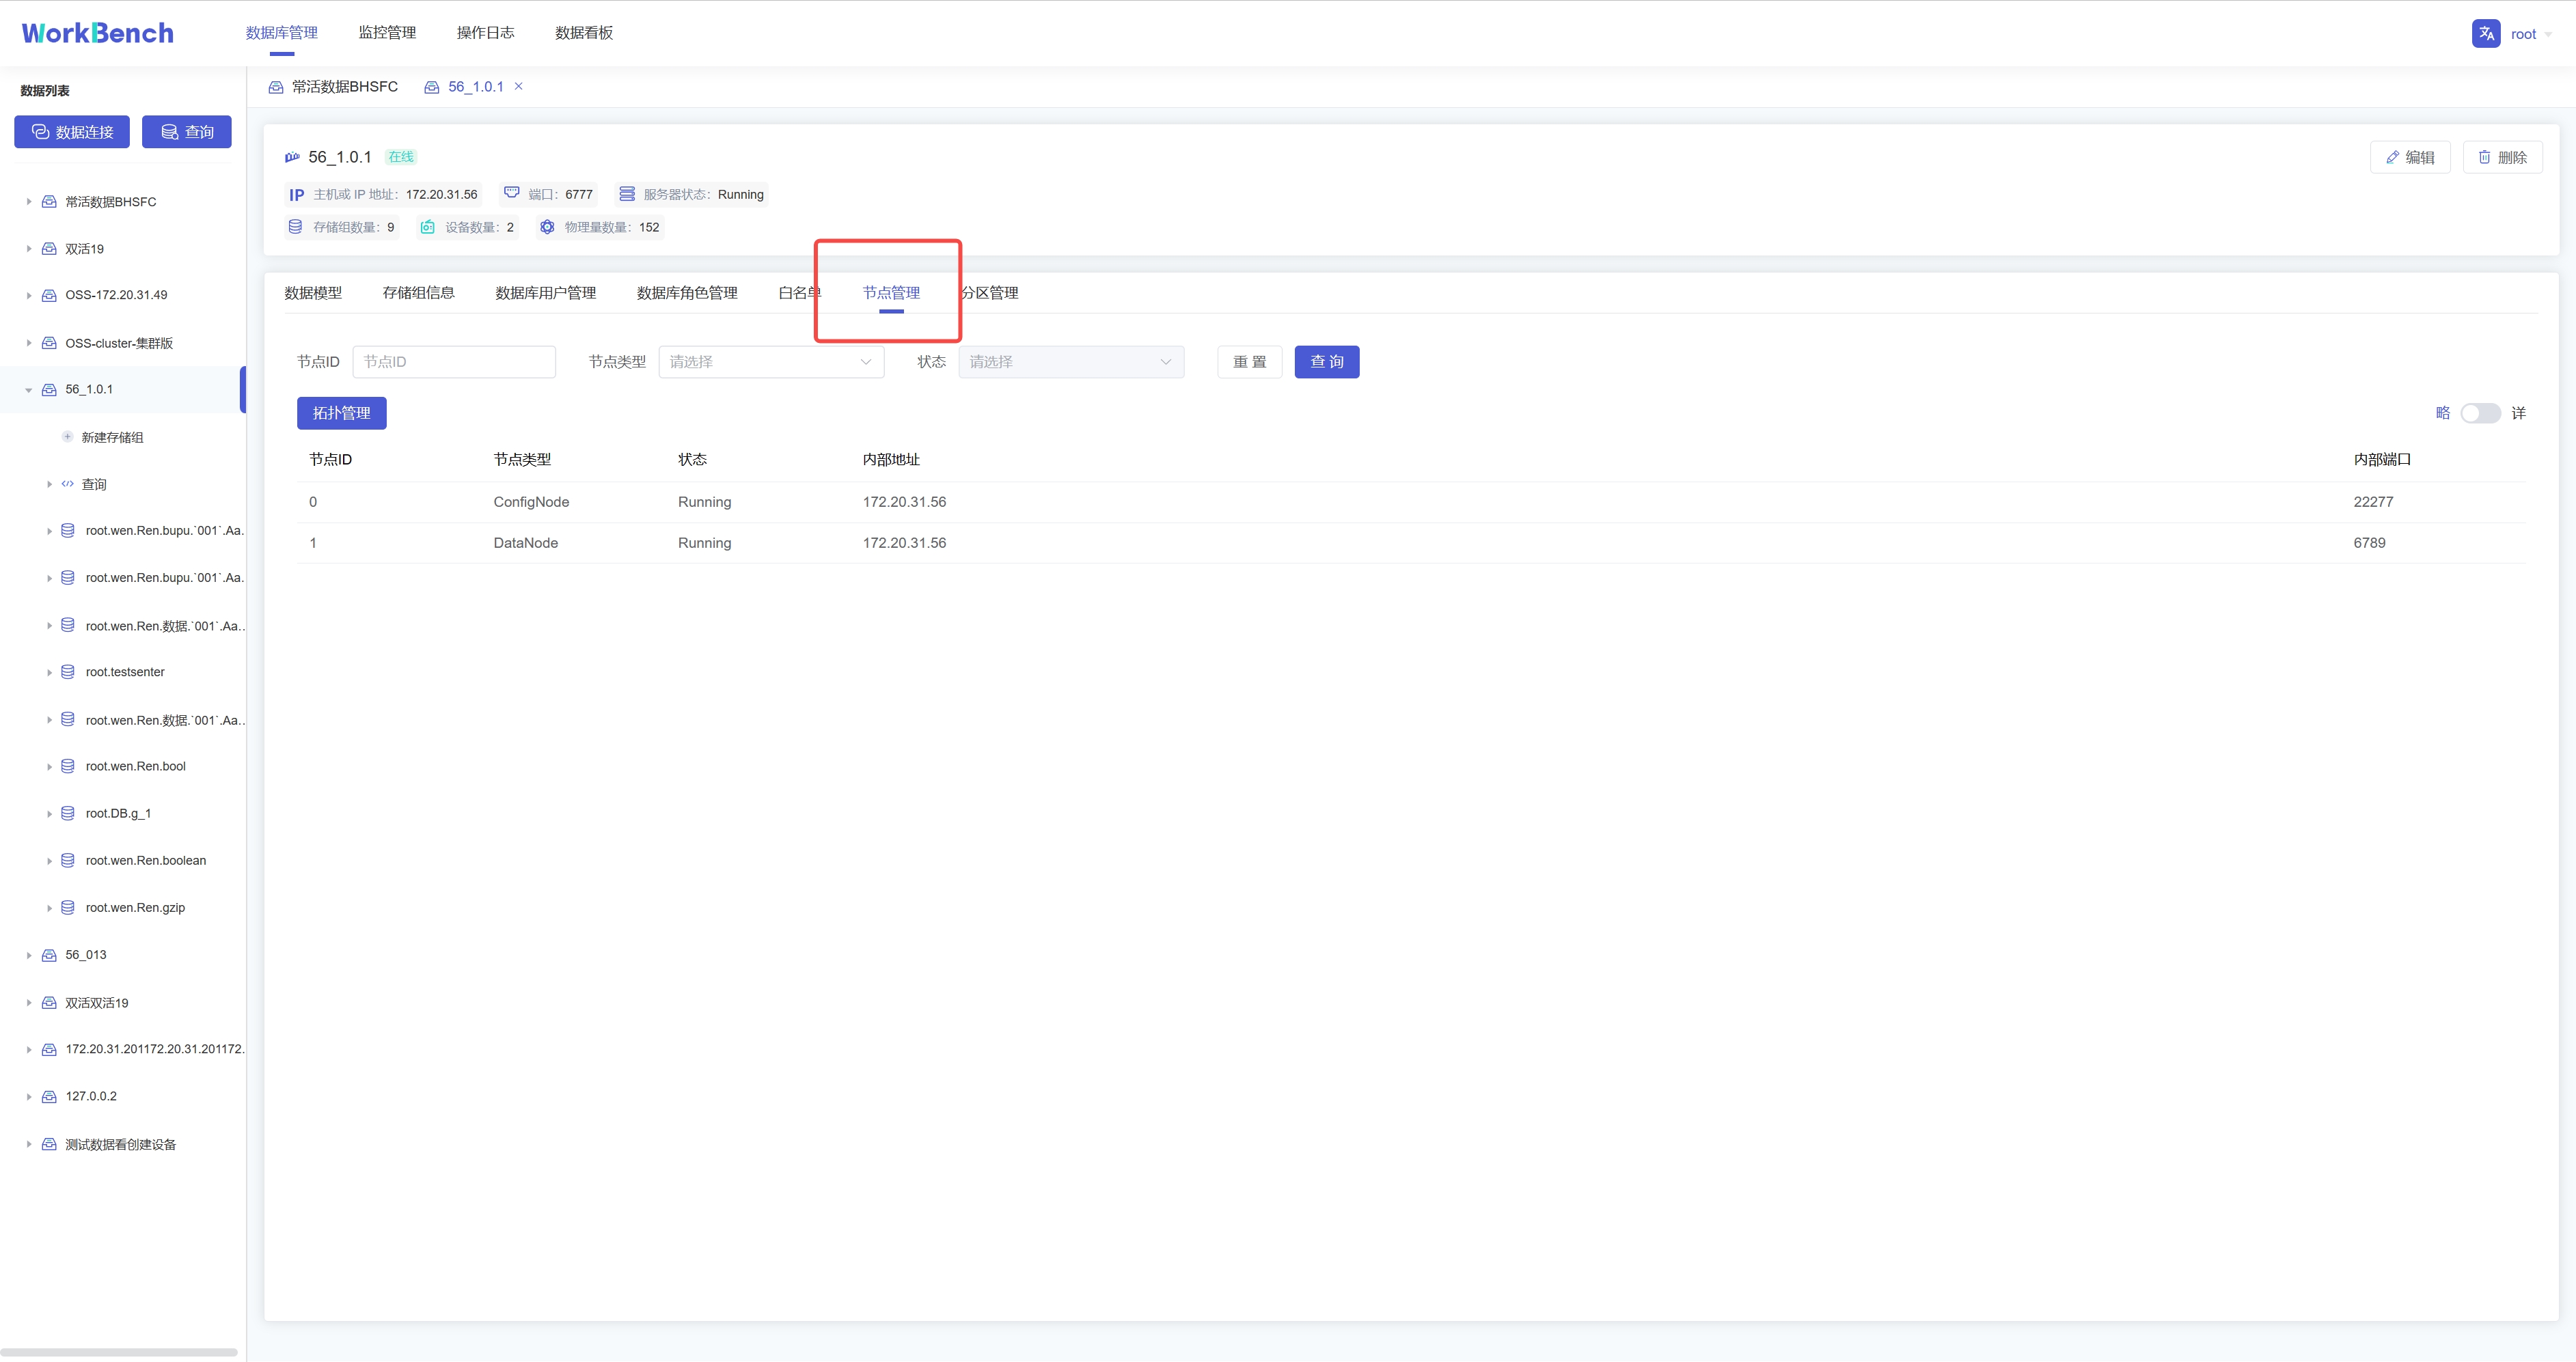
**分区管理**
Workbench提供对集群分区的管理。选择"**数据库管理**"-\>"**分区管理**"可以查看分区状态。可按分区ID或分区类型进行查询。
-
+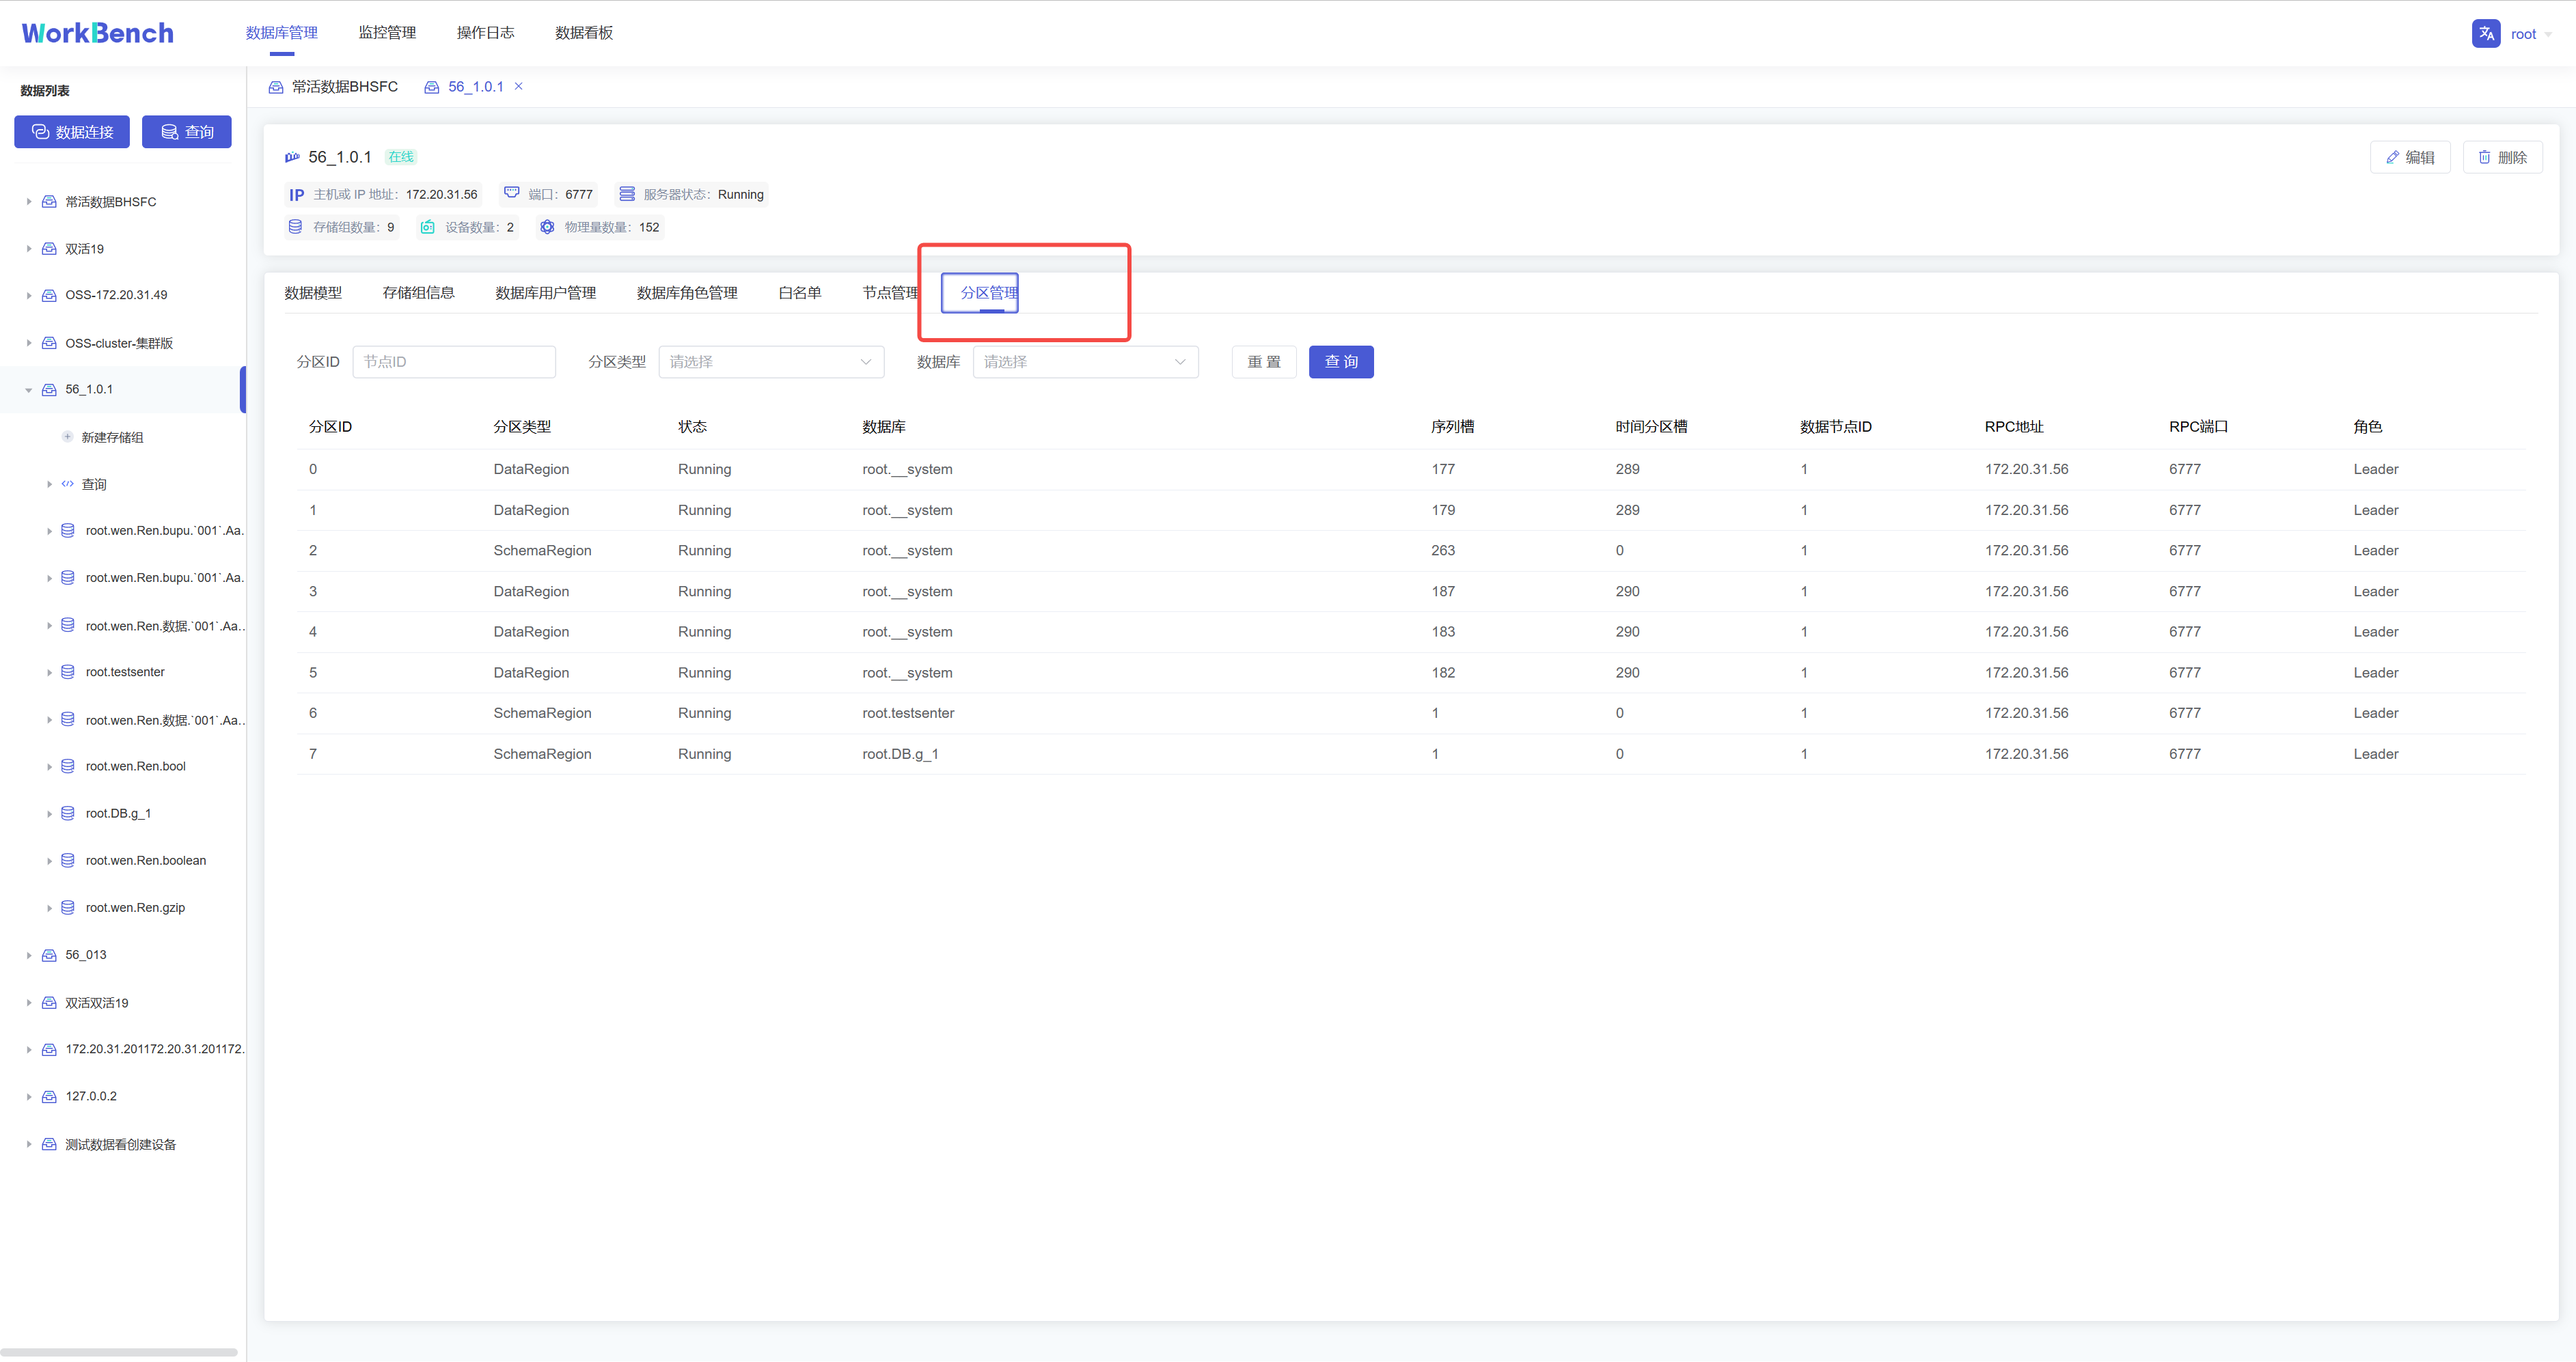
## 存储组管理
@@ -290,13 +290,13 @@ Workbench提供对集群分区的管理。选择"**数据库管理**"-\>"**分
在对象窗格中选择要操作的数据库对象,点击"**新建存储组**"即可创建存储组,存储组名称为必填,存储组名称为必填,正常情况下只能输入字母、数字、下划线以及UNICODE
中文字符如果包含特殊字符,请使用反引号。存活时间选填。
-
+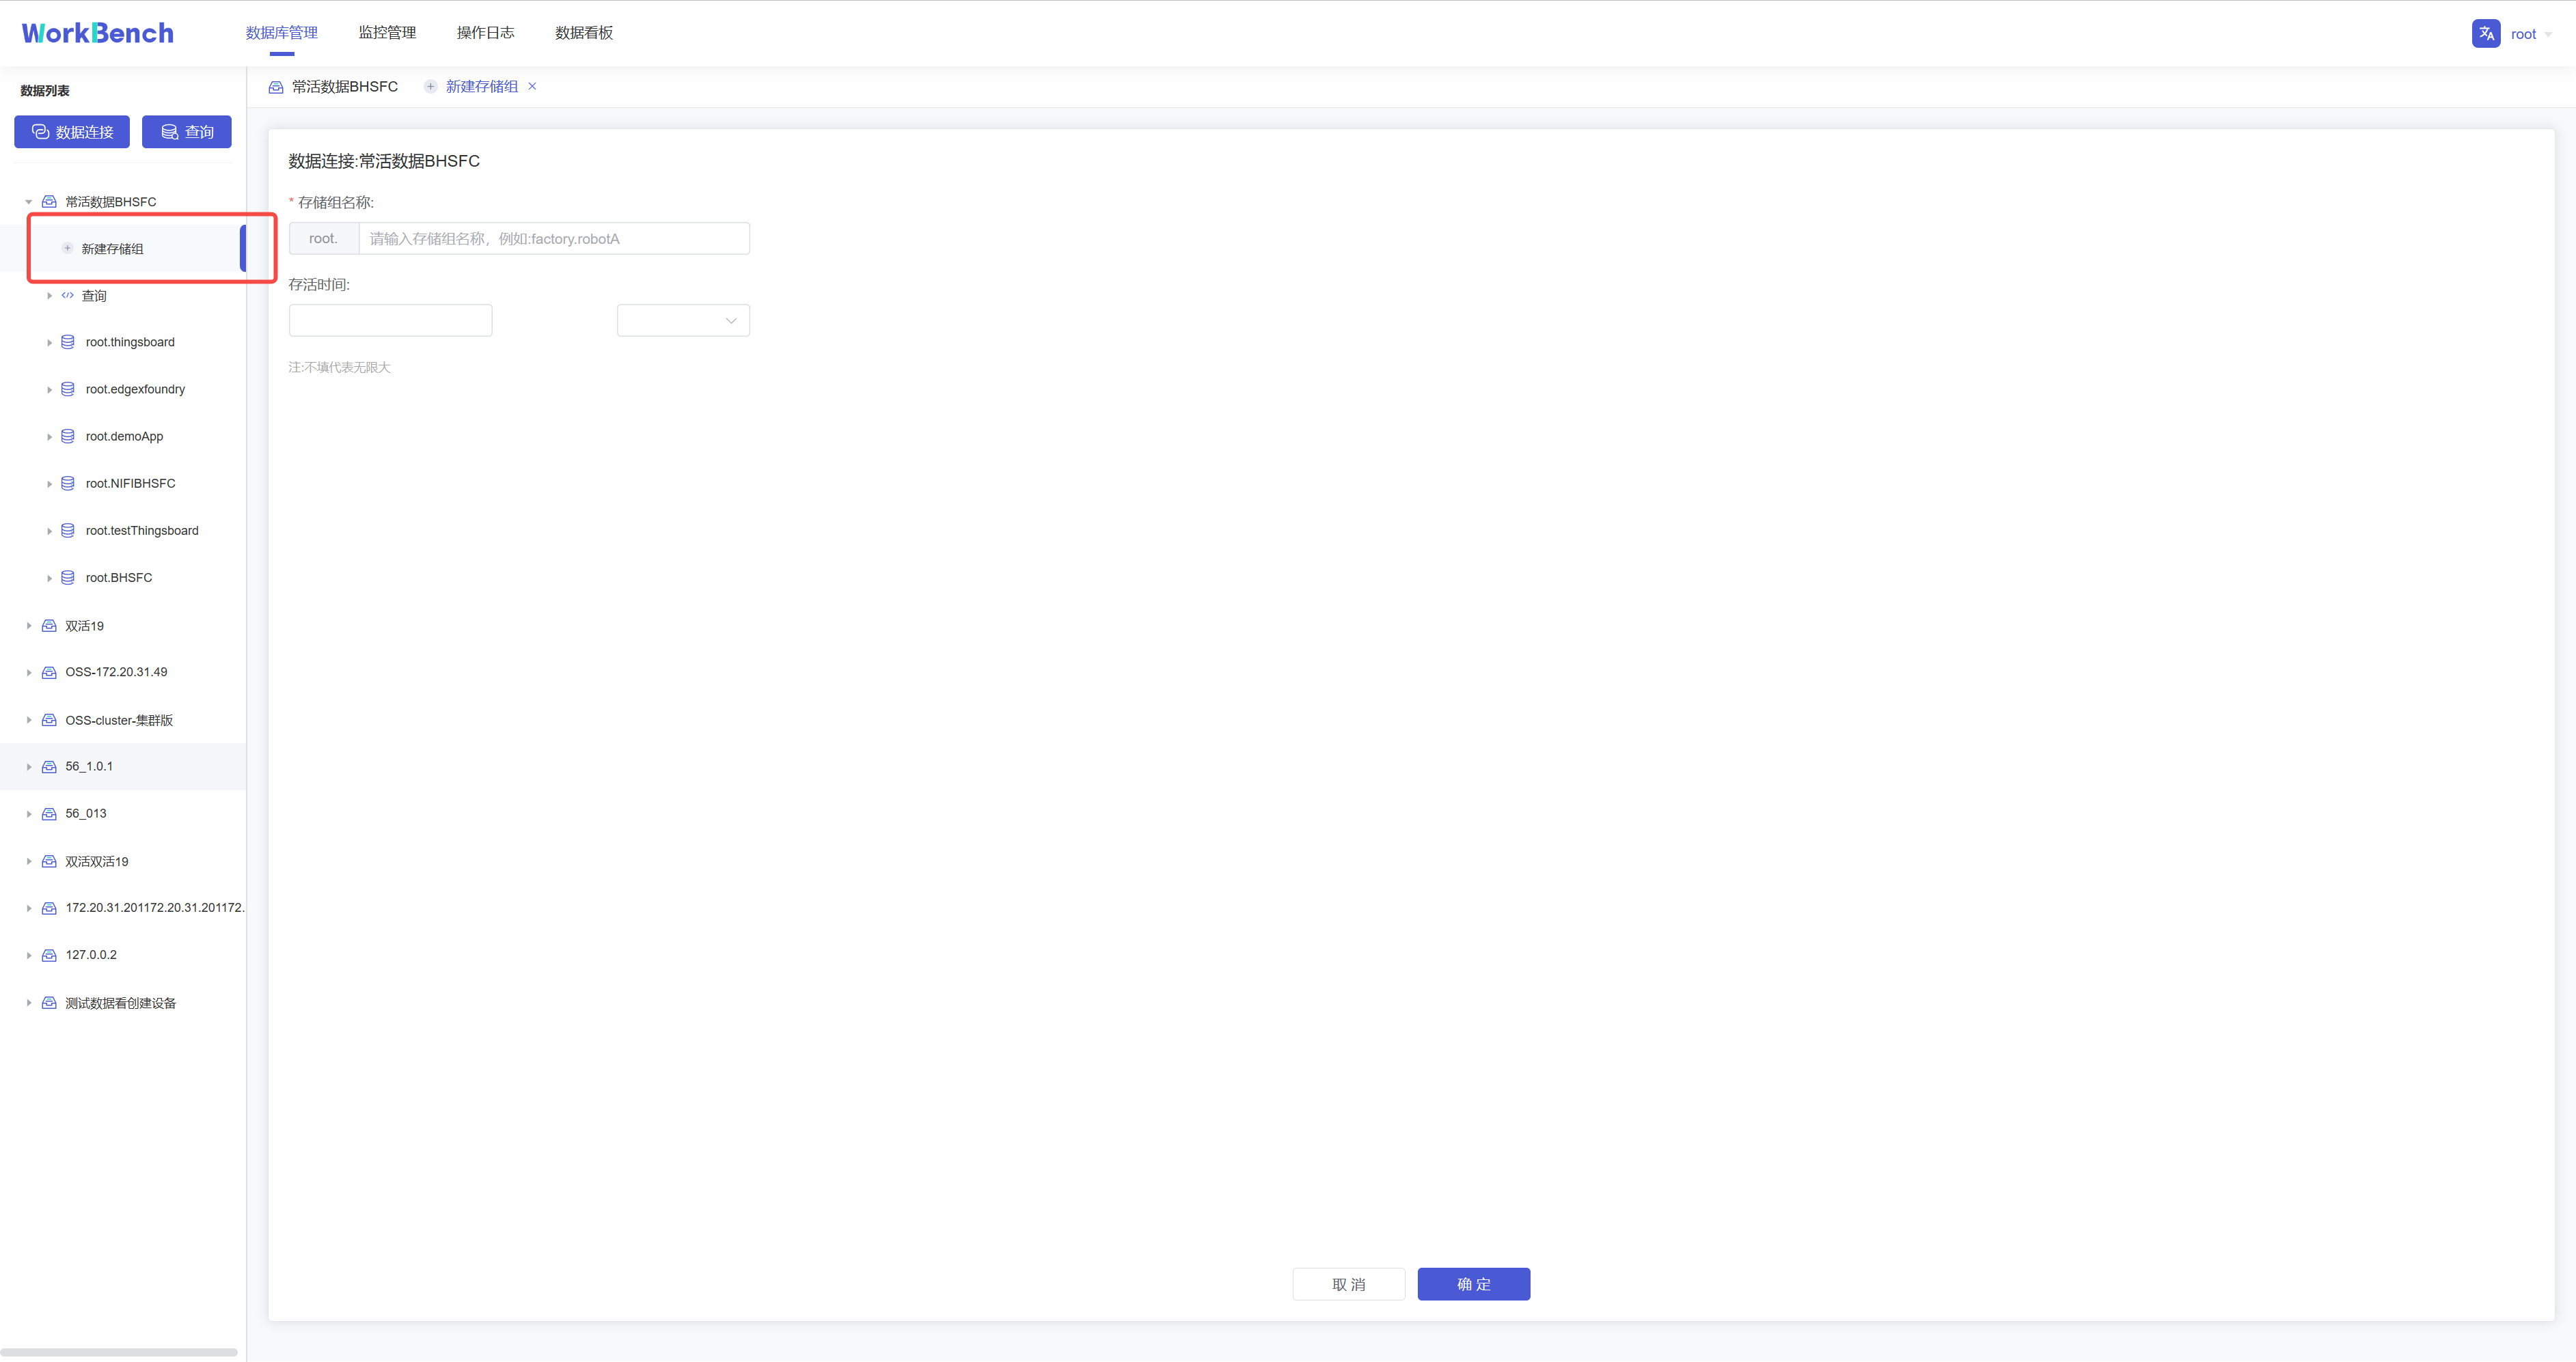
**删除存储组**
在对象窗格中选择要操作的存储组,在操作列中选择"**编辑**"可修改存储组存活时间,选择"**删除**"可删除存储组。
-
+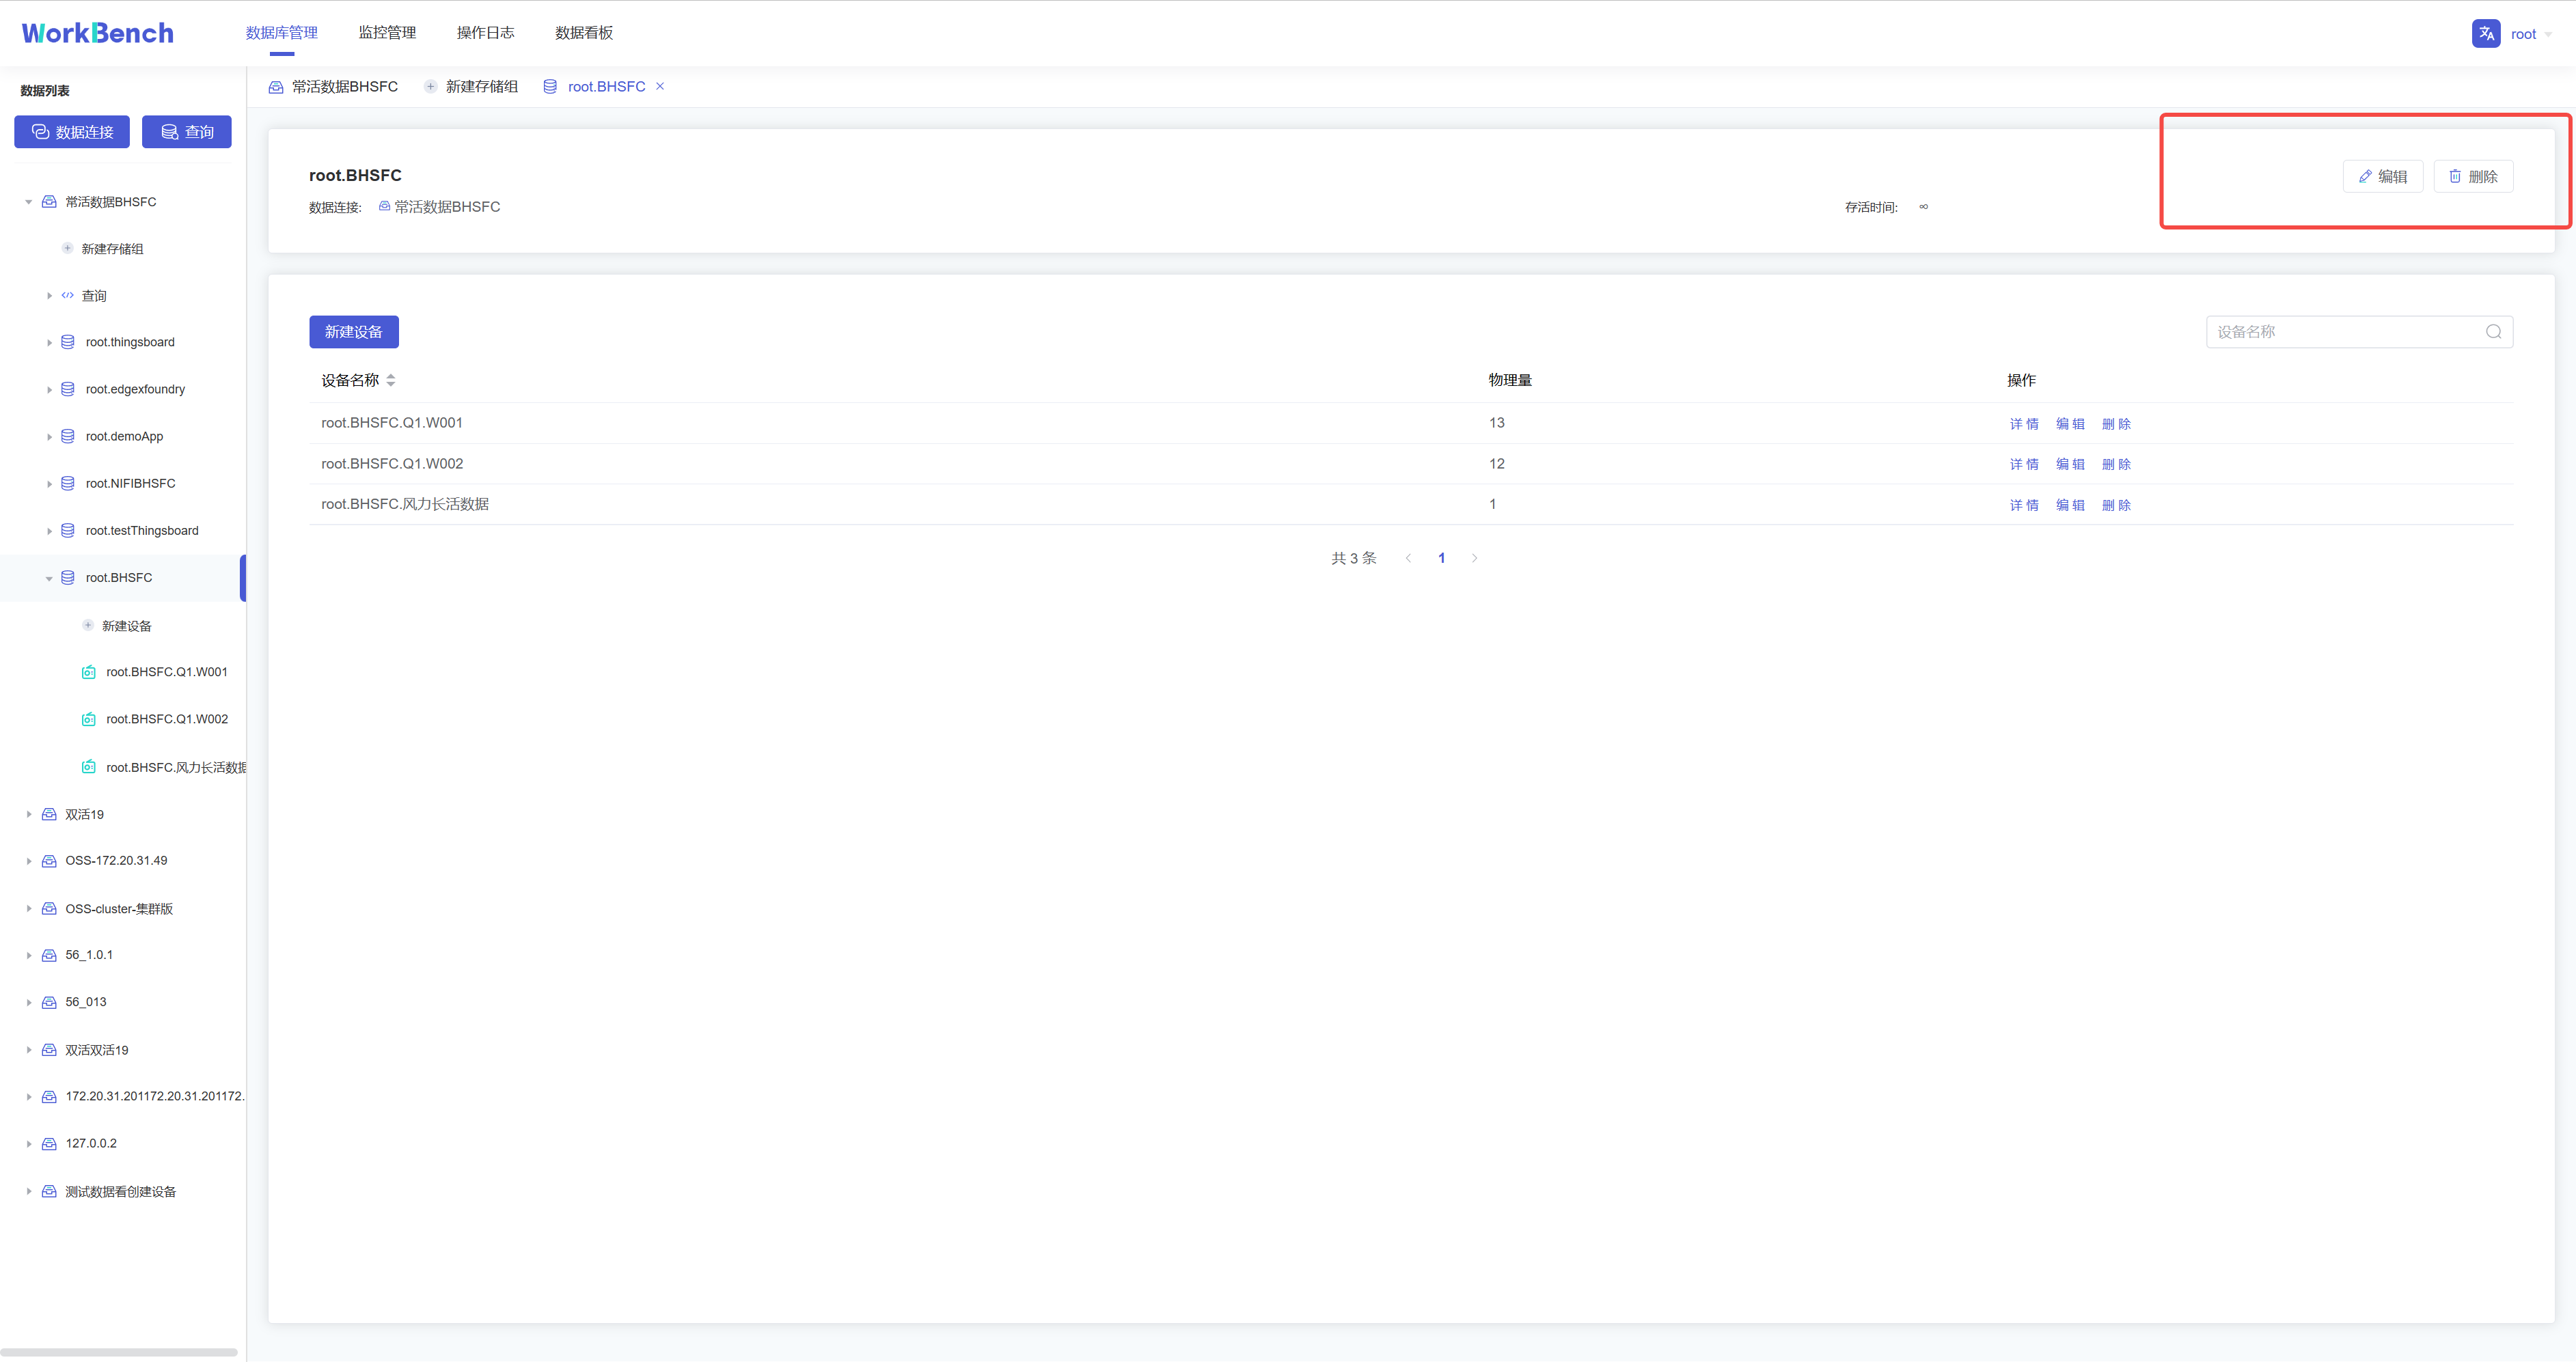
## 设备及物理量管理
@@ -305,26 +305,26 @@ Workbench提供对集群分区的管理。选择"**数据库管理**"-\>"**分
在对象窗格中选择要操作的存储组,点击"**新建设备**",按要求填写信息则可创建该存储组下的物理量。物理量名称名称为必填,正常情况下只能输入字母、数字、下划线以及UNICODE
中文字符如果包含特殊字符,请使用反引号。
-
+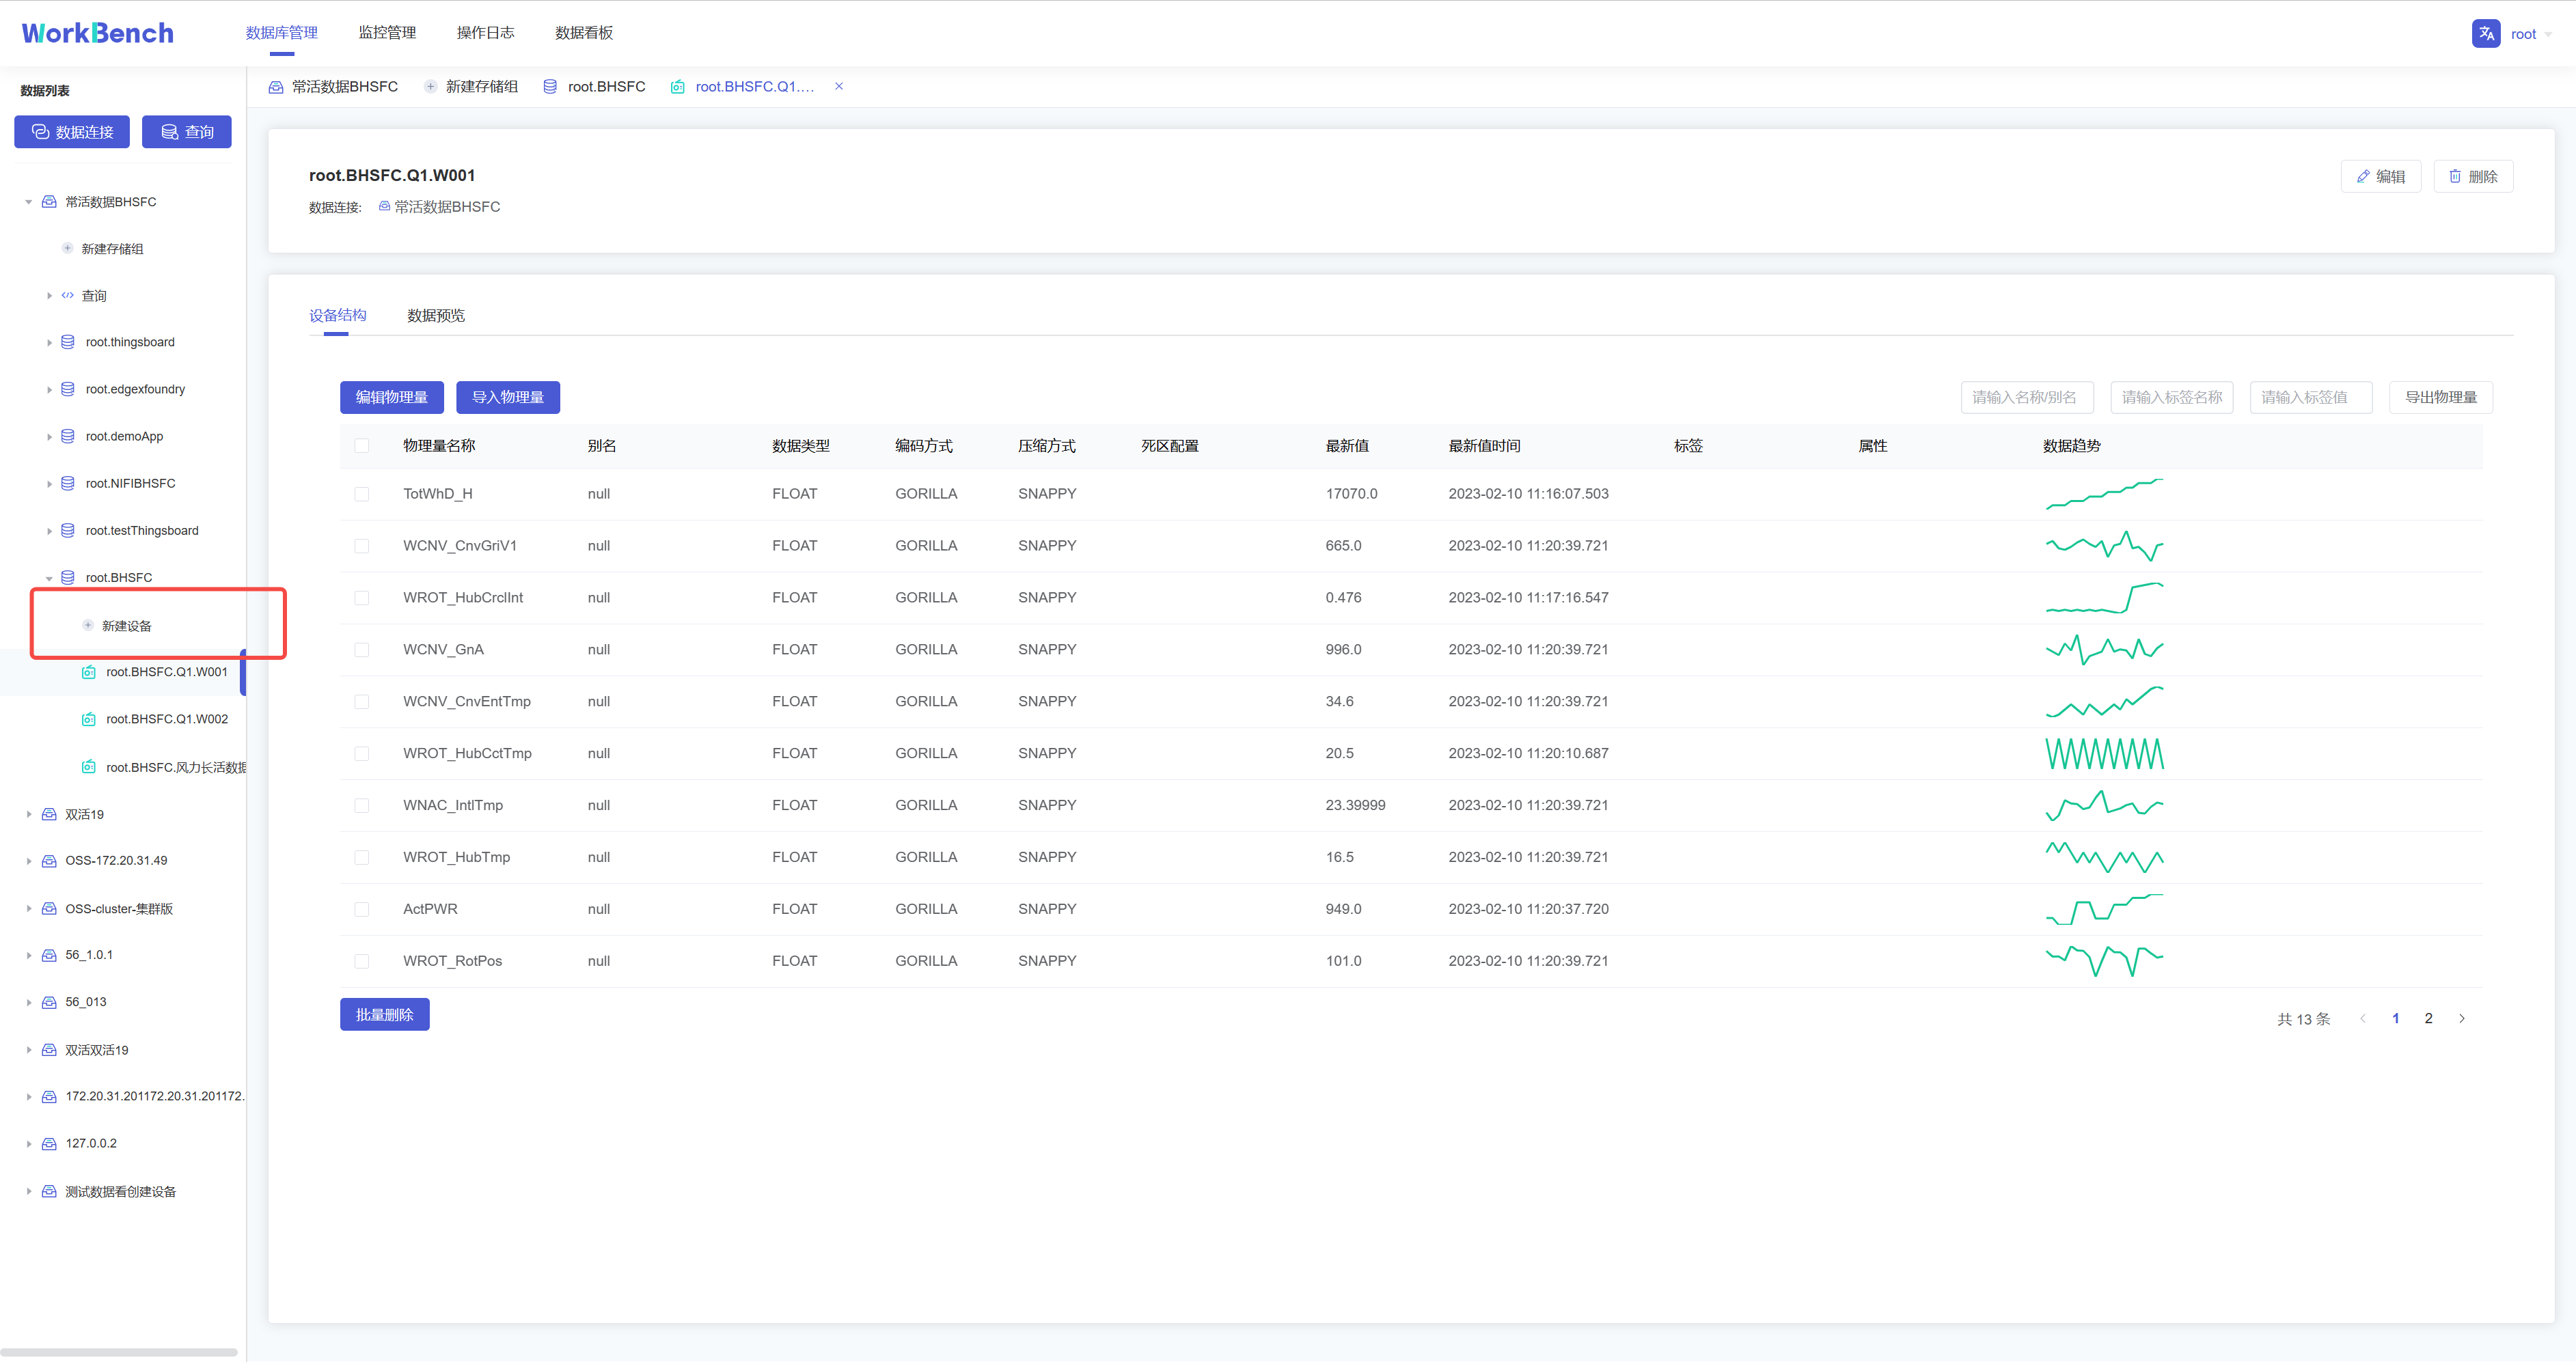
**数据趋势预览**
"数据趋势"功能仅在企业版中支持。在对象窗格中选定存储组,"**数据趋势**"显示该存储组下的物理量趋势图表,单击图表显示详细信息,可选定时间范围查询该区间内的数据,并显示最小值等数据
-
+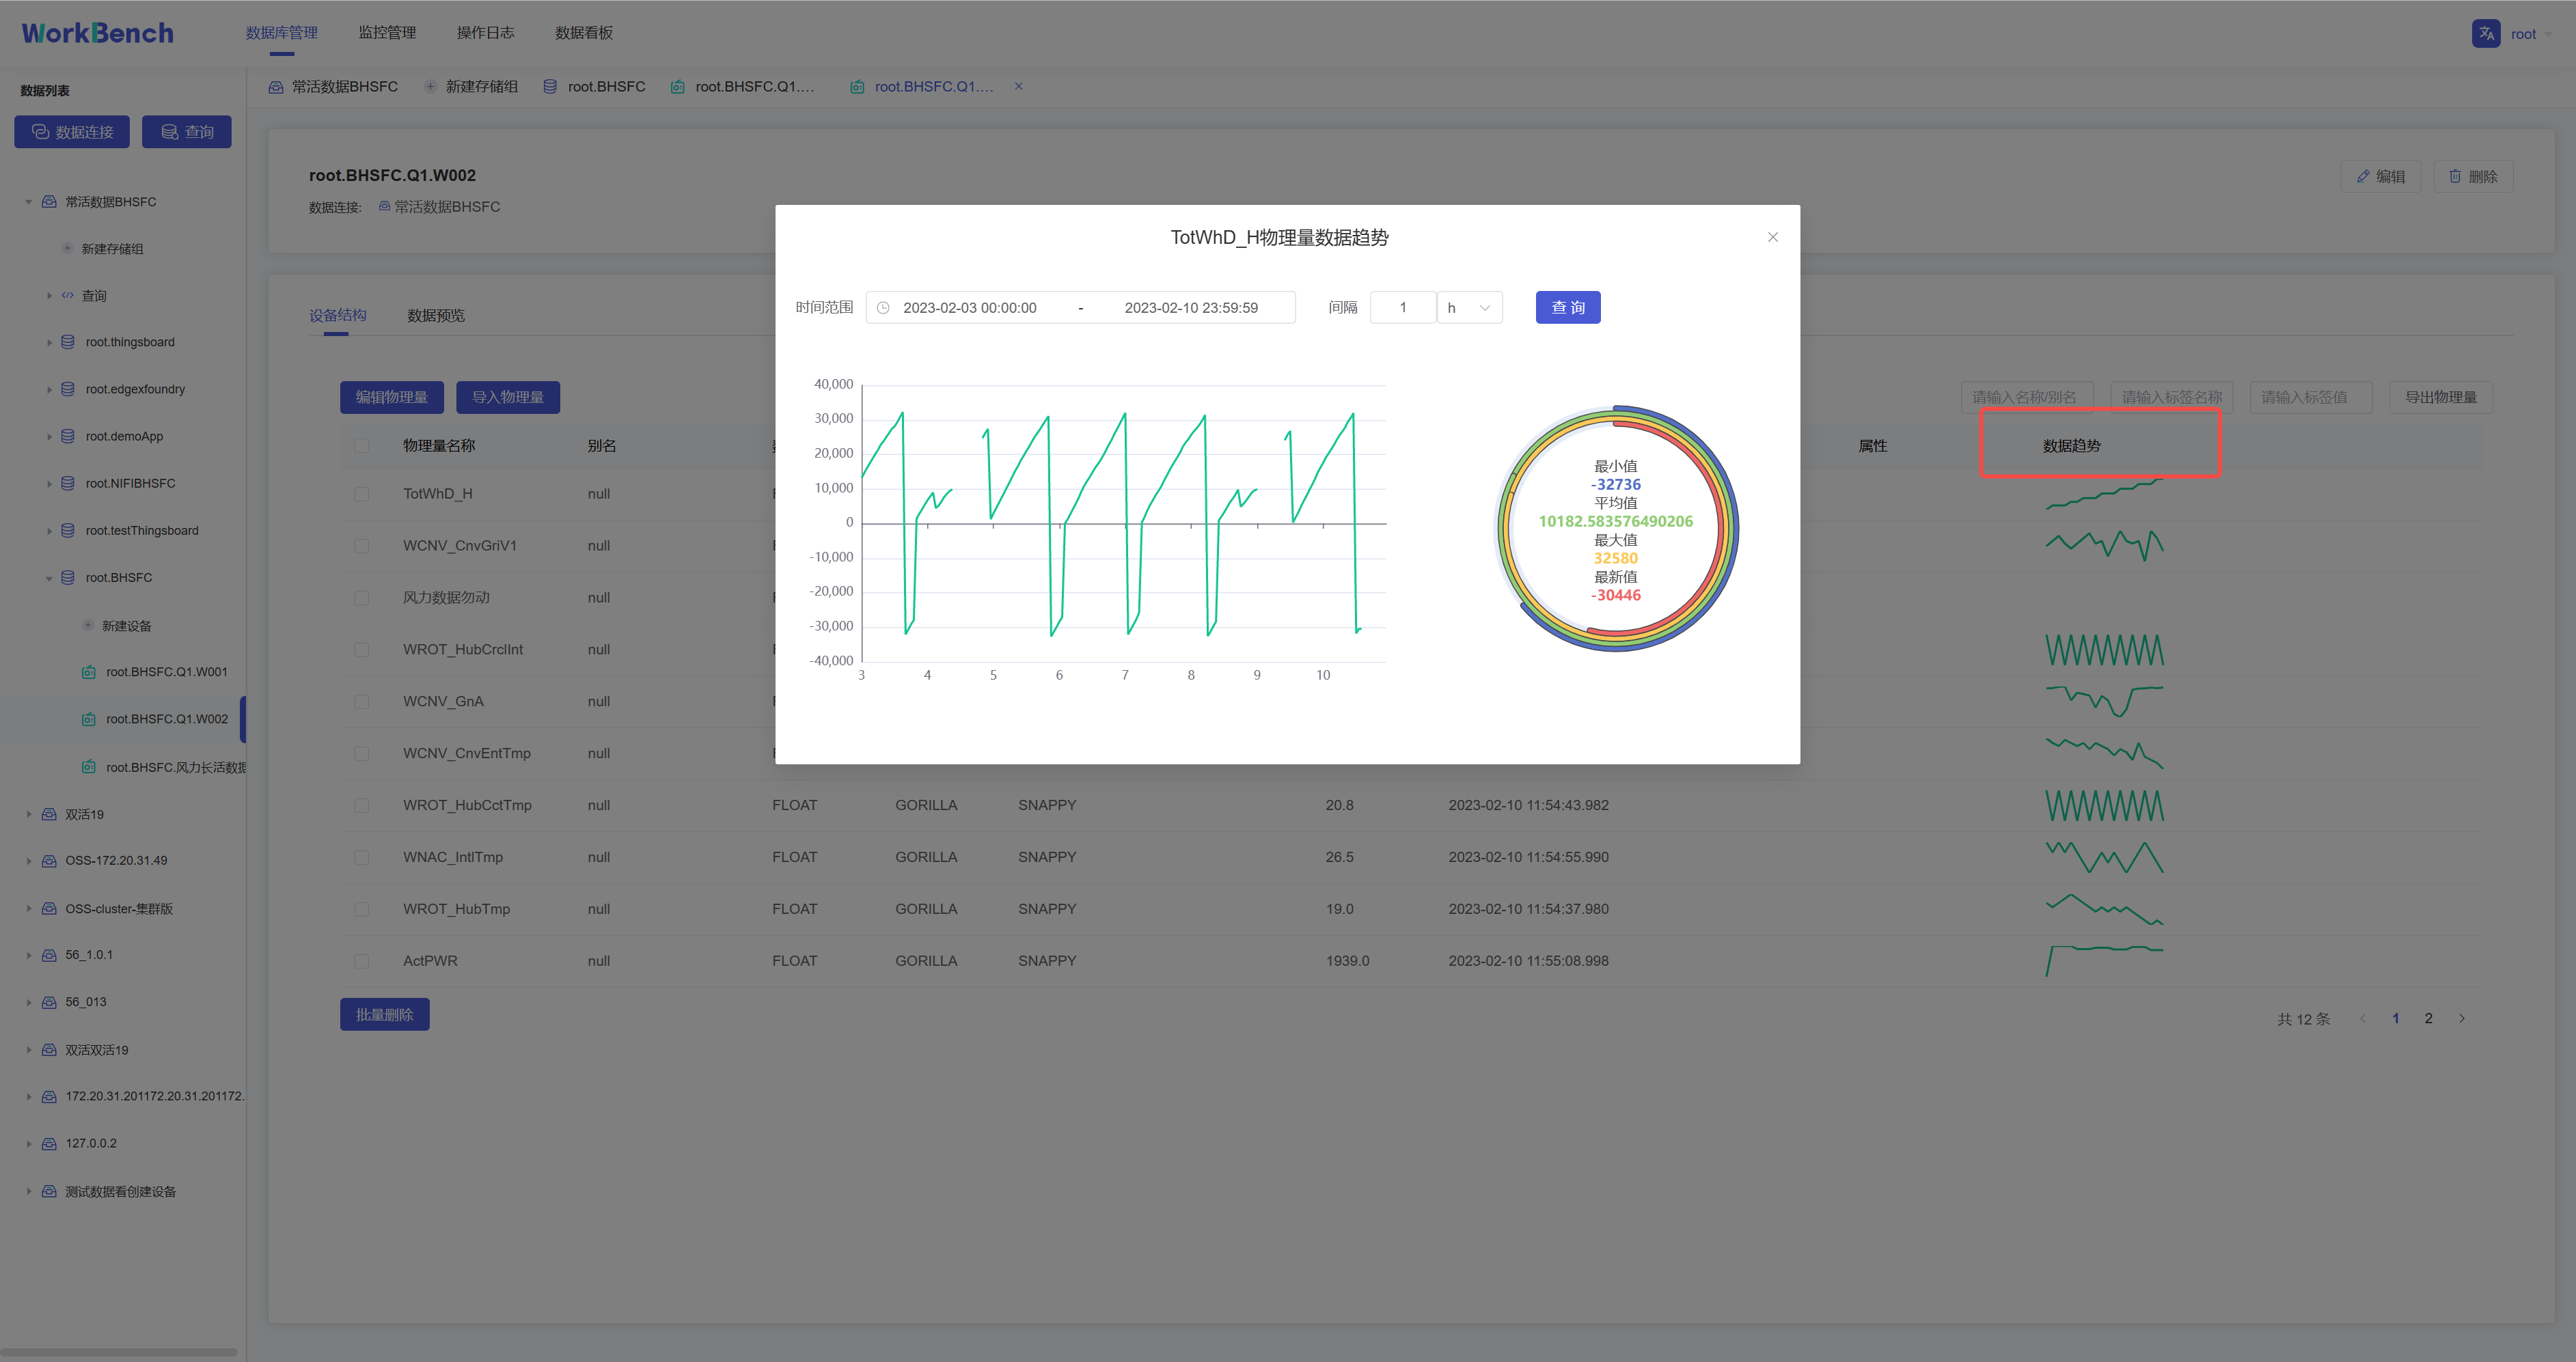
**修改、删除物理量**
在对象窗格中选择要操作的设备
,点击右侧的"**编辑**"可修改该设备下的物理量信息(别名、标签和属性)。点击"**删除**"则可删除该设备。
-
+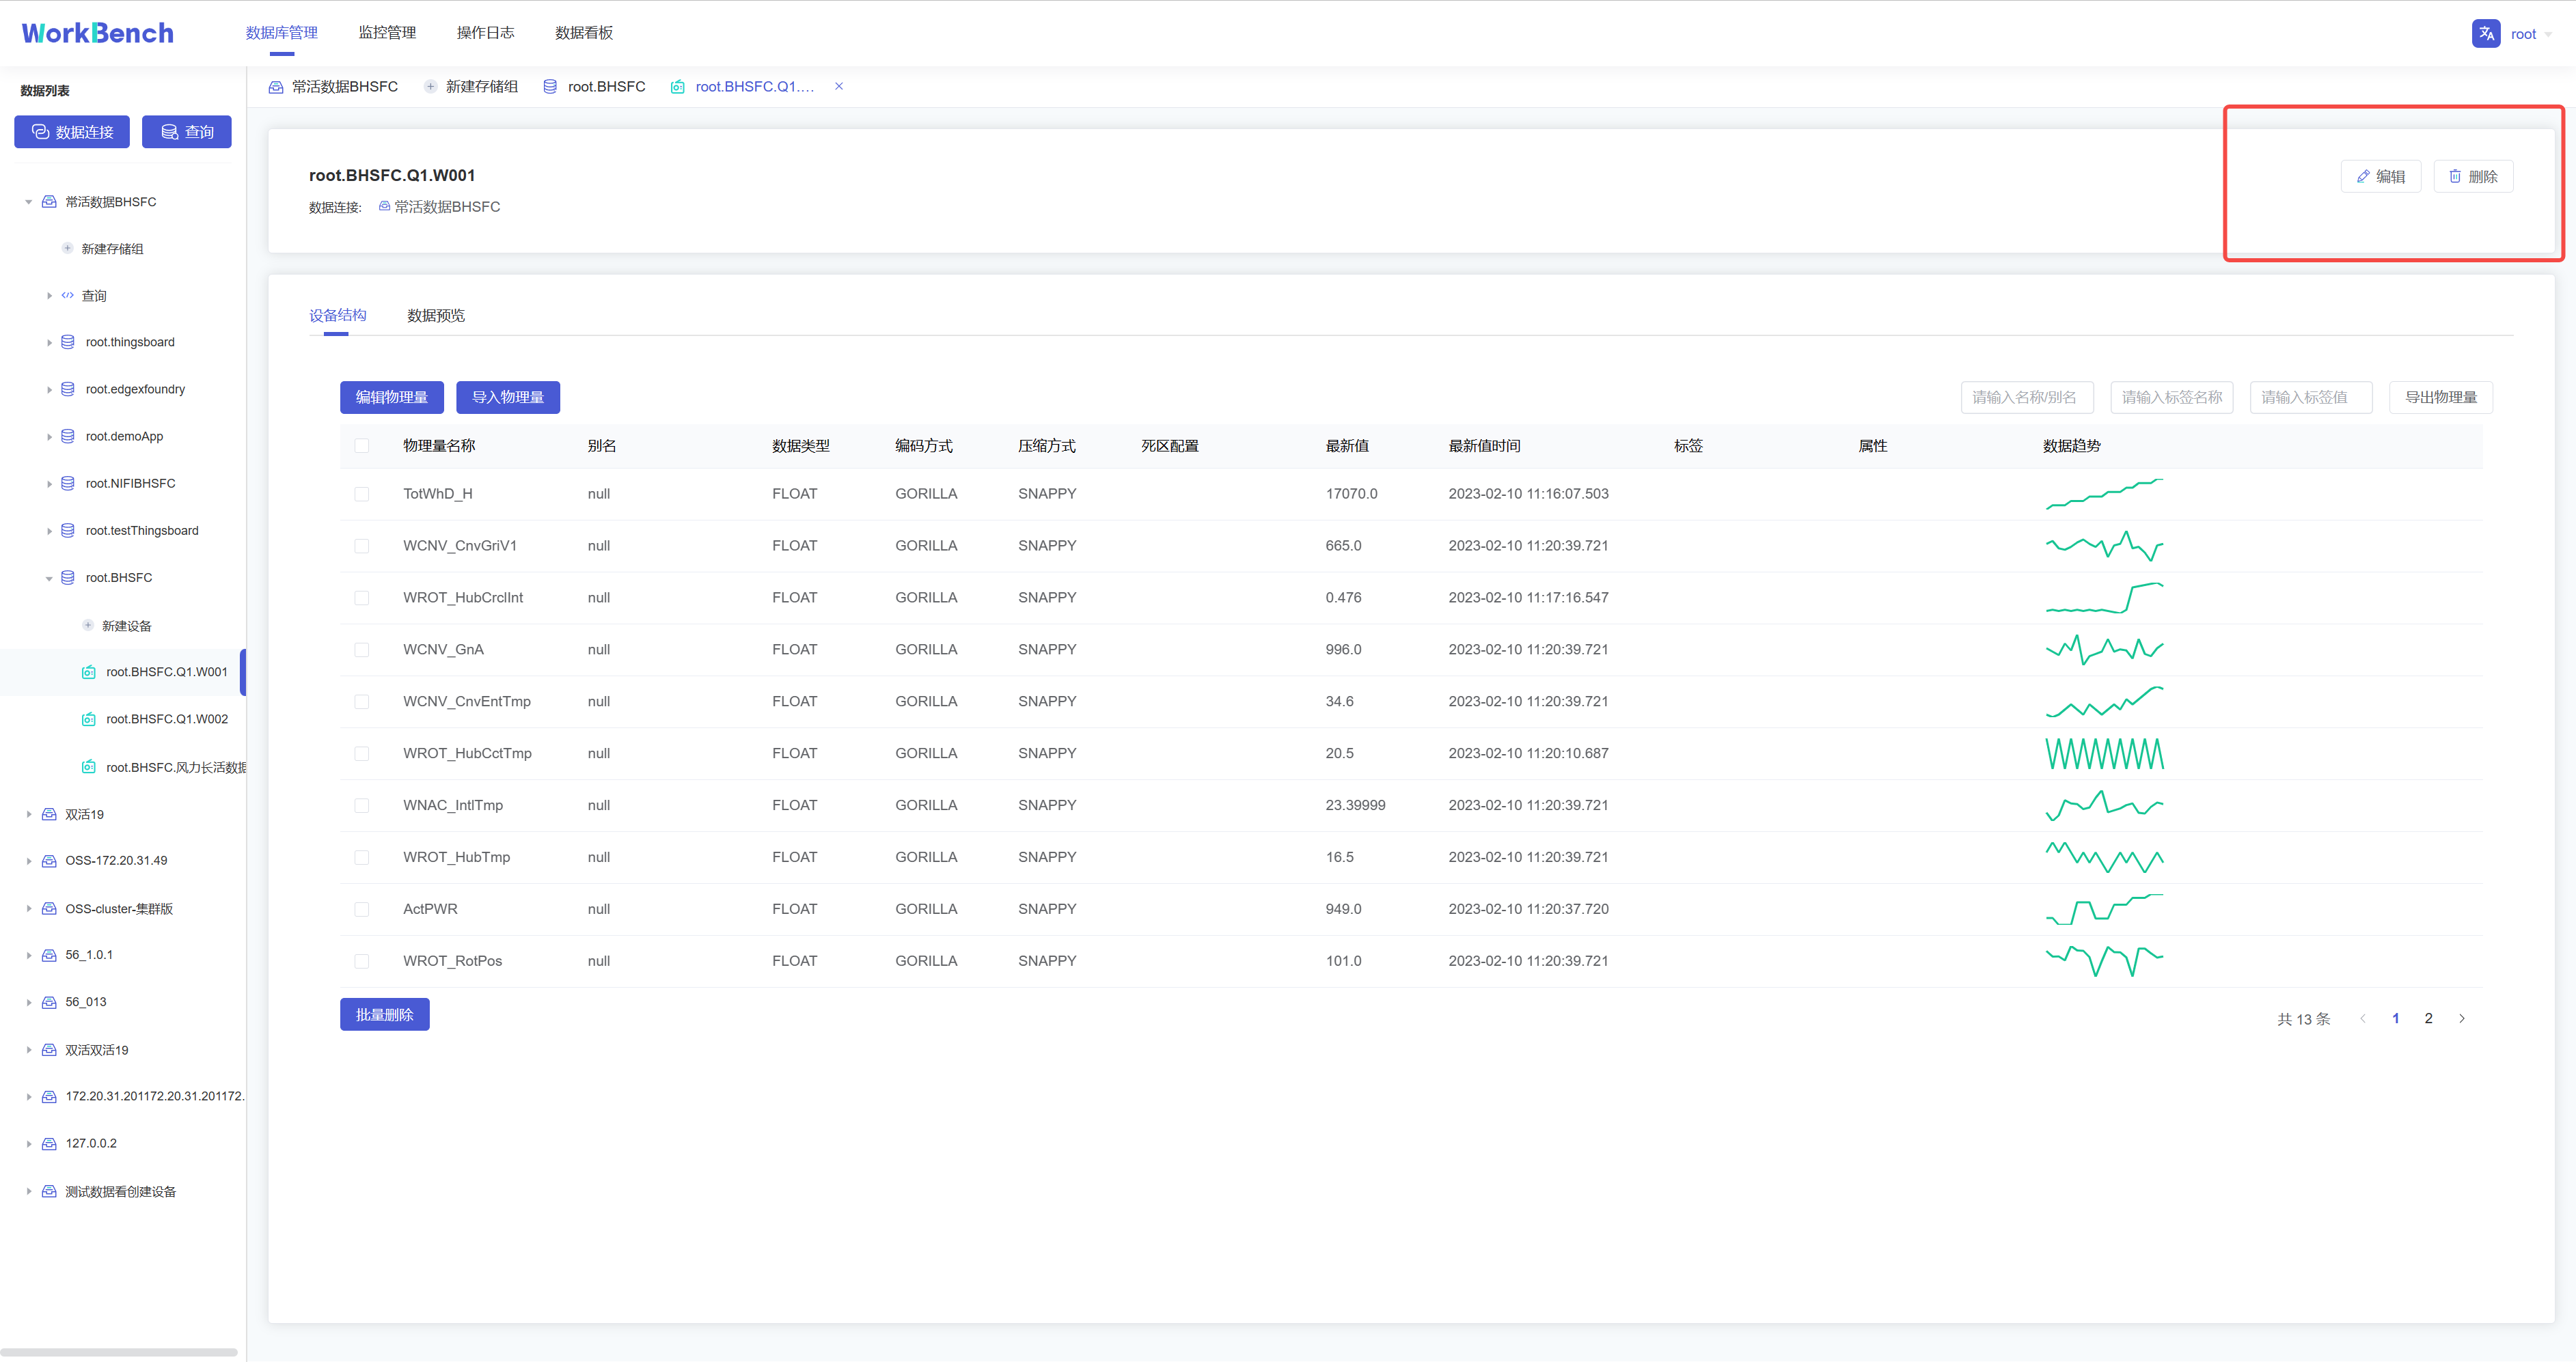
## 操作日志
"操作日志"提供所有在Workbench上进行的操作记录,可按IP、用户、数据连接、关键词和时间范围进行筛选。
-
+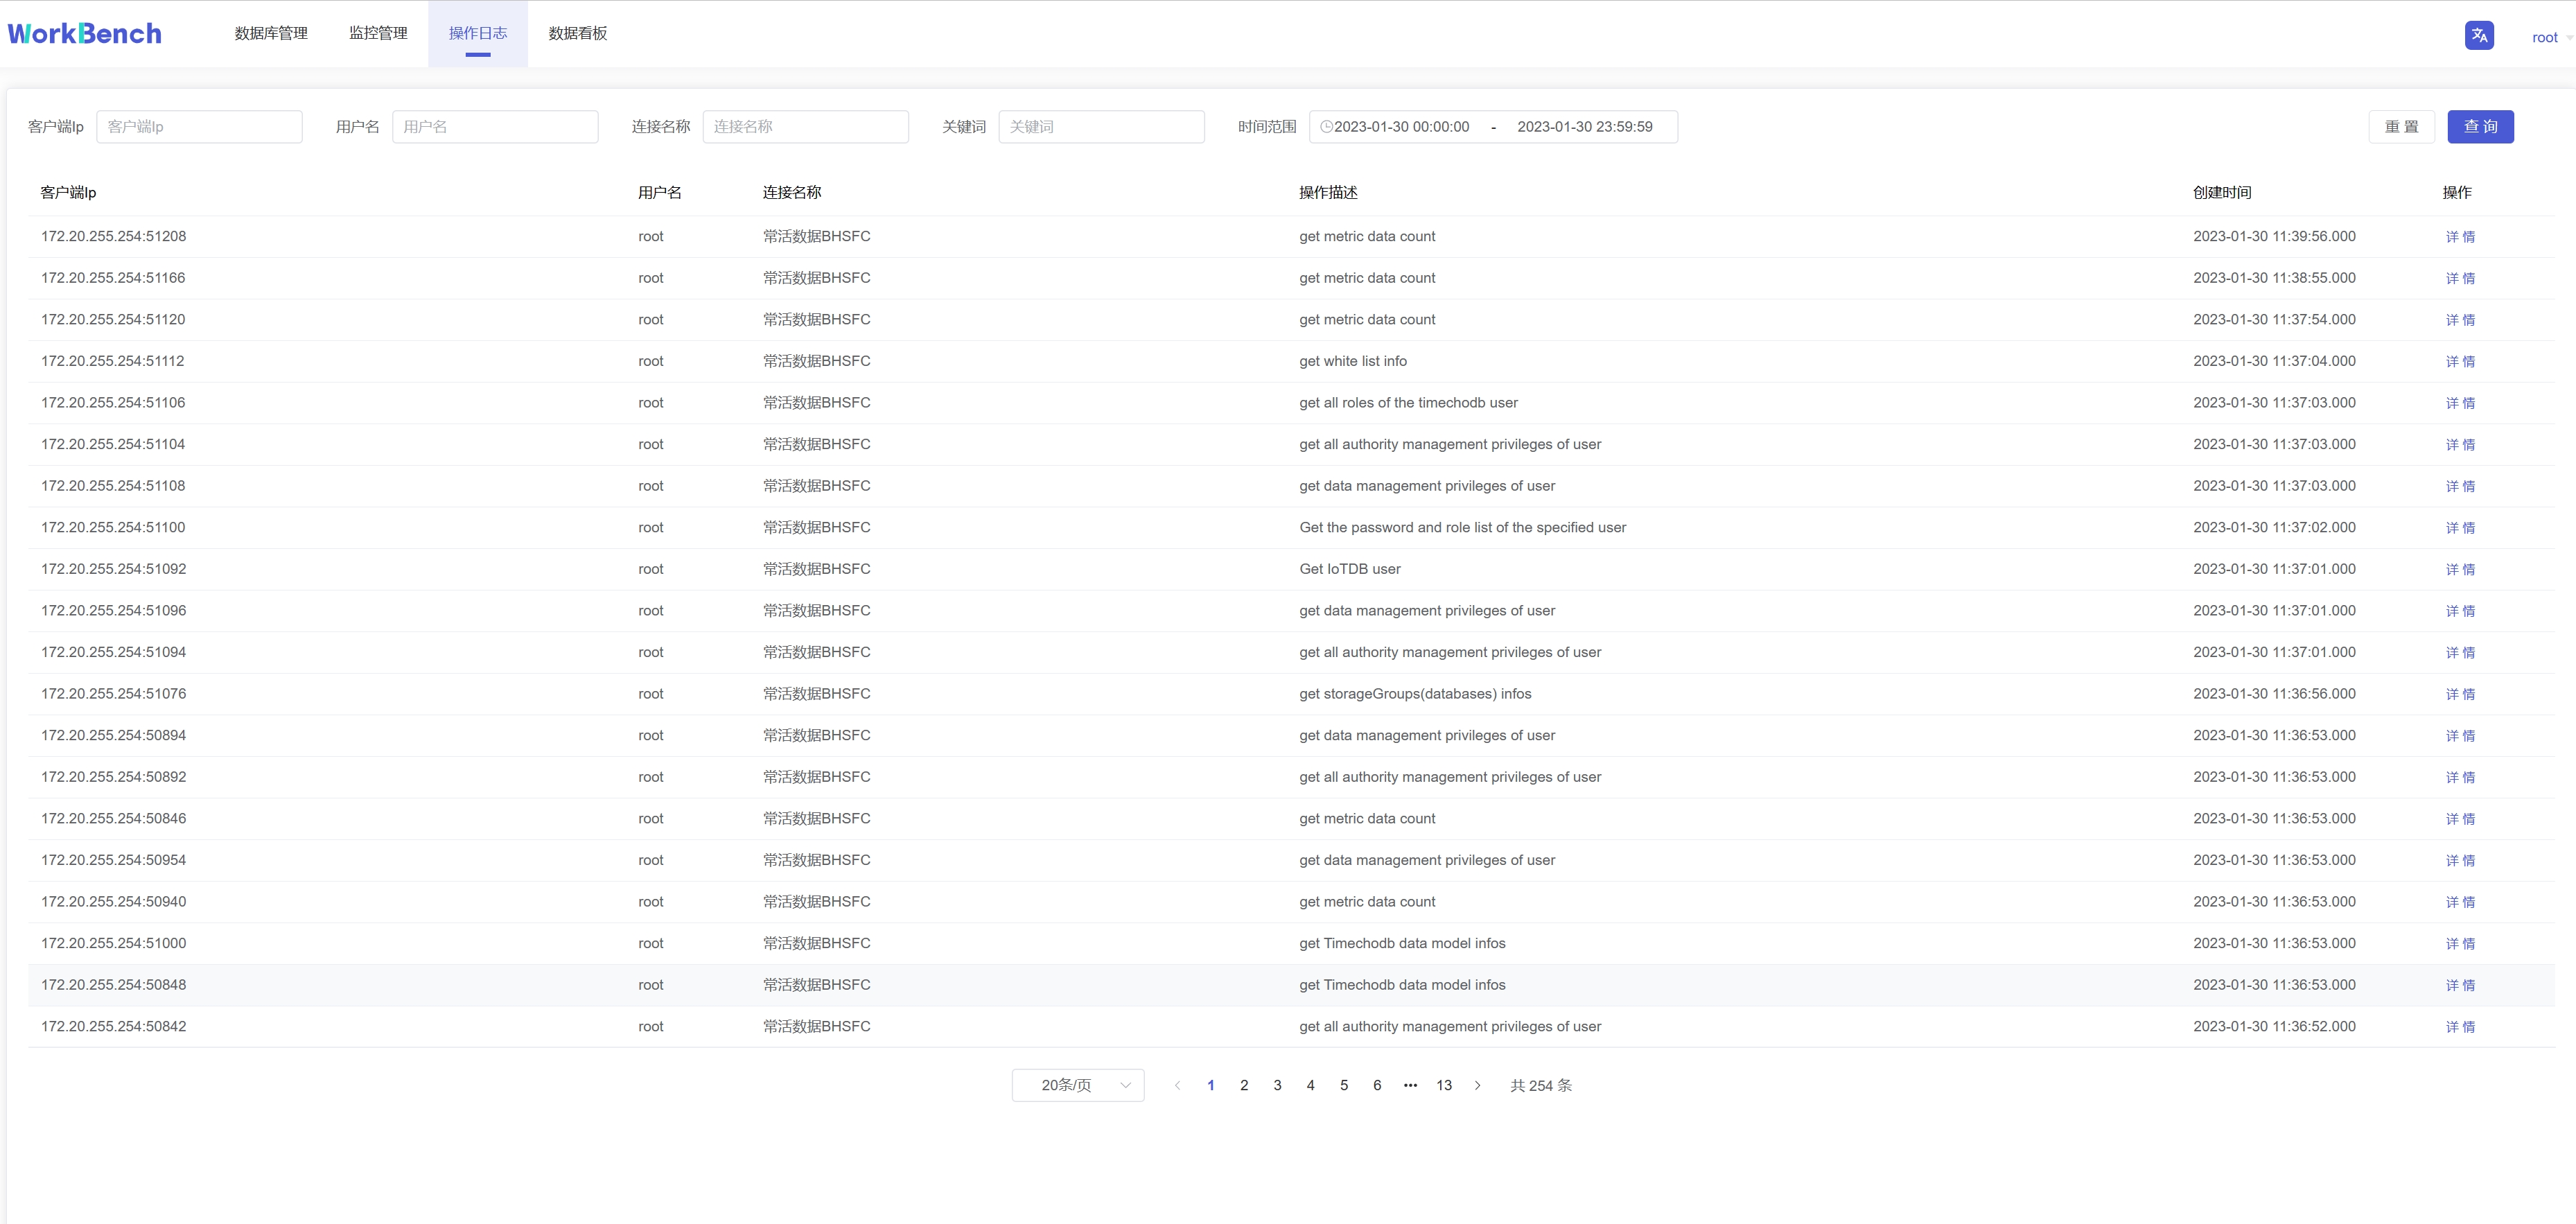
## 监控管理
@@ -334,25 +334,25 @@ Workbench提供"**监控管理**"提供来查看已选择的服务器监控属
监控指标可供查看CPU指标、内存指标和存储指标的最新信息。
-
+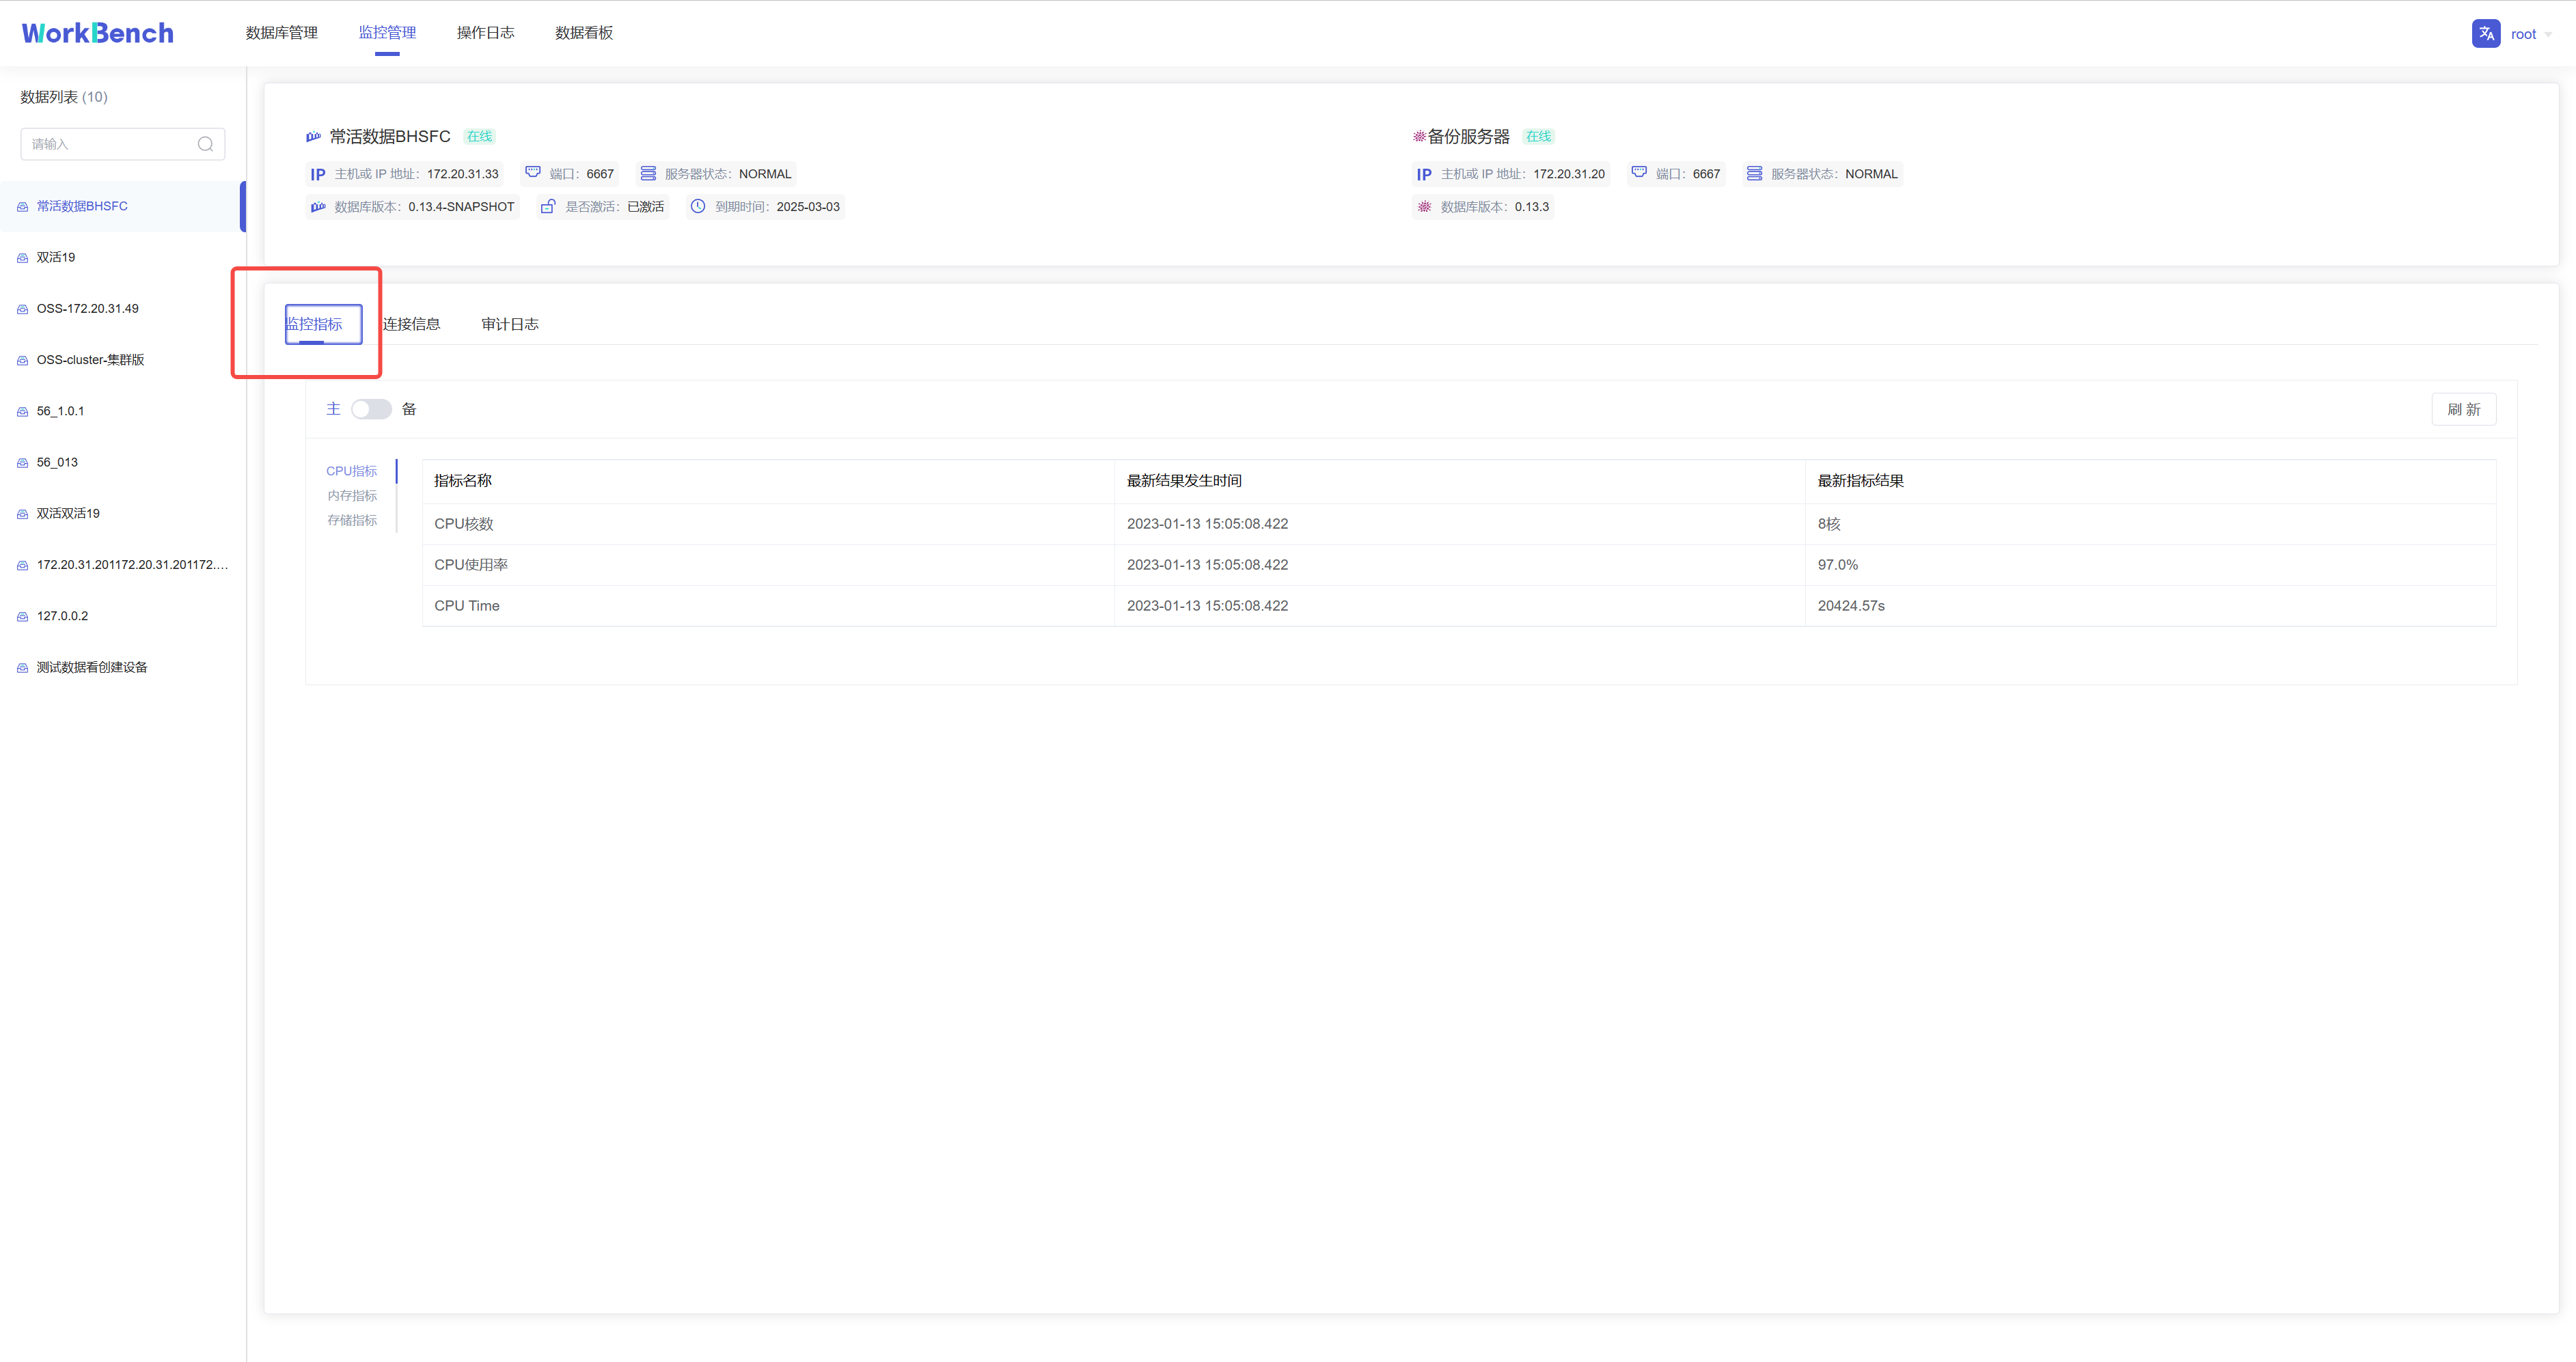
**连接信息**
连接信息可供查看连接到Workbench的用户和服务器信息。"连接信息"功能仅在企业版中支持。
-
+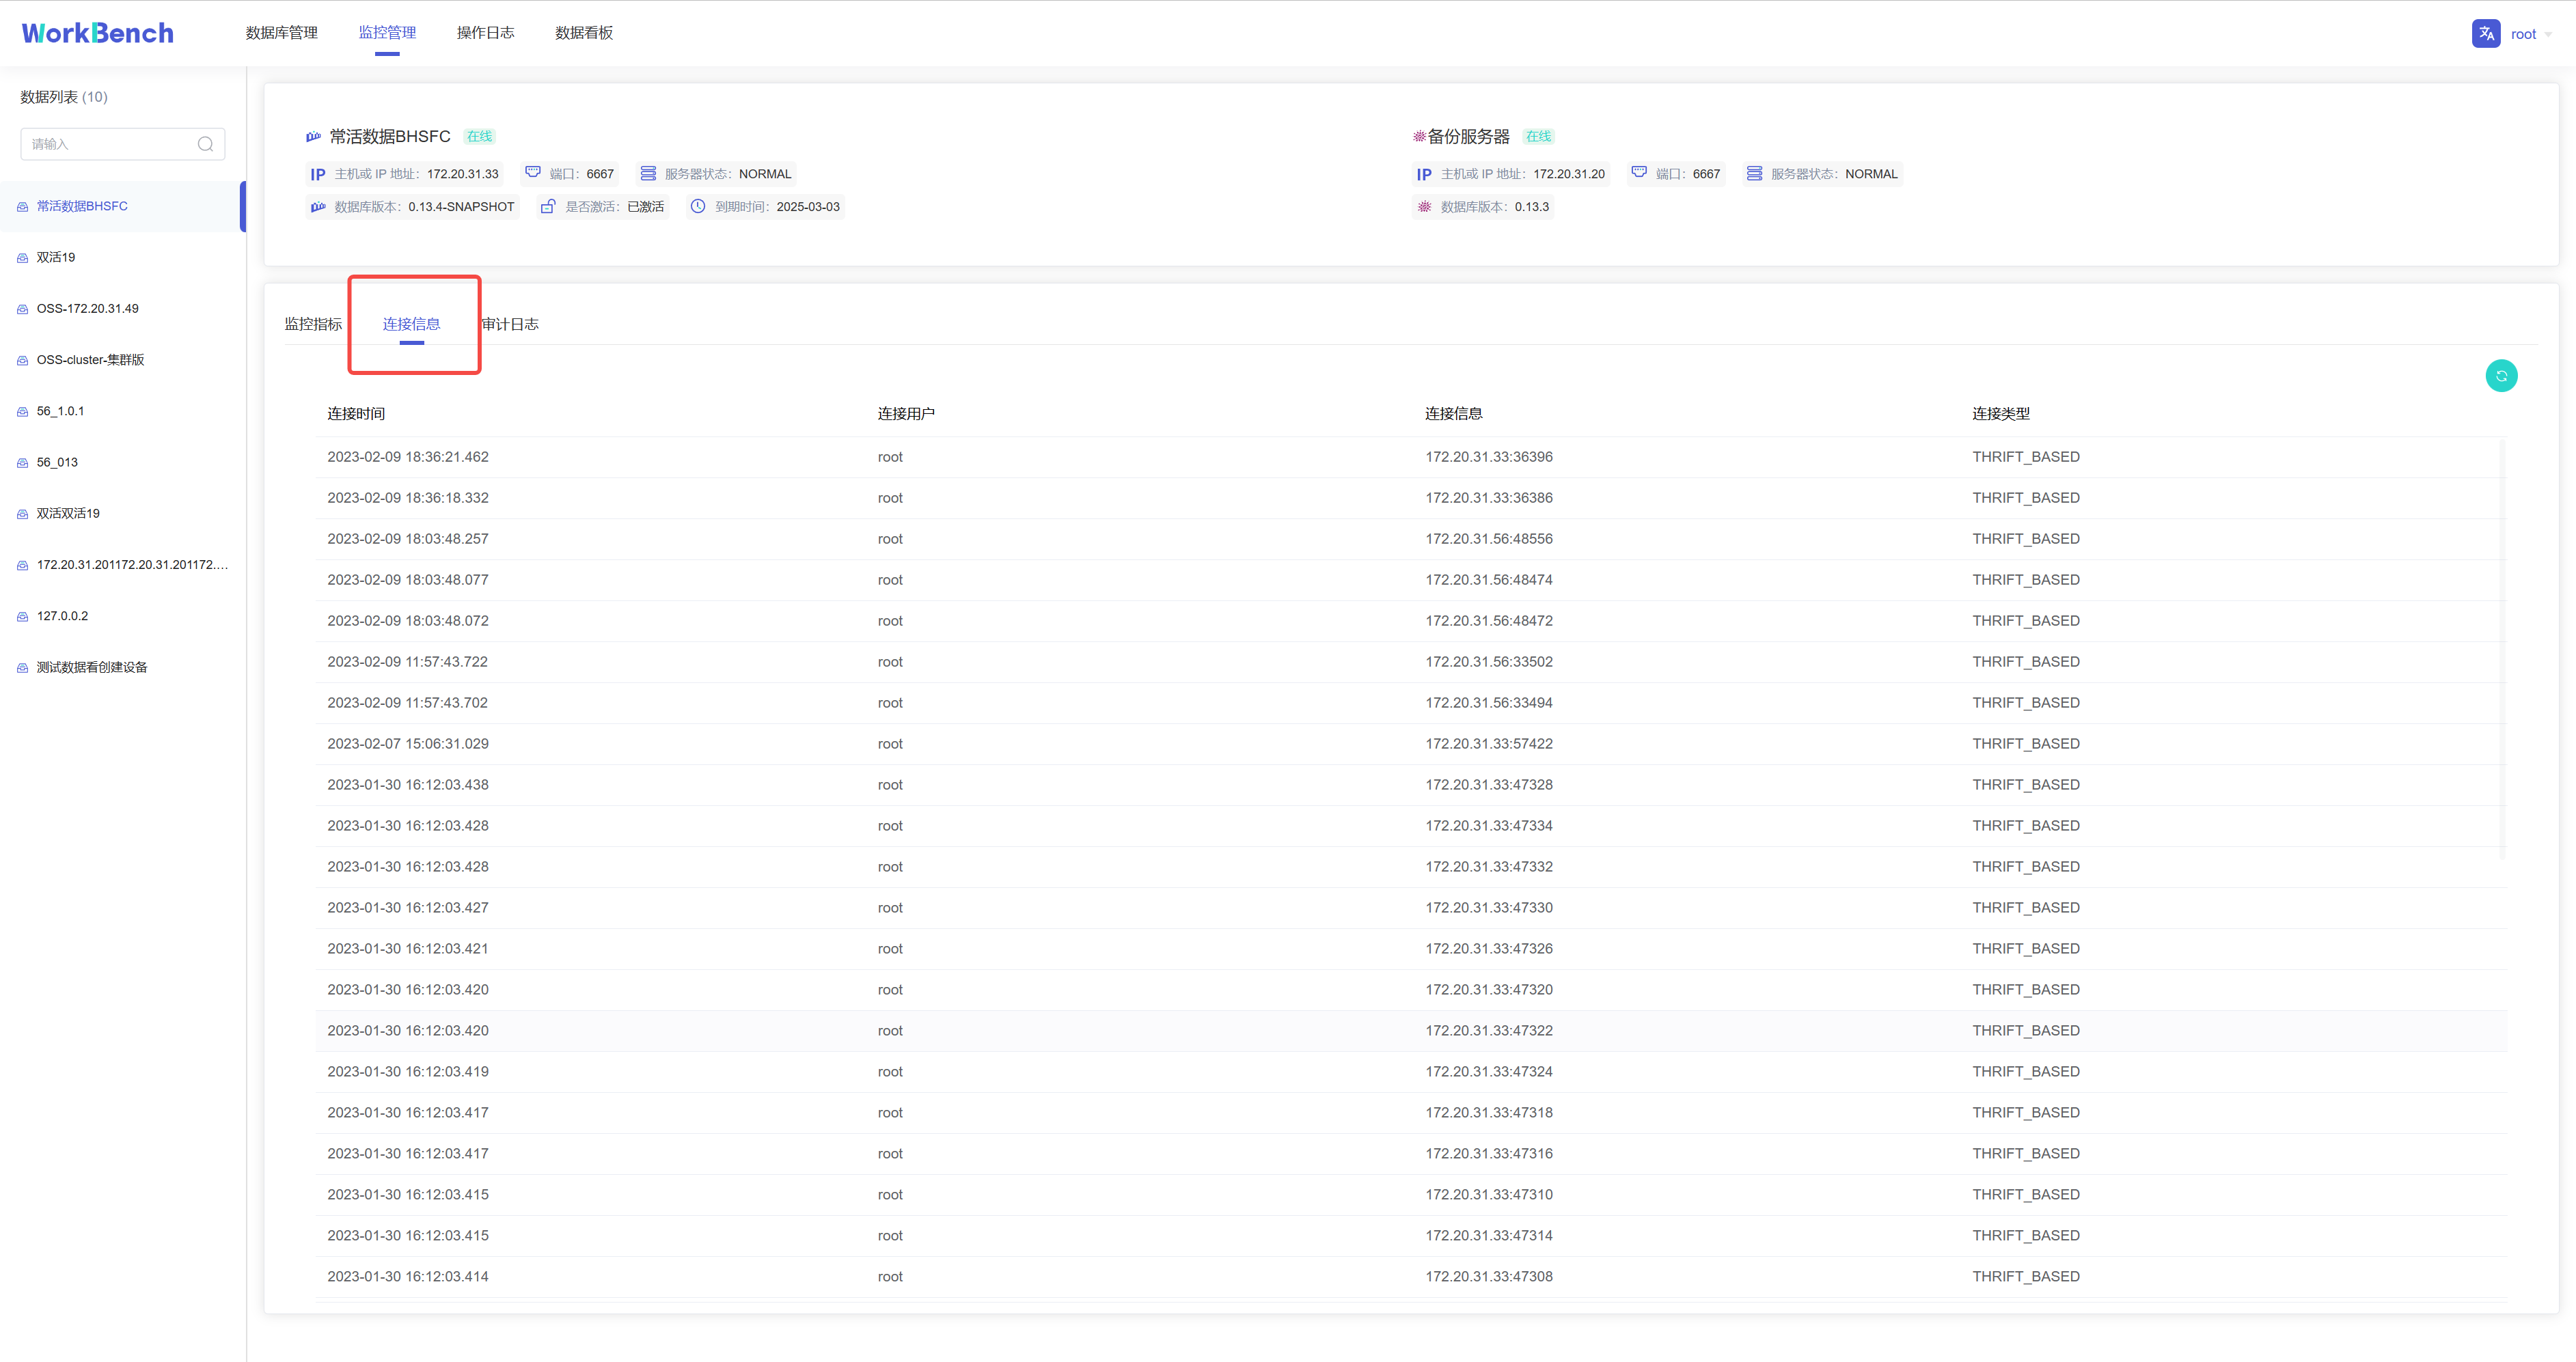
**审计日志**
审计日志显示所有在IoTDB执行的操作,Workbench提供查询接口,可按时间段或用户名进行查询。"审计日志"功能仅在企业版中支持。
-
+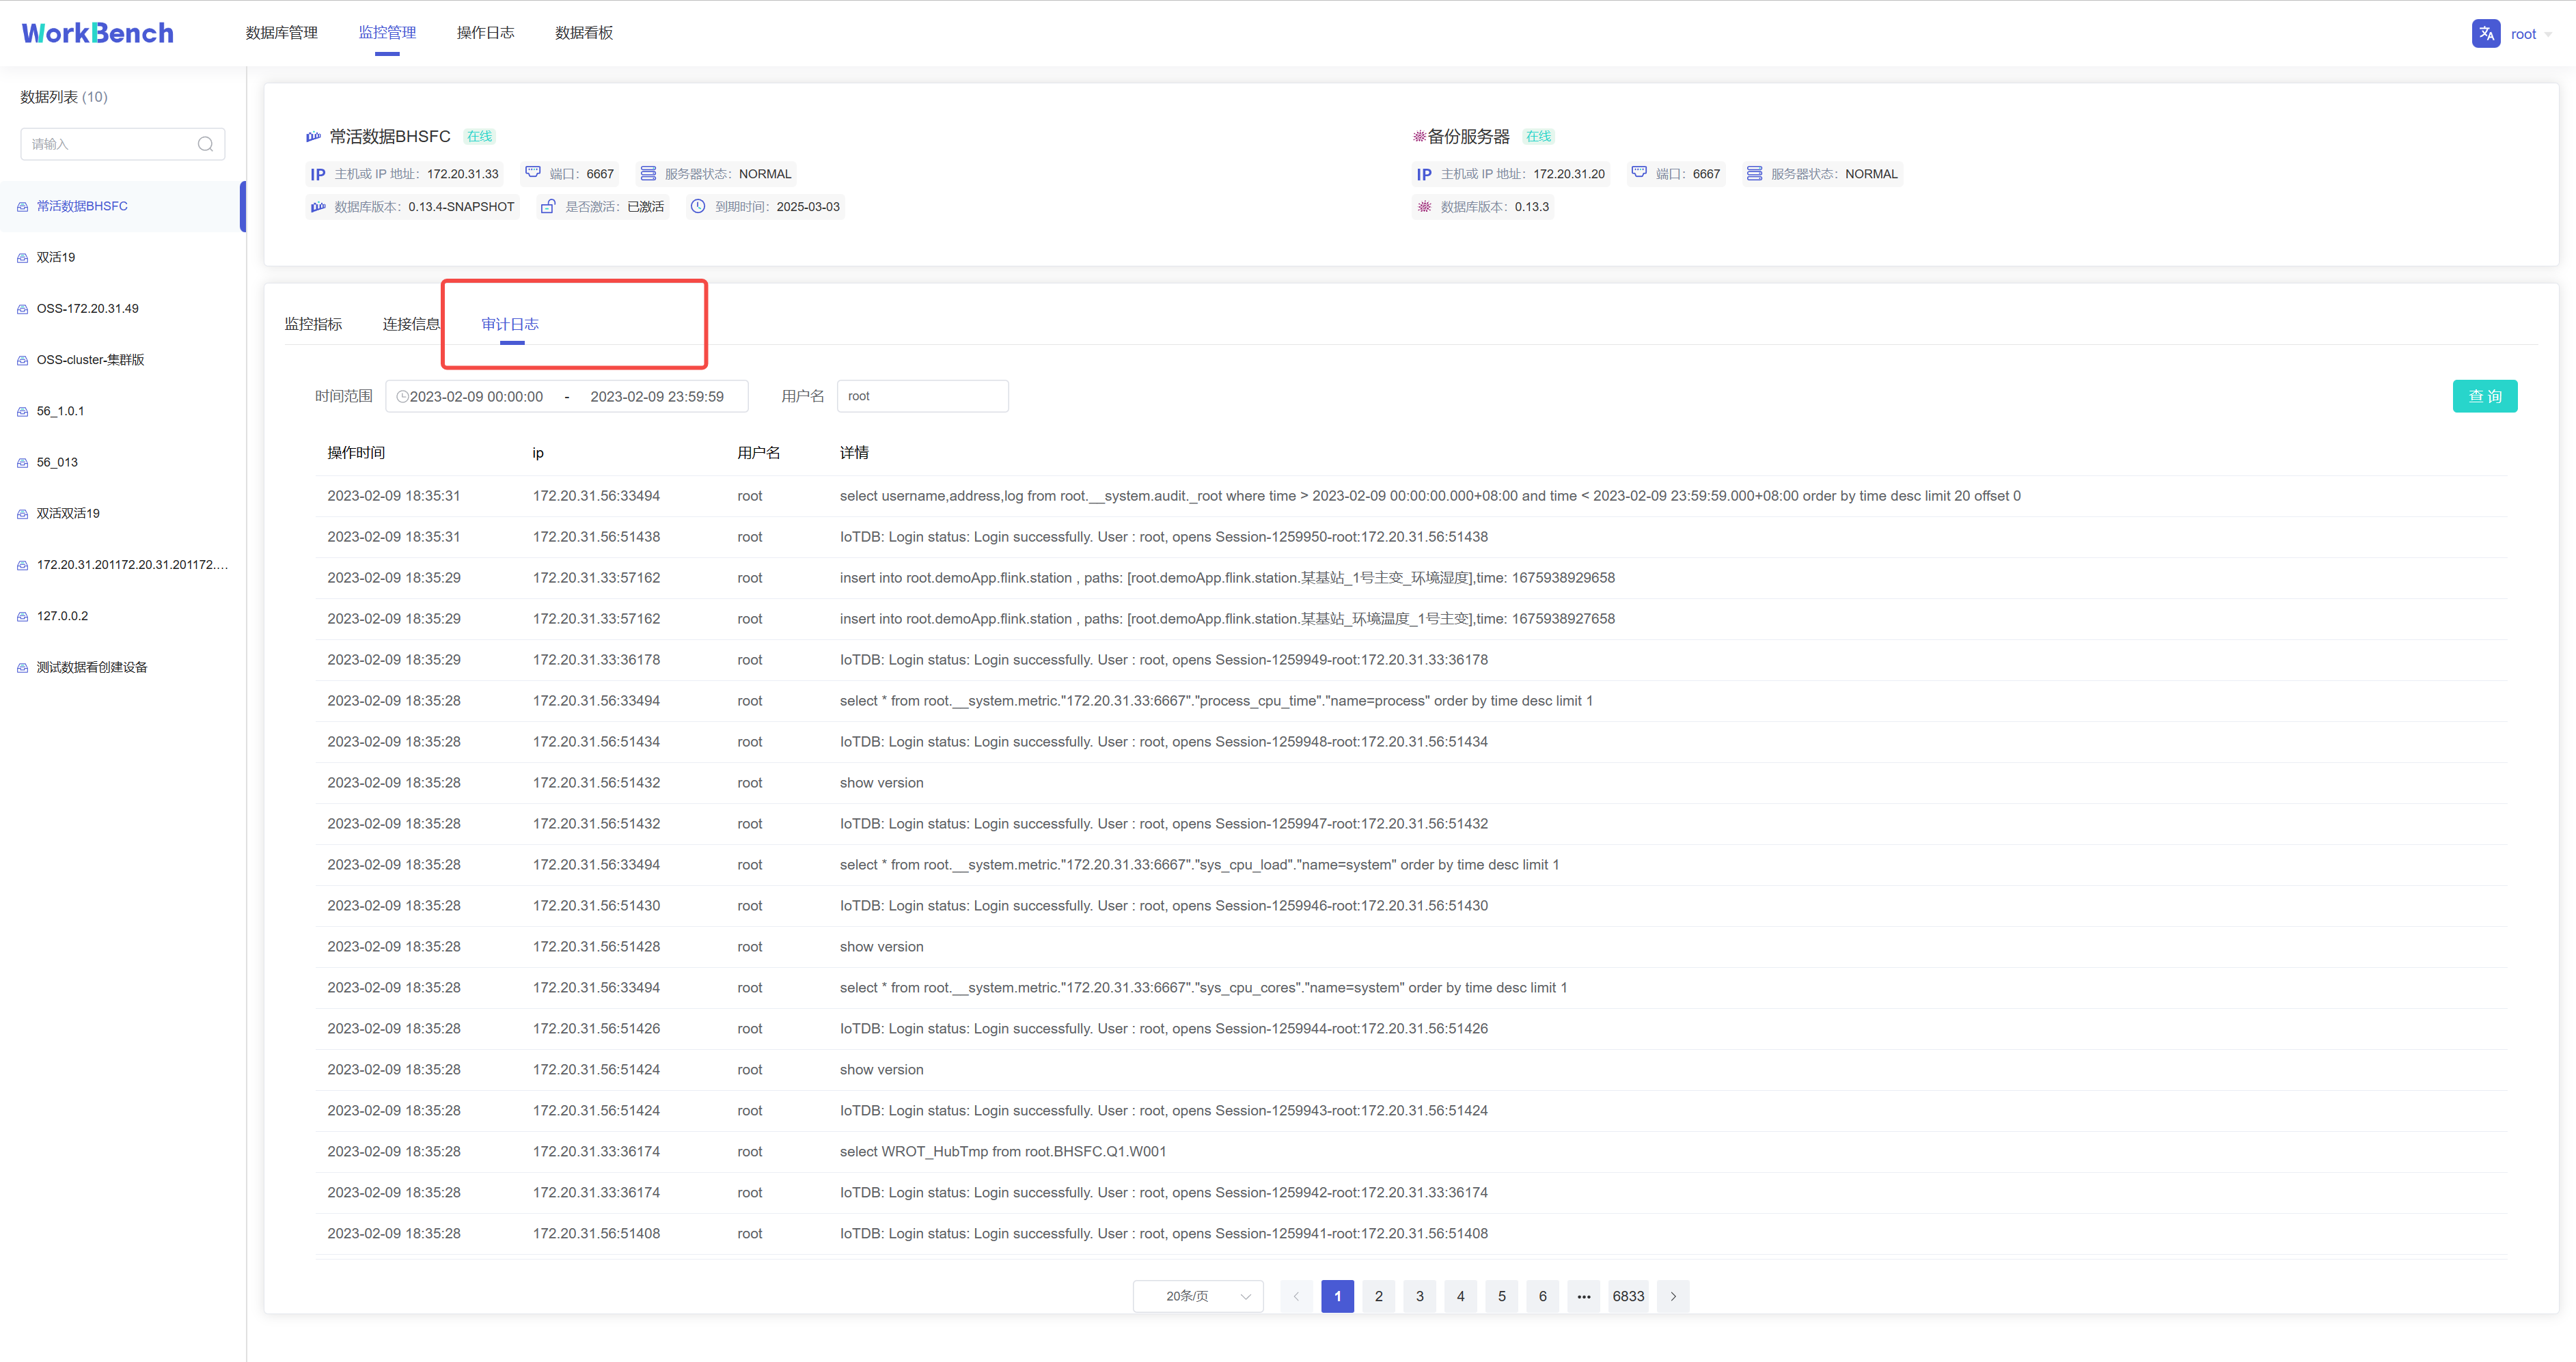
## 数据看板
数据看板可供创建数据库数据的直观表示,下图为挂载Grafana模板的仪表盘。
-
+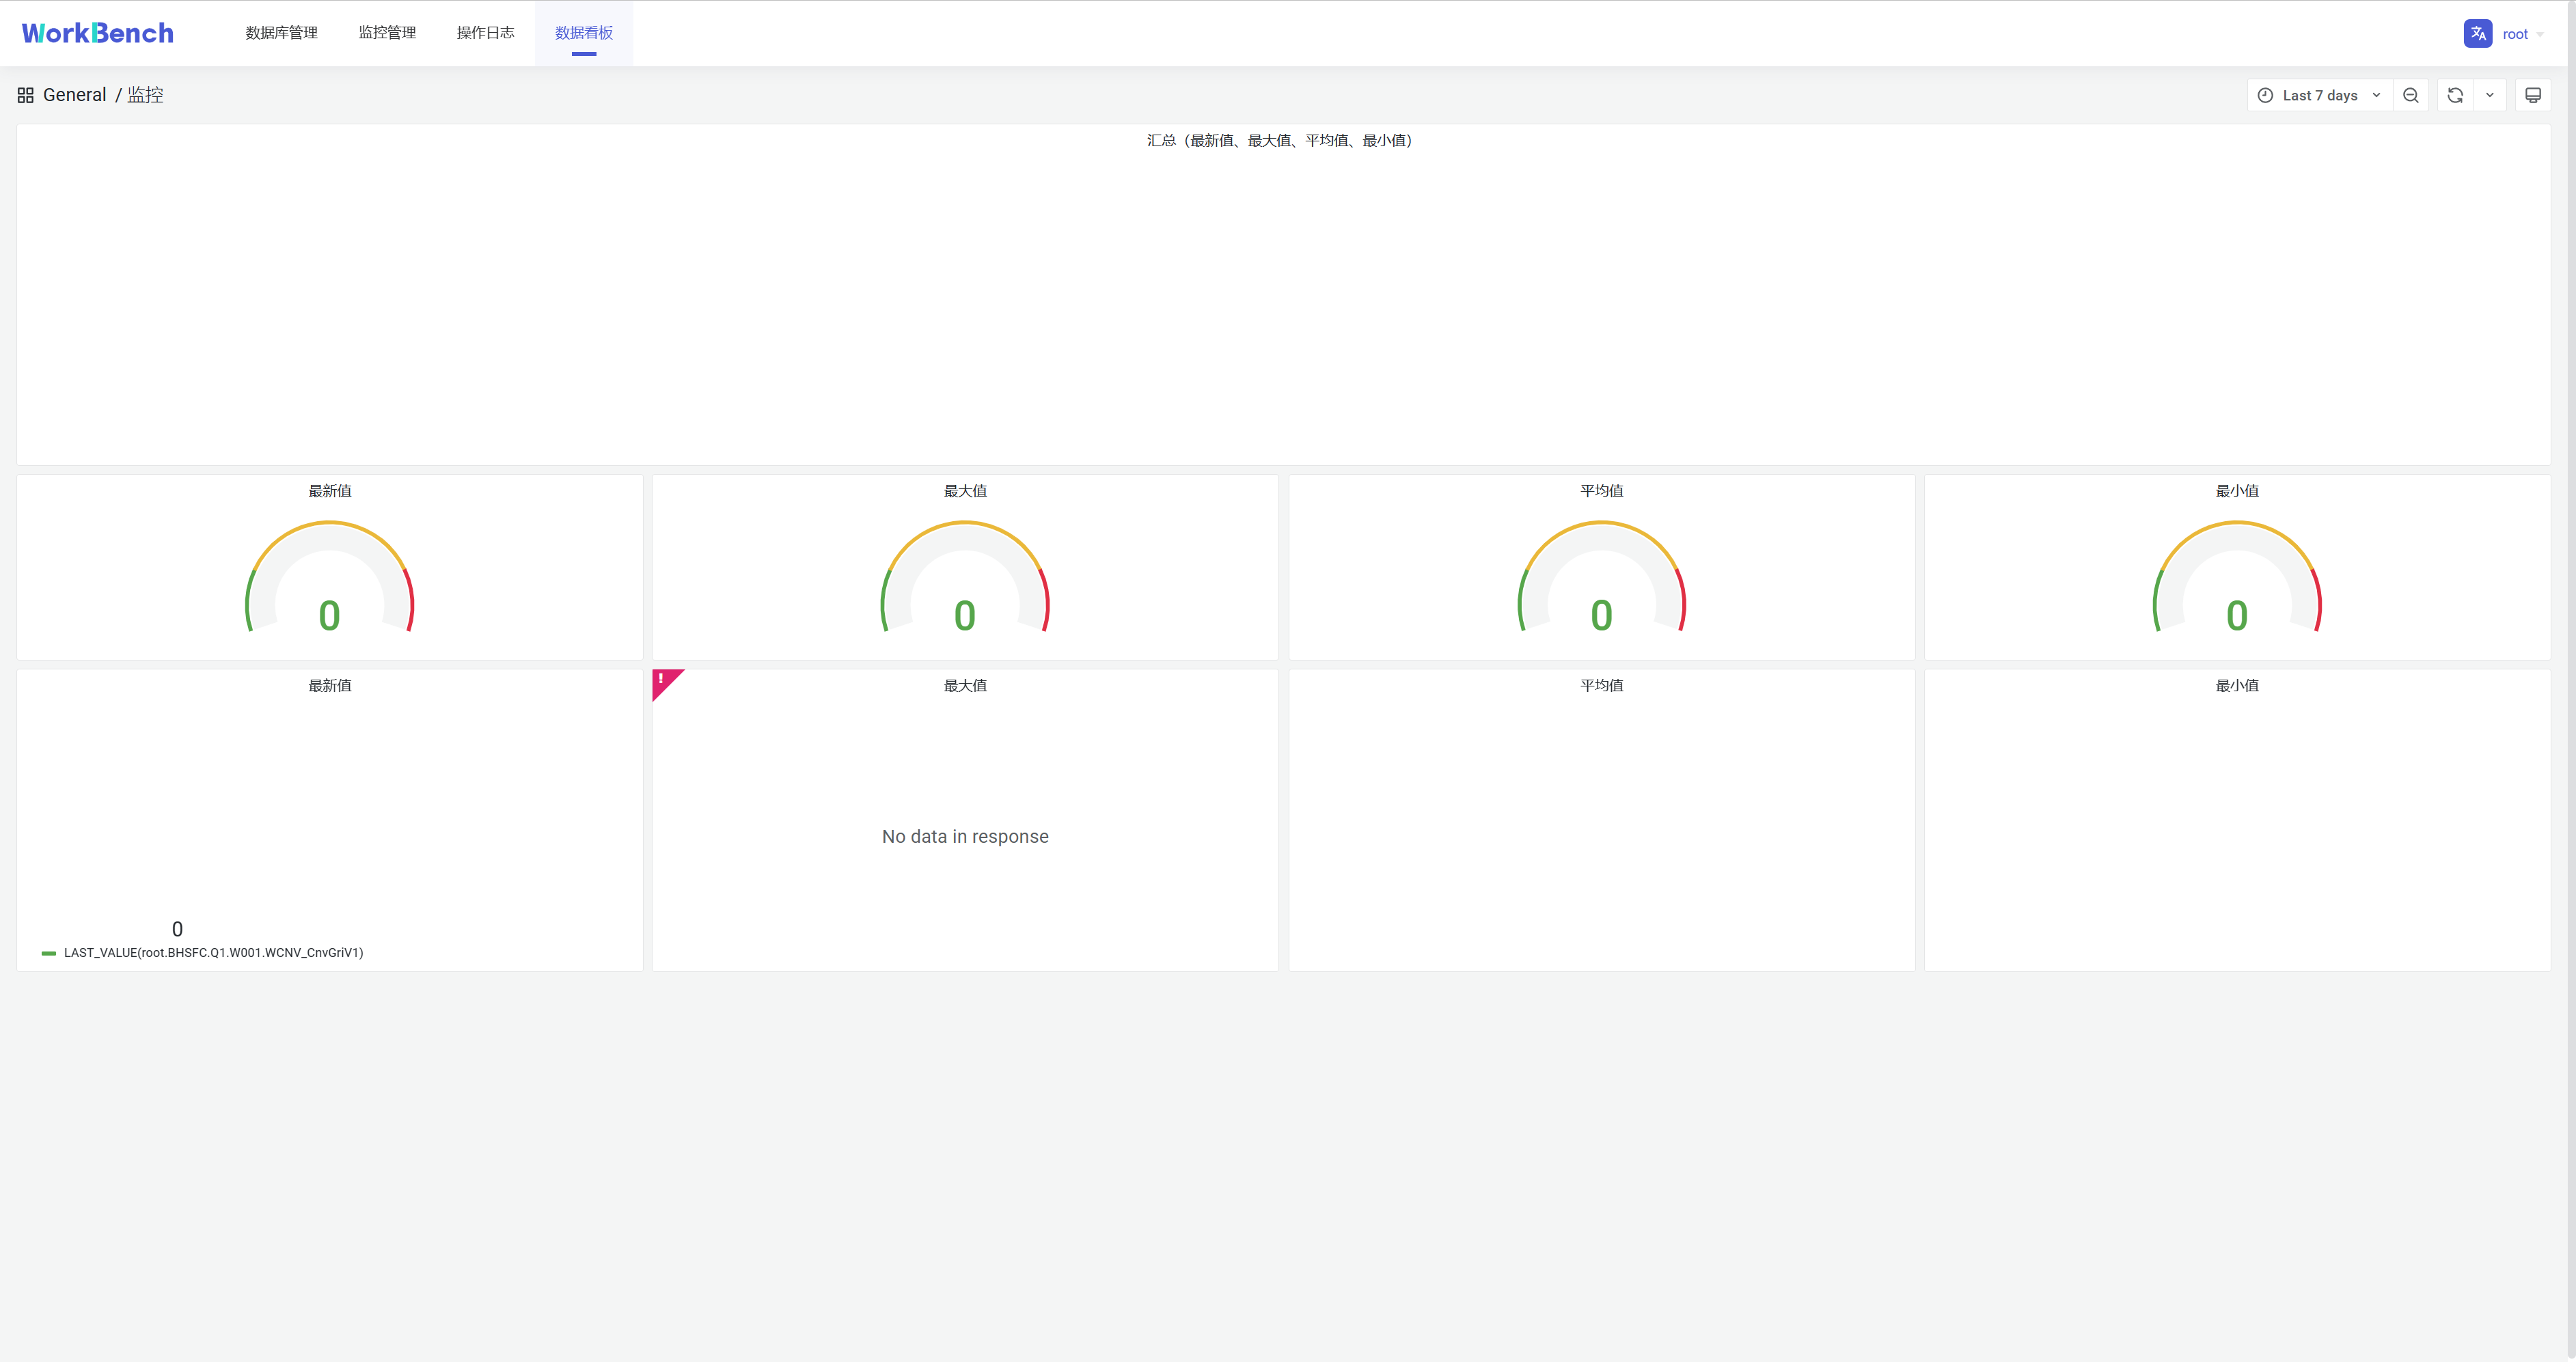
**配置**
@@ -407,13 +407,13 @@ url.dashboard=https://grafana.com/
登录Grafan面板,点击分享按钮,在弹出的窗口选择"**Link**",复制"**Link
URL**"即可。
-
+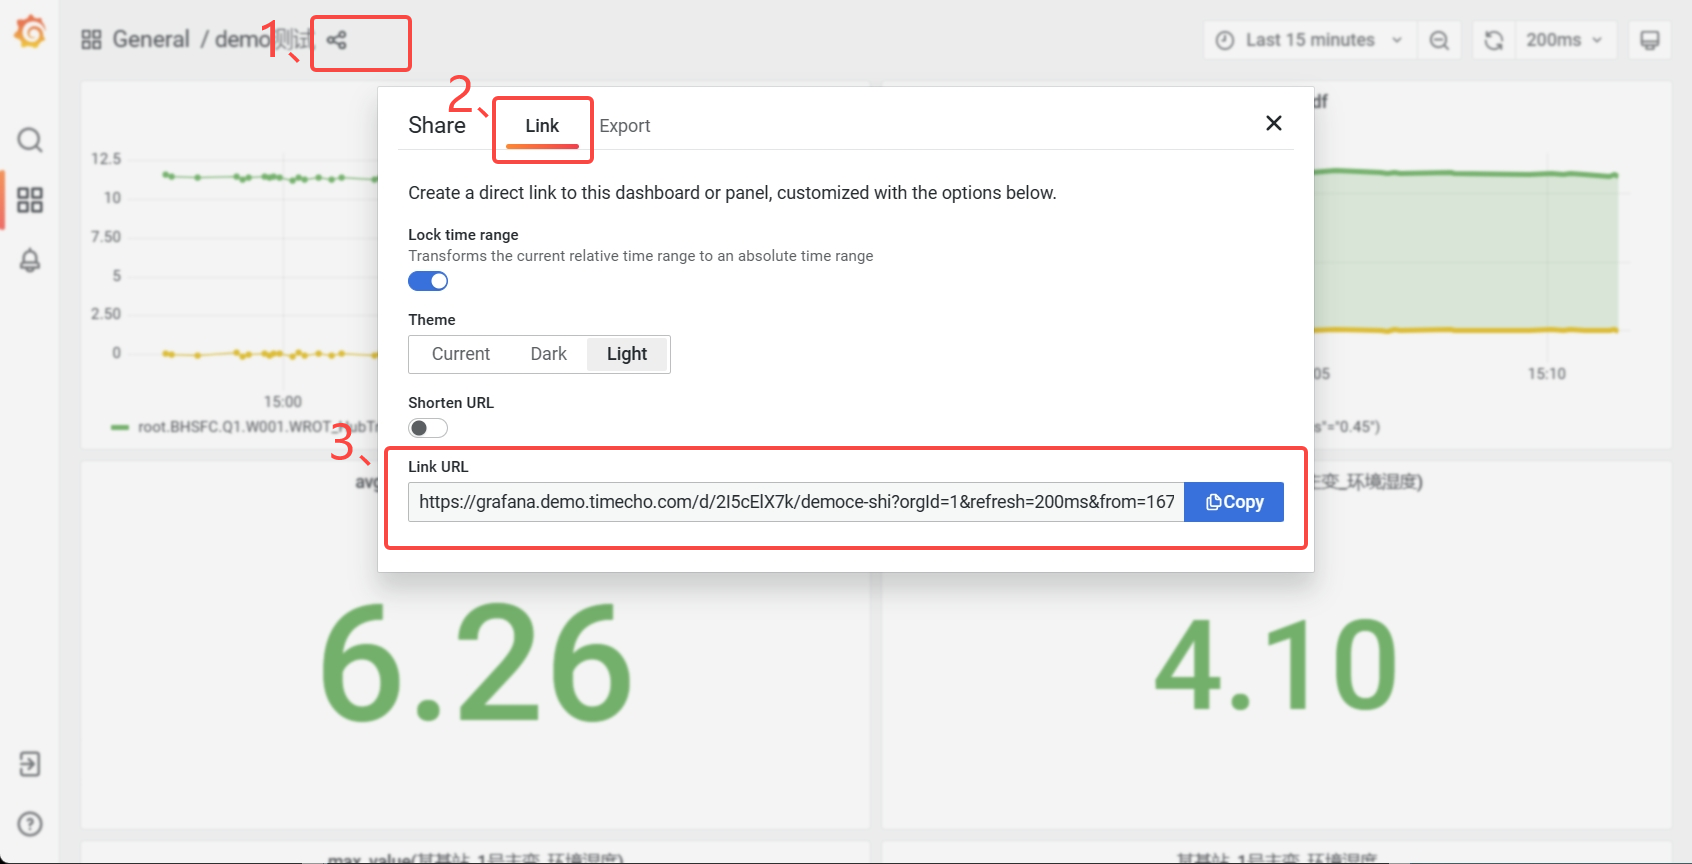
## Q&A
1. 如果遇到以下情况,请尝试退出"无痕模式"或者更换浏览器。
-
+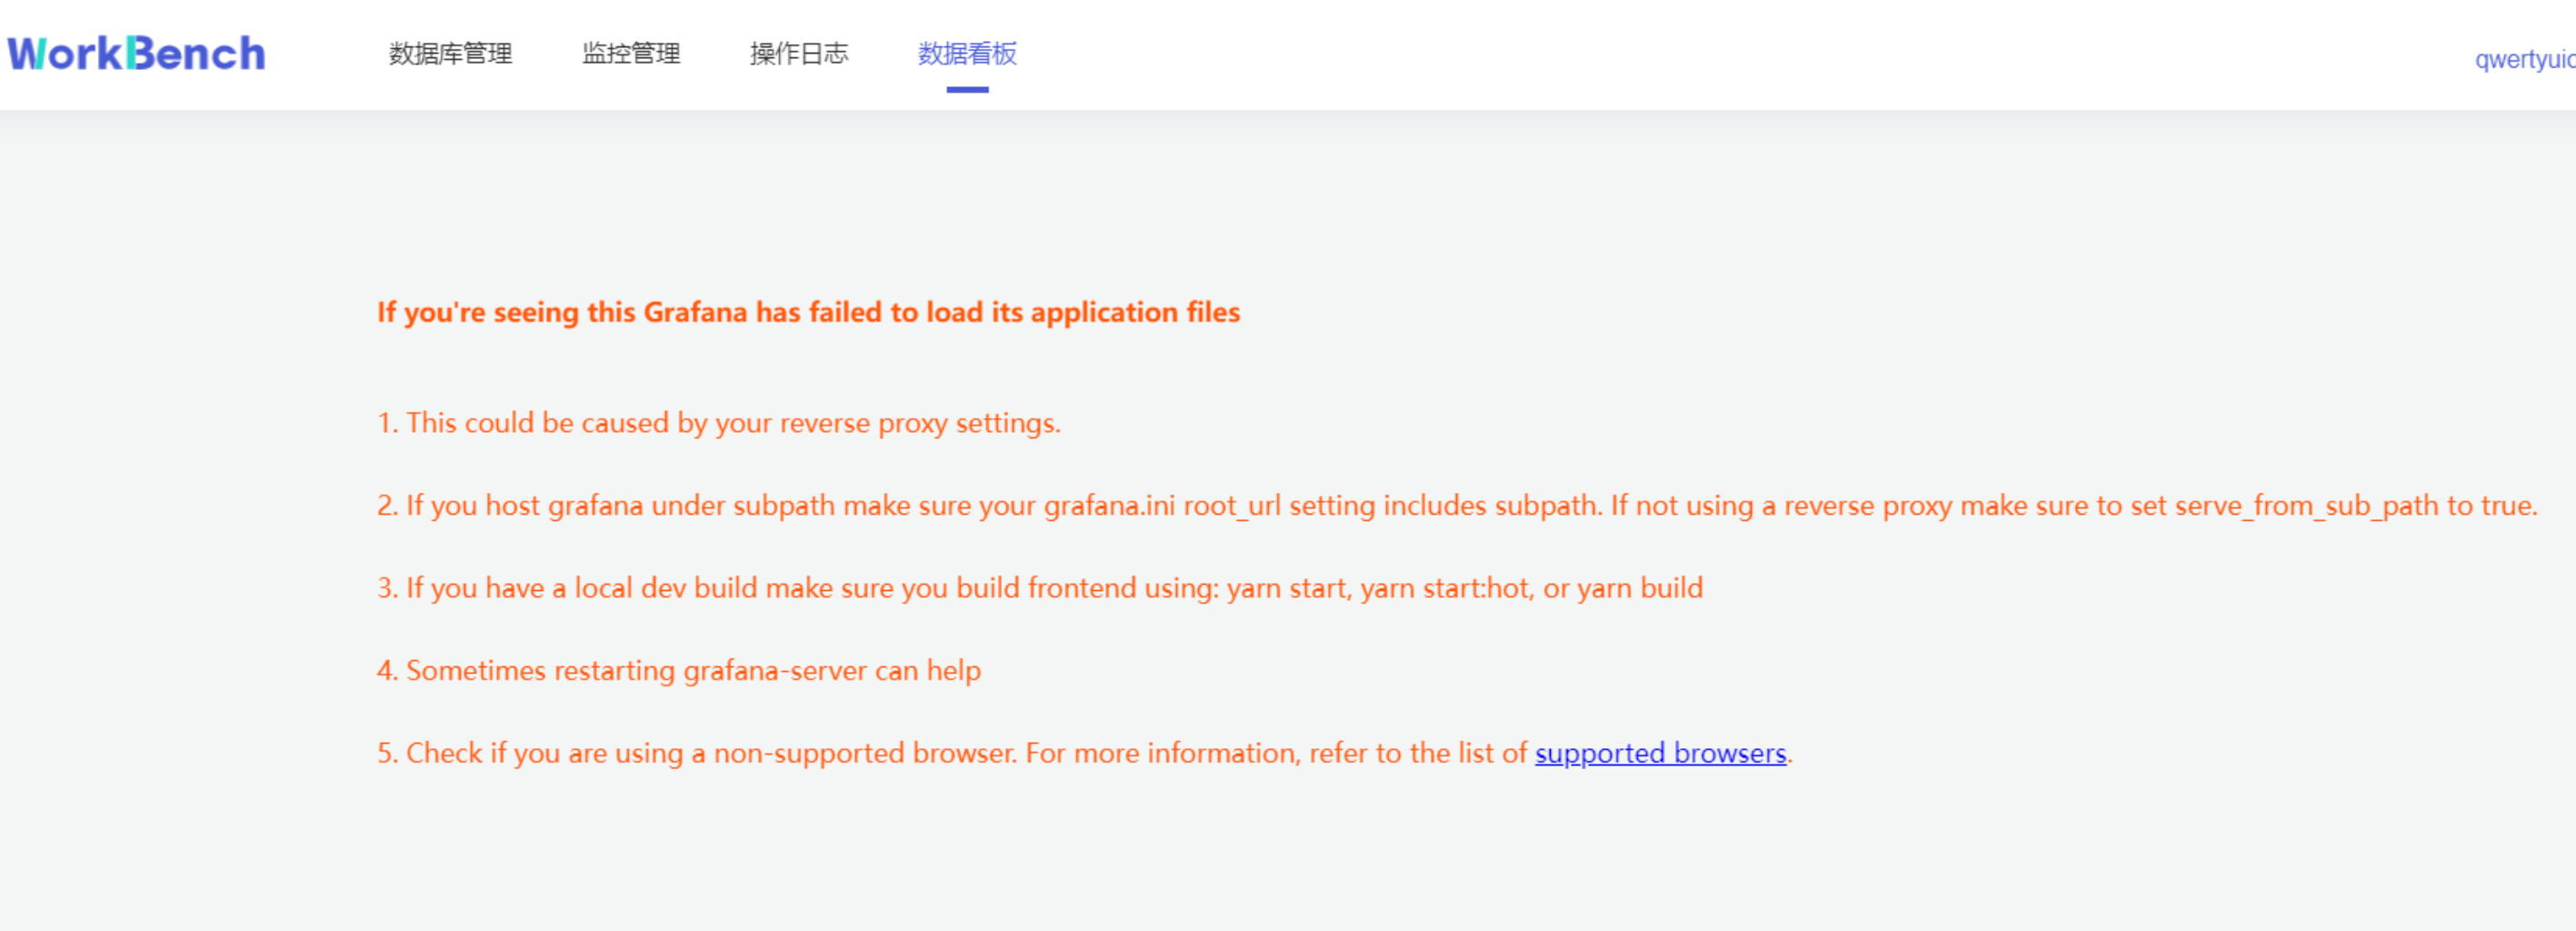
2. 如果看不到监控信息,需要开启TimechoDB的Metric。
diff --git a/docs/zh/UserGuide/Ecosystem-Integration/Writing-Data-on-HDFS.md b/docs/zh/UserGuide/Ecosystem-Integration/Writing-Data-on-HDFS.md
index 65a71e1331..8a3d3817b0 100644
--- a/docs/zh/UserGuide/Ecosystem-Integration/Writing-Data-on-HDFS.md
+++ b/docs/zh/UserGuide/Ecosystem-Integration/Writing-Data-on-HDFS.md
@@ -29,7 +29,7 @@
当你配置使用 HDFS 存储 TSFile 之后,你的数据文件将会被分布式存储。系统架构如下:
-<img style="width:100%; max-width:700px; max-height:600px; margin-left:auto; margin-right:auto; display:block;" src="/img/github/66922722-35180400-f05a-11e9-8ff0-7dd51716e4a8.png">
+<img style="width:100%; max-width:700px; max-height:600px; margin-left:auto; margin-right:auto; display:block;" src="https://alioss.timecho.com/docs/img/github/66922722-35180400-f05a-11e9-8ff0-7dd51716e4a8.png">
#### Config and usage
diff --git a/docs/zh/UserGuide/Ecosystem-Integration/Zeppelin-IoTDB.md b/docs/zh/UserGuide/Ecosystem-Integration/Zeppelin-IoTDB.md
index 46a0fb015e..b84bdefd35 100644
--- a/docs/zh/UserGuide/Ecosystem-Integration/Zeppelin-IoTDB.md
+++ b/docs/zh/UserGuide/Ecosystem-Integration/Zeppelin-IoTDB.md
@@ -25,7 +25,7 @@
Apache Zeppelin 是一个基于网页的交互式数据分析系统。用户可以通过 Zeppelin 连接数据源并使用 SQL、Scala 等进行交互式操作。操作可以保存为文档(类似于 Jupyter)。Zeppelin 支持多种数据源,包括 Spark、ElasticSearch、Cassandra 和 InfluxDB 等等。现在,IoTDB 已经支持使用 Zeppelin 进行操作。样例如下:
-
+
### Zeppelin-IoTDB 解释器
@@ -105,7 +105,7 @@ or
现在可以开始使用 Zeppelin 操作 IoTDB 了。
-
+
我们提供了一些简单的 SQL 来展示 Zeppelin-IoTDB 解释器的使用:
@@ -138,7 +138,7 @@ WHERE time >= 1
样例如下:
-
+
用户也可以参考 [[1]](https://zeppelin.apache.org/docs/0.9.0/usage/display_system/basic.html) 编写更丰富多彩的文档。
@@ -148,7 +148,7 @@ WHERE time >= 1
进入页面 [http://127.0.0.1:8080/#/interpreter](http://127.0.0.1:8080/#/interpreter) 并配置 IoTDB 的连接参数:
-
+
可配置参数默认值和解释如下:
diff --git a/docs/zh/UserGuide/Edge-Cloud-Collaboration/Sync-Tool.md b/docs/zh/UserGuide/Edge-Cloud-Collaboration/Sync-Tool.md
index 100c65125f..78ea9adbd6 100644
--- a/docs/zh/UserGuide/Edge-Cloud-Collaboration/Sync-Tool.md
+++ b/docs/zh/UserGuide/Edge-Cloud-Collaboration/Sync-Tool.md
@@ -31,7 +31,7 @@ IoTDB 同步工具内嵌于 IoTDB 引擎,与下游接收端相连,下游支
## 2.模型定义
-
+
TsFile 同步工具实现了数据从 "流入-> IoTDB ->流出" 的闭环。假设目前有两台机器A和B都安装了IoTDB,希望将 A 上的数据不断同步至 B 中。为了更好地描述这个过程,我们引入以下概念。
diff --git a/docs/zh/UserGuide/IoTDB-Introduction/Architecture.md b/docs/zh/UserGuide/IoTDB-Introduction/Architecture.md
index 406908fc52..3654bbc487 100644
--- a/docs/zh/UserGuide/IoTDB-Introduction/Architecture.md
+++ b/docs/zh/UserGuide/IoTDB-Introduction/Architecture.md
@@ -25,7 +25,7 @@ IoTDB 套件由若干个组件构成,共同形成“数据收集-数据写入-
如下图展示了使用 IoTDB 套件全部组件后形成的整体应用架构。下文称所有组件形成 IoTDB 套件,而 IoTDB 特指其中的时间序列数据库组件。
-<img style="width:100%; max-width:800px; max-height:600px; margin-left:auto; margin-right:auto; display:block;" src="/img/UserGuide/IoTDB-Introduction/Architecture/Structure-of-Apache-IoTDB-cn.png?raw=true">
+<img style="width:100%; max-width:800px; max-height:600px; margin-left:auto; margin-right:auto; display:block;" src="https://alioss.timecho.com/docs/img/UserGuide/IoTDB-Introduction/Architecture/Structure-of-Apache-IoTDB-cn.png?raw=true">
在上图中,用户可以通过 JDBC 将来自设备上传感器采集的时序数据、服务器负载和 CPU 内存等系统状态数据、消息队列中的时序数据、应用程序的时序数据或者其他数据库中的时序数据导入到本地或者远程的 IoTDB 中。用户还可以将上述数据直接写成本地(或位于 HDFS 上)的 TsFile 文件。
diff --git a/docs/zh/UserGuide/IoTDB-Introduction/Scenario.md b/docs/zh/UserGuide/IoTDB-Introduction/Scenario.md
index 2eda6e8990..c963010c2c 100644
--- a/docs/zh/UserGuide/IoTDB-Introduction/Scenario.md
+++ b/docs/zh/UserGuide/IoTDB-Introduction/Scenario.md
@@ -29,11 +29,11 @@
此时可以采用 IoTDB 套件中的 TsFile 组件、TsFileSync 工具和 Hadoop/Spark 集成组件对数据进行存储:每新印刷一个芯片,就在 SPI 设备上使用 SDK 写一条数据,这些数据最终形成一个 TsFile 文件。通过 TsFileSync 工具,生成的 TsFile 文件将按一定规则(如每天)被同步到 Hadoop 数据中心,并由数据分析人员对其进行分析。
-<img style="width:100%; max-width:800px; max-height:600px; margin-left:auto; margin-right:auto; display:block;" src="/img/github/51579014-695ef980-1efa-11e9-8cbc-e9e7ee4fa0d8.png">
+<img style="width:100%; max-width:800px; max-height:600px; margin-left:auto; margin-right:auto; display:block;" src="https://alioss.timecho.com/docs/img/github/51579014-695ef980-1efa-11e9-8cbc-e9e7ee4fa0d8.png">
在场景 1 中,仅需要 TsFile、TsFileSync 部署在一台 PC 上,此外还需要部署 Hadoop/Spark 连接器用于数据中心端 Hadoop/Spark 集群的数据存储和分析。其示意图如上图所示。下图展示了此时的应用架构。
-<img style="width:100%; max-width:800px; max-height:600px; margin-left:auto; margin-right:auto; display:block;" src="/img/github/81768490-bf034f00-950d-11ea-9b56-fef3edca0958.png">
+<img style="width:100%; max-width:800px; max-height:600px; margin-left:auto; margin-right:auto; display:block;" src="https://alioss.timecho.com/docs/img/github/81768490-bf034f00-950d-11ea-9b56-fef3edca0958.png">
* 场景 2
@@ -43,11 +43,11 @@
此时可以采用 IoTDB 套件中的 IoTDB、TsFileSync 工具和 Hadoop/Spark 集成组件等。需要部署一个场控 PC 机,其上安装 IoTDB 和 TsFileSync 工具,用于支持读写数据、本地计算和分析以及上传数据到数据中心。此外还需要部署 Hadoop/Spark 连接器用于数据中心端 Hadoop/Spark 集群的数据存储和分析。如下图所示。
-<img style="width:100%; max-width:800px; max-height:600px; margin-left:auto; margin-right:auto; display:block;" src="/img/github/51579033-7ed42380-1efa-11e9-889f-fb4180291a9e.png">
+<img style="width:100%; max-width:800px; max-height:600px; margin-left:auto; margin-right:auto; display:block;" src="https://alioss.timecho.com/docs/img/github/51579033-7ed42380-1efa-11e9-889f-fb4180291a9e.png">
下图给出了此时的应用架构。
-<img style="width:100%; max-width:800px; max-height:600px; margin-left:auto; margin-right:auto; display:block;" src="/img/github/51579064-8f849980-1efa-11e9-8cd6-a7339cd0540f.jpg">
+<img style="width:100%; max-width:800px; max-height:600px; margin-left:auto; margin-right:auto; display:block;" src="https://alioss.timecho.com/docs/img/github/51579064-8f849980-1efa-11e9-8cd6-a7339cd0540f.jpg">
* 场景 3
@@ -57,11 +57,11 @@
此时,可以采用 IoTDB 套件中的 IoTDB、IoTDB-Client 工具、TsFileSync 工具和 Hadoop/Spark 集成组件等。将 IoTDB 服务器安装在工厂连接外网的服务器上,用户接收机械手传输的数据并将数据上传到数据中心。将 IoTDB-Client 工具安装在每一个连接工厂内网的机械手上,用于将传感器产生的实时数据上传到工厂内部服务器。再使用 TsFileSync 工具将原始数据上传到数据中心。此外还需要部署 Hadoop/Spark 连接器用于数据中心端 Hadoop/Spark 集群的数据存储和分析。如下图中间场景所示。
-<img style="width:100%; max-width:800px; max-height:600px; margin-left:auto; margin-right:auto; display:block;" src="/img/github/51579080-96aba780-1efa-11e9-87ac-940c45b19dd7.jpg">
+<img style="width:100%; max-width:800px; max-height:600px; margin-left:auto; margin-right:auto; display:block;" src="https://alioss.timecho.com/docs/img/github/51579080-96aba780-1efa-11e9-87ac-940c45b19dd7.jpg">
下图给出了此时的应用架构。
-<img style="width:100%; max-width:800px; max-height:600px; margin-left:auto; margin-right:auto; display:block;" src="/img/github/81768477-b874d780-950d-11ea-80ca-8807b9bd0970.png">
+<img style="width:100%; max-width:800px; max-height:600px; margin-left:auto; margin-right:auto; display:block;" src="https://alioss.timecho.com/docs/img/github/81768477-b874d780-950d-11ea-80ca-8807b9bd0970.png">
* 场景 4
@@ -73,4 +73,4 @@
此外还需要部署 Hadoop/Spark 集群用于数据中心端的数据存储和分析。如下图所示。
-<img style="width:100%; max-width:800px; max-height:600px; margin-left:auto; margin-right:auto; display:block;" src="/img/github/51579095-a4f9c380-1efa-11e9-9f95-17165ec55568.jpg">
+<img style="width:100%; max-width:800px; max-height:600px; margin-left:auto; margin-right:auto; display:block;" src="https://alioss.timecho.com/docs/img/github/51579095-a4f9c380-1efa-11e9-9f95-17165ec55568.jpg">
diff --git a/docs/zh/UserGuide/Maintenance-Tools/JMX-Tool.md b/docs/zh/UserGuide/Maintenance-Tools/JMX-Tool.md
index bc939582f4..6cfe2a3051 100644
--- a/docs/zh/UserGuide/Maintenance-Tools/JMX-Tool.md
+++ b/docs/zh/UserGuide/Maintenance-Tools/JMX-Tool.md
@@ -49,11 +49,11 @@ JMX_IP="the_real_iotdb_server_ip" # 填写实际 IoTDB 的 IP 地址
1. 确保安装 jdk 8。jdk 8 以上需要 [下载 visualvm](https://visualvm.github.io/download.html)
2. 打开 jvisualvm
3. 在左侧导航栏空白处右键 -> 添加 JMX 连接
-<img style="width:100%; max-width:300px; max-height:600px; margin-left:auto; margin-right:auto; display:block;" src="/img/github/81462914-5738c580-91e8-11ea-94d1-4ff6607e7e2c.png">
+<img style="width:100%; max-width:300px; max-height:600px; margin-left:auto; margin-right:auto; display:block;" src="https://alioss.timecho.com/docs/img/github/81462914-5738c580-91e8-11ea-94d1-4ff6607e7e2c.png">
4. 填写信息进行登录,按下图分别填写,注意需要勾选”不要求 SSL 连接”。
例如:
连接:192.168.130.15:31999
用户名:iotdb
口令:passw!d
-<img style="width:100%; max-width:300px; max-height:600px; margin-left:auto; margin-right:auto; display:block;" src="/img/github/81462909-53a53e80-91e8-11ea-98df-0012380da0b2.png">
+<img style="width:100%; max-width:300px; max-height:600px; margin-left:auto; margin-right:auto; display:block;" src="https://alioss.timecho.com/docs/img/github/81462909-53a53e80-91e8-11ea-98df-0012380da0b2.png">
diff --git a/docs/zh/UserGuide/Maintenance-Tools/Log-Tool.md b/docs/zh/UserGuide/Maintenance-Tools/Log-Tool.md
index ca905e4f11..bf43f2831f 100644
--- a/docs/zh/UserGuide/Maintenance-Tools/Log-Tool.md
+++ b/docs/zh/UserGuide/Maintenance-Tools/Log-Tool.md
@@ -33,15 +33,15 @@ IoTDB 支持用户通过修改日志配置文件的方式对 IoTDB 系统日志
本节以 Jconsole 为例介绍连接 JMX 并进入动态系统日志配置模块的方法。启动 Jconsole 控制页面,在新建连接处建立与 IoTDB Server 的 JMX 连接(可以选择本地进程或给定 IoTDB 的 IP 及 PORT 进行远程连接,IoTDB 的 JMX 服务默认运行端口为 31999),如下图使用远程进程连接 Localhost 下运行在 31999 端口的 IoTDB JMX 服务。
-<img style="width:100%; max-width:800px; max-height:600px; margin-left:auto; margin-right:auto; display:block;" src="/img/github/51577195-f94d7500-1ef3-11e9-999a-b4f67055d80e.png">
+<img style="width:100%; max-width:800px; max-height:600px; margin-left:auto; margin-right:auto; display:block;" src="https://alioss.timecho.com/docs/img/github/51577195-f94d7500-1ef3-11e9-999a-b4f67055d80e.png">
连接到 JMX 后,您可以通过 MBean 选项卡找到名为`ch.qos.logback.classic`的`MBean`,如下图所示。
-<img style="width:100%; max-width:800px; max-height:600px; margin-left:auto; margin-right:auto; display:block;" src="/img/github/51577204-fe122900-1ef3-11e9-9e89-2eb1d46e24b8.png">
+<img style="width:100%; max-width:800px; max-height:600px; margin-left:auto; margin-right:auto; display:block;" src="https://alioss.timecho.com/docs/img/github/51577204-fe122900-1ef3-11e9-9e89-2eb1d46e24b8.png">
在`ch.qos.logback.classic`的 MBean 操作(Operations)选项中,可以看到当前动态系统日志配置支持的 6 种接口,您可以通过使用相应的方法,来执行相应的操作,操作页面如图。
-<img style="width:100%; max-width:800px; max-height:600px; margin-left:auto; margin-right:auto; display:block;" src="/img/github/51577216-09fdeb00-1ef4-11e9-9005-542ad7d9e9e0.png">
+<img style="width:100%; max-width:800px; max-height:600px; margin-left:auto; margin-right:auto; display:block;" src="https://alioss.timecho.com/docs/img/github/51577216-09fdeb00-1ef4-11e9-9005-542ad7d9e9e0.png">
#### 动态系统日志接口说明
diff --git a/docs/zh/UserGuide/Monitor-Alert/Alerting.md b/docs/zh/UserGuide/Monitor-Alert/Alerting.md
index cfd5a5d62a..655b4e93c3 100644
--- a/docs/zh/UserGuide/Monitor-Alert/Alerting.md
+++ b/docs/zh/UserGuide/Monitor-Alert/Alerting.md
@@ -367,4 +367,4 @@ INSERT INTO root.ln.wf01.wt01(timestamp, temperature) VALUES (5, 120);
会抑制 `severity` 为 `warning` 的告警,我们收到的告警邮件中只包含写入
`(5, 120)` 后触发的告警。
-<img alt="alerting" src="/img/github/115957896-a9791080-a537-11eb-9962-541412bdcee6.png">
+<img alt="alerting" src="https://alioss.timecho.com/docs/img/github/115957896-a9791080-a537-11eb-9962-541412bdcee6.png">
diff --git a/docs/zh/UserGuide/Monitor-Alert/Metric-Tool.md b/docs/zh/UserGuide/Monitor-Alert/Metric-Tool.md
index e687382eb9..6f30c1e5e0 100644
--- a/docs/zh/UserGuide/Monitor-Alert/Metric-Tool.md
+++ b/docs/zh/UserGuide/Monitor-Alert/Metric-Tool.md
@@ -489,18 +489,18 @@ Core 级别的监控指标在系统运行中默认开启,每一个 Core 级别
连接到 JMX 后,您可以通过 "MBeans" 标签找到名为 "org.apache.iotdb.metrics" 的 "MBean",可以在侧边栏中查看所有监控指标的具体值。
-<img style="width:100%; max-width:800px; max-height:600px; margin-left:auto; margin-right:auto; display:block;" alt="metric-jmx" src="/img/github/204018765-6fda9391-ebcf-4c80-98c5-26f34bd74df0.png">
+<img style="width:100%; max-width:800px; max-height:600px; margin-left:auto; margin-right:auto; display:block;" alt="metric-jmx" src="https://alioss.timecho.com/docs/img/github/204018765-6fda9391-ebcf-4c80-98c5-26f34bd74df0.png">
#### 5.1.2. 获取其他相关数据
连接到 JMX 后,您可以通过 "MBeans" 标签找到名为 "org.apache.iotdb.service" 的 "MBean",如下图所示,了解服务的基本状态
-<img style="width:100%; max-width:800px; max-height:600px; margin-left:auto; margin-right:auto; display:block;" src="/img/github/149951720-707f1ee8-32ee-4fde-9252-048caebd232e.png"> <br>
+<img style="width:100%; max-width:800px; max-height:600px; margin-left:auto; margin-right:auto; display:block;" src="https://alioss.timecho.com/docs/img/github/149951720-707f1ee8-32ee-4fde-9252-048caebd232e.png"> <br>
为了提高查询性能,IOTDB 对 ChunkMetaData 和 TsFileMetaData 进行了缓存。用户可以使用 MXBean
,展开侧边栏`org.apache.iotdb.db.service`查看缓存命中率:
-<img style="width:100%; max-width:800px; max-height:600px; margin-left:auto; margin-right:auto; display:block;" src="/img/github/112426760-73e3da80-8d73-11eb-9a8f-9232d1f2033b.png">
+<img style="width:100%; max-width:800px; max-height:600px; margin-left:auto; margin-right:auto; display:block;" src="https://alioss.timecho.com/docs/img/github/112426760-73e3da80-8d73-11eb-9a8f-9232d1f2033b.png">
### 5.2. 使用 Prometheus 方式
diff --git a/docs/zh/UserGuide/Operate-Metadata/Timeseries.md b/docs/zh/UserGuide/Operate-Metadata/Timeseries.md
index 71f4f2a5df..4b07d188a2 100644
--- a/docs/zh/UserGuide/Operate-Metadata/Timeseries.md
+++ b/docs/zh/UserGuide/Operate-Metadata/Timeseries.md
@@ -175,7 +175,7 @@ It costs 0.004s
那么 Metadata Tree 如下所示:
-<img style="width:100%; max-width:600px; margin-left:auto; margin-right:auto; display:block;" src="/img/github/69792176-1718f400-1201-11ea-861a-1a83c07ca144.jpg">
+<img style="width:100%; max-width:600px; margin-left:auto; margin-right:auto; display:block;" src="https://alioss.timecho.com/docs/img/github/69792176-1718f400-1201-11ea-861a-1a83c07ca144.jpg">
可以看到,`root`被定义为`LEVEL=0`。那么当你输入如下语句时:
diff --git a/docs/zh/UserGuide/Operators-Functions/Sample.md b/docs/zh/UserGuide/Operators-Functions/Sample.md
index ef9f809794..9c857d4834 100644
--- a/docs/zh/UserGuide/Operators-Functions/Sample.md
+++ b/docs/zh/UserGuide/Operators-Functions/Sample.md
@@ -267,7 +267,7 @@ M4用于在窗口内采样第一个点(`first`)、最后一个点(`last`
- 最小值点是拥有这个窗口内最小值的点(如果有多个这样的点,M4只返回其中一个);
- 最大值点是拥有这个窗口内最大值的点(如果有多个这样的点,M4只返回其中一个)。
-<img src="/img/github/198178733-a0919d17-0663-4672-9c4f-1efad6f463c2.png" alt="image" style="zoom:50%;" />
+<img src="https://alioss.timecho.com/docs/img/github/198178733-a0919d17-0663-4672-9c4f-1efad6f463c2.png" alt="image" style="zoom:50%;" />
| 函数名 | 可接收的输入序列类型 | 属性参数 | 输出序列类型 | 功能类型 |
| ------ | ------------------------------ | ------------------------------------------------------------ | ------------------------------ | ------------------------------------------------------------ |
@@ -280,7 +280,7 @@ M4用于在窗口内采样第一个点(`first`)、最后一个点(`last`
+ `windowSize`: 一个窗口内的点数。Int数据类型。必需的属性参数。
+ `slidingStep`: 按照设定的点数来滑动窗口。Int数据类型。可选的属性参数;如果没有设置,默认取值和`windowSize`一样。
-<img src="/img/github/198181449-00d563c8-7bce-4ecd-a031-ec120ca42c3f.png" alt="image" style="zoom: 50%;" />
+<img src="https://alioss.timecho.com/docs/img/github/198181449-00d563c8-7bce-4ecd-a031-ec120ca42c3f.png" alt="image" style="zoom: 50%;" />
*(图片来源: https://iotdb.apache.org/UserGuide/Master/Process-Data/UDF-User-Defined-Function.html#udtf-user-defined-timeseries-generating-function)*
@@ -291,7 +291,7 @@ M4用于在窗口内采样第一个点(`first`)、最后一个点(`last`
+ `displayWindowBegin`: 窗口滑动的起始时间戳位置(包含在内)。Long数据类型。可选的属性参数;如果没有设置,默认取值为Long.MIN_VALUE,意为使用输入的时间序列的第一个点的时间戳作为窗口滑动的起始时间戳位置。
+ `displayWindowEnd`: 结束时间限制(不包含在内;本质上和`WHERE time < displayWindowEnd`起的效果是一样的)。Long数据类型。可选的属性参数;如果没有设置,默认取值为Long.MAX_VALUE,意为除了输入的时间序列自身数据读取完毕之外没有增加额外的结束时间过滤条件限制。
-<img src="/img/github/198183015-93b56644-3330-4acf-ae9e-d718a02b5f4c.png" alt="groupBy window" style="zoom: 67%;" />
+<img src="https://alioss.timecho.com/docs/img/github/198183015-93b56644-3330-4acf-ae9e-d718a02b5f4c.png" alt="groupBy window" style="zoom: 67%;" />
*(图片来源: https://iotdb.apache.org/UserGuide/Master/Query-Data/Aggregate-Query.html#downsampling-aggregate-query)*
diff --git a/docs/zh/UserGuide/Operators-Functions/User-Defined-Function.md b/docs/zh/UserGuide/Operators-Functions/User-Defined-Function.md
index d237061d33..cb106ae09d 100644
--- a/docs/zh/UserGuide/Operators-Functions/User-Defined-Function.md
+++ b/docs/zh/UserGuide/Operators-Functions/User-Defined-Function.md
@@ -166,7 +166,7 @@ void beforeStart(UDFParameters parameters, UDTFConfigurations configurations) th
3 类参数的关系可见下图。策略的构造方法详见 Javadoc。
-<img style="width:100%; max-width:800px; max-height:600px; margin-left:auto; margin-right:auto; display:block;" src="/img/github/99787878-47b51480-2b5b-11eb-8ed3-84088c5c30f7.png">
+<img style="width:100%; max-width:800px; max-height:600px; margin-left:auto; margin-right:auto; display:block;" src="https://alioss.timecho.com/docs/img/github/99787878-47b51480-2b5b-11eb-8ed3-84088c5c30f7.png">
注意,最后的一些时间窗口的实际时间间隔可能小于规定的时间间隔参数。另外,可能存在某些时间窗口内数据行数量为 0 的情况,这种情况框架也会为该窗口调用一次`transform`方法。
diff --git a/docs/zh/UserGuide/Query-Data/Continuous-Query.md b/docs/zh/UserGuide/Query-Data/Continuous-Query.md
index 679b2c1971..b6f229a144 100644
--- a/docs/zh/UserGuide/Query-Data/Continuous-Query.md
+++ b/docs/zh/UserGuide/Query-Data/Continuous-Query.md
@@ -76,19 +76,19 @@ END
##### `<start_time_offset>`等于`<every_interval>`
-
+
##### `<start_time_offset>`大于`<every_interval>`
-
+
##### `<start_time_offset>`小于`<every_interval>`
-
+
##### `<every_interval>`不为0
-
+
- `TIMEOUT POLICY` 指定了我们如何处理“前一个时间窗口还未执行完时,下一个窗口的执行时间已经到达的场景,默认值是`BLOCKED`.
- `BLOCKED`意味着即使下一个窗口的执行时间已经到达,我们依旧需要阻塞等待前一个时间窗口的查询执行完再开始执行下一个窗口。如果使用`BLOCKED`策略,所有的时间窗口都将会被依此执行,但是如果遇到执行查询的时间长于周期性间隔时,连续查询的结果会迟于最新的时间窗口范围。
diff --git a/docs/zh/UserGuide/Query-Data/Group-By.md b/docs/zh/UserGuide/Query-Data/Group-By.md
index 8f8ba23af0..c9374e172c 100644
--- a/docs/zh/UserGuide/Query-Data/Group-By.md
+++ b/docs/zh/UserGuide/Query-Data/Group-By.md
@@ -33,7 +33,7 @@
下图中指出了这三个参数的含义:
-<img style="width:100%; max-width:800px; max-height:600px; margin-left:auto; margin-right:auto; display:block;" src="/img/github/69109512-f808bc80-0ab2-11ea-9e4d-b2b2f58fb474.png">
+<img style="width:100%; max-width:800px; max-height:600px; margin-left:auto; margin-right:auto; display:block;" src="https://alioss.timecho.com/docs/img/github/69109512-f808bc80-0ab2-11ea-9e4d-b2b2f58fb474.png">
接下来,我们给出几个典型例子:
@@ -599,7 +599,7 @@ group by variation(controlExpression[,delta][,ignoreNull=true/false])
下图为差值分段的一个分段方式示意图,与组中第一个数据的控制列值的差值在delta内的控制列对应的点属于相同的分组。
-<img style="width:100%; max-width:800px; max-height:600px; margin-left:auto; margin-right:auto; display:block;" src="/img/UserGuide/Process-Data/GroupBy/groupByVariation.jpeg" alt="groupByVariation">
+<img style="width:100%; max-width:800px; max-height:600px; margin-left:auto; margin-right:auto; display:block;" src="https://alioss.timecho.com/docs/img/UserGuide/Process-Data/GroupBy/groupByVariation.jpeg" alt="groupByVariation">
#### 使用注意事项
1. `controlExpression`的结果应该为唯一值,如果使用通配符拼接后出现多列,则报错。
@@ -772,7 +772,7 @@ group by session(timeInterval)
下图为`group by session`下的一个分组示意图
-<img style="width:100%; max-width:800px; max-height:600px; margin-left:auto; margin-right:auto; display:block;" src="/img/UserGuide/Process-Data/GroupBy/groupBySession.jpeg">
+<img style="width:100%; max-width:800px; max-height:600px; margin-left:auto; margin-right:auto; display:block;" src="https://alioss.timecho.com/docs/img/UserGuide/Process-Data/GroupBy/groupBySession.jpeg">
#### 使用注意事项
1. 对于一个分组,默认Time列输出分组的开始时间,查询时可以使用select `__endTime`的方式来使得结果输出分组的结束时间。
diff --git a/docs/zh/UserGuide/QuickStart/Command-Line-Interface.md b/docs/zh/UserGuide/QuickStart/Command-Line-Interface.md
index d5c1dfb80a..3b4ed092b9 100644
--- a/docs/zh/UserGuide/QuickStart/Command-Line-Interface.md
+++ b/docs/zh/UserGuide/QuickStart/Command-Line-Interface.md
@@ -132,49 +132,49 @@ Shell > bash ./standalone.sh
```
2、使用 https://ip:port/auth 登陆 keycloack, 首次登陆需要创建用户
-
+
3、点击 Administration Console 进入管理端
-
+
4、在左侧的 Master 菜单点击 add Realm, 输入 Name 创建一个新的 Realm
-
+
-
+
5、点击左侧菜单 Clients,创建 client
-
+
6、点击左侧菜单 User,创建 user
-
+
7、点击新创建的用户 id,点击 Credentials 导航输入密码和关闭 Temporary 选项,至此 keyclork 配置完成
-
+
8、创建角色,点击左侧菜单的 Roles然后点击Add Role 按钮添加角色
-
+
9、在Role Name 中输入`iotdb_admin`,点击save 按钮。提示:这里的`iotdb_admin`不能为其他名称否则即使登陆成功后也将无权限使用iotdb的查询、插入、创建 database、添加用户、角色等功能
-
+
10、点击左侧的User 菜单然后点击用户列表中的Edit的按钮为该用户添加我们刚创建的`iotdb_admin`角色
-
+
11、选择Role Mappings ,在Available Role选择`iotdb_admin`角色然后点Add selected 按钮添加角色
-
+
12、如果`iotdb_admin`角色在Assigned Roles中并且出现`Success Role mappings updated`提示,证明角色添加成功
-
+
提示:如果用户角色有调整需要重新生成token并且重新登陆iotdb才会生效
diff --git a/docs/zh/UserGuide/Reference/TSDB-Comparison.md b/docs/zh/UserGuide/Reference/TSDB-Comparison.md
index 3fc793eb8d..5e00f401b7 100644
--- a/docs/zh/UserGuide/Reference/TSDB-Comparison.md
+++ b/docs/zh/UserGuide/Reference/TSDB-Comparison.md
@@ -23,7 +23,7 @@
### Overview
-
+
**表格外观启发自 [Andriy Zabavskyy: How to Select Time Series DB](https://towardsdatascience.com/how-to-select-time-series-db-123b0eb4ab82)*
@@ -282,7 +282,7 @@ IoTDB 拥有许多其它时间序列数据库不支持的强大功能。
写入吞吐率(points/second)如下图所示:
-<img src="/img/github/106254214-6cacbe80-6253-11eb-8532-d6a1829f8f66.png" alt="Batch Size with Write Throughput (points/second)" />
+<img src="https://alioss.timecho.com/docs/img/github/106254214-6cacbe80-6253-11eb-8532-d6a1829f8f66.png" alt="Batch Size with Write Throughput (points/second)" />
<center>Figure 1. Batch Size with Write throughput (points/second) IoTDB v0.11.1</center>
@@ -292,7 +292,7 @@ client num 从 1 到 50 变化。IoTDB 使用 batch insertion API,batch size
写入吞吐率(points/second)如下图所示:
-
+
<center>Figure 3. Client Num with Write Throughput (points/second) IoTDB v0.11.1</center>
@@ -306,19 +306,19 @@ client num 从 1 到 50 变化。IoTDB 使用 batch insertion API,batch size
测试结果如下图所示:
-
+
<center>Figure 4. Raw data query 1 col time cost(ms) IoTDB v0.11.1</center>
-
+
<center>Figure 5. Aggregation query time cost(ms) IoTDB v0.11.1</center>
-
+
<center>Figure 6. Downsampling query time cost(ms) IoTDB v0.11.1</center>
-
+
<center>Figure 7. Latest query time cost(ms) IoTDB v0.11.1</center>
diff --git a/docs/zh/UserGuide/Trigger/Implement-Trigger.md b/docs/zh/UserGuide/Trigger/Implement-Trigger.md
index 0979a644ce..8d7153bdf8 100644
--- a/docs/zh/UserGuide/Trigger/Implement-Trigger.md
+++ b/docs/zh/UserGuide/Trigger/Implement-Trigger.md
@@ -183,9 +183,9 @@ insert into root.sg(time, a, b) values (1, 1, 1);
您可以参考下图辅助理解,其中 Trigger1 配置采用乐观策略,Trigger2 配置采用悲观策略。Trigger1 和 Trigger2 的触发时机是 BEFORE INSERT,Trigger3 和 Trigger4 的触发时机是 AFTER INSERT。 正常执行流程如下:
-<img src="/img/UserGuide/Process-Data/Triggers/Trigger_Process_Flow.jpg?raw=true">
+<img src="https://alioss.timecho.com/docs/img/UserGuide/Process-Data/Triggers/Trigger_Process_Flow.jpg?raw=true">
-<img src="/img/UserGuide/Process-Data/Triggers/Trigger_Process_Strategy.jpg?raw=true">
+<img src="https://alioss.timecho.com/docs/img/UserGuide/Process-Data/Triggers/Trigger_Process_Strategy.jpg?raw=true">
### 示例