You are viewing a plain text version of this content. The canonical link for it is here.
Posted to notifications@skywalking.apache.org by wu...@apache.org on 2021/08/27 07:06:33 UTC
[skywalking] branch master updated: refine backend doc (#7587)
This is an automated email from the ASF dual-hosted git repository.
wusheng pushed a commit to branch master
in repository https://gitbox.apache.org/repos/asf/skywalking.git
The following commit(s) were added to refs/heads/master by this push:
new 1c436d7 refine backend doc (#7587)
1c436d7 is described below
commit 1c436d785111bf2c8a32b0c093619e3907ce58fc
Author: Wing <69...@users.noreply.github.com>
AuthorDate: Fri Aug 27 00:06:21 2021 -0700
refine backend doc (#7587)
---
docs/en/setup/backend/service-auto-grouping.md | 13 ++++-----
docs/en/setup/backend/slow-db-statement.md | 15 +++++-----
docs/en/setup/backend/spring-sleuth-setup.md | 27 +++++++++---------
docs/en/setup/backend/trace-sampling.md | 38 ++++++++++++--------------
4 files changed, 43 insertions(+), 50 deletions(-)
diff --git a/docs/en/setup/backend/service-auto-grouping.md b/docs/en/setup/backend/service-auto-grouping.md
index 9530dc1..1c3cb6c 100644
--- a/docs/en/setup/backend/service-auto-grouping.md
+++ b/docs/en/setup/backend/service-auto-grouping.md
@@ -1,16 +1,15 @@
# Service Auto Grouping
SkyWalking supports various default and customized dashboard templates.
-Each template provides the reasonable layout for the services in the particular field.
-Such as, services with a language agent installed
-could have different metrics with service detected by the service mesh observability solution,
-and different with SkyWalking's self-observability metrics dashboard.
+Each template provides an appropriate layout for services in a particular field.
+For example, the metrics for services with language agents installed
+may be different from that of services detected by the service mesh observability solution as well as SkyWalking's self-observability metrics dashboard.
-Therefore, since 8.3.0, SkyWalking OAP would generate the group based on this simple naming format.
+Therefore, since version 8.3.0, the SkyWalking OAP has generated the groups based on this simple naming format:
### ${service name} = [${group name}::]${logic name}
-Once the service name includes double colons(`::`), the literal string before the colons would be considered as the group name.
+If the service name includes double colons (`::`), the literal string before the colons is taken as the group name.
In the latest GraphQL query, the group name has been provided as an option parameter.
> getAllServices(duration: Duration!, group: String): [Service!]!
-RocketBot UI dashboards(`Standard` type) support the `group name` for default and custom configurations.
\ No newline at end of file
+RocketBot UI dashboards (`Standard` type) support the `group name` for default and custom configurations.
diff --git a/docs/en/setup/backend/slow-db-statement.md b/docs/en/setup/backend/slow-db-statement.md
index c8bb54e..0e7c96b 100644
--- a/docs/en/setup/backend/slow-db-statement.md
+++ b/docs/en/setup/backend/slow-db-statement.md
@@ -1,14 +1,13 @@
# Slow Database Statement
-Slow Database statements are significant important to find out the bottleneck of the system, which relied on Database.
+Slow Database statements are crucial in order for you to identify bottlenecks of a system which relies on the database.
-Slow DB statements are based on sampling, right now, the core samples top 50 slowest in every 10 minutes.
-But duration of those statements must be slower than threshold.
+Slow DB statements are based on sampling. Right now, the core samples the top 50 slowest every 10 minutes.
+Note that the duration of these statements must be slower than the threshold.
-The setting format is following, unit is millisecond.
+Here's the format of the settings (in milliseconds):
> database-type:thresholdValue,database-type2:thresholdValue2
-Default setting is `default:200,mongodb:100`. `Reserved DB type` is **default**, which be as default threshold for all
-database types, except set explicitly.
+The default settings are `default:200,mongodb:100`. `Reserved DB type` is **default**, which is the default threshold for all
+database types, unless set explicitly.
-**Notice**, the threshold should not be too small, like `1ms`. Functionally, it works, but would cost OAP performance issue,
-if your system statement access time are mostly more than 1ms.
\ No newline at end of file
+**Note**: The threshold should not be set too small, like `1ms`. Although it works in theory, OAP performance issues may arise if your system statement access time is usually more than 1ms.
diff --git a/docs/en/setup/backend/spring-sleuth-setup.md b/docs/en/setup/backend/spring-sleuth-setup.md
index cc2581d..aa03794 100644
--- a/docs/en/setup/backend/spring-sleuth-setup.md
+++ b/docs/en/setup/backend/spring-sleuth-setup.md
@@ -1,10 +1,9 @@
# Spring sleuth setup
-Spring Sleuth provides Spring Boot auto-configuration for distributed tracing. Skywalking integrates it's micrometer part,
-and it can send metrics to the Skywalking [Meter System](./../../concepts-and-designs/meter.md).
+Spring Sleuth provides Spring Boot auto-configuration for distributed tracing. Skywalking integrates its micrometer so that it can send metrics to the Skywalking [Meter System](./../../concepts-and-designs/meter.md).
## Set up agent
-1. Add the Micrometer and Skywalking meter registry dependency into project `pom.xml` file. Also you could found more detail at [Toolkit micrometer](./../service-agent/java-agent/Application-toolkit-micrometer.md).
+1. Add micrometer and Skywalking meter registry dependency into the project's `pom.xml` file. You can find more details at [Toolkit micrometer](./../service-agent/java-agent/Application-toolkit-micrometer.md).
```xml
<dependency>
<groupId>org.springframework.boot</groupId>
@@ -17,7 +16,7 @@ and it can send metrics to the Skywalking [Meter System](./../../concepts-and-de
</dependency>
```
-2. Create the Skywalking meter resgitry into spring bean management.
+2. Create Skywalking meter registry in spring bean management.
```java
@Bean
SkywalkingMeterRegistry skywalkingMeterRegistry() {
@@ -29,17 +28,17 @@ SkywalkingMeterRegistry skywalkingMeterRegistry() {
## Set up backend receiver
-1. Make sure enable meter receiver in the `applicaiton.yml`.
+1. Make sure to enable meter receiver in `application.yml`.
```yaml
receiver-meter:
selector: ${SW_RECEIVER_METER:default}
default:
```
-2. Configure the meter config file, It already has the [spring sleuth meter config](../../../../oap-server/server-bootstrap/src/main/resources/meter-analyzer-config/spring-sleuth.yaml).
-If you also has some customized meter at the agent side, please read [meter document](backend-meter.md#meters-configure) to configure meter.
+2. Configure the meter config file. It already has the [spring sleuth meter config](../../../../oap-server/server-bootstrap/src/main/resources/meter-analyzer-config/spring-sleuth.yaml).
+If you have a customized meter at the agent side, please configure the meter using the steps set out in the [meter document](backend-meter.md#meters-configure).
-3. Enable Spring sleuth config in the `applicaiton.yml`.
+3. Enable Spring sleuth config in `application.yml`.
```yaml
agent-analyzer:
selector: ${SW_AGENT_ANALYZER:default}
@@ -49,7 +48,7 @@ agent-analyzer:
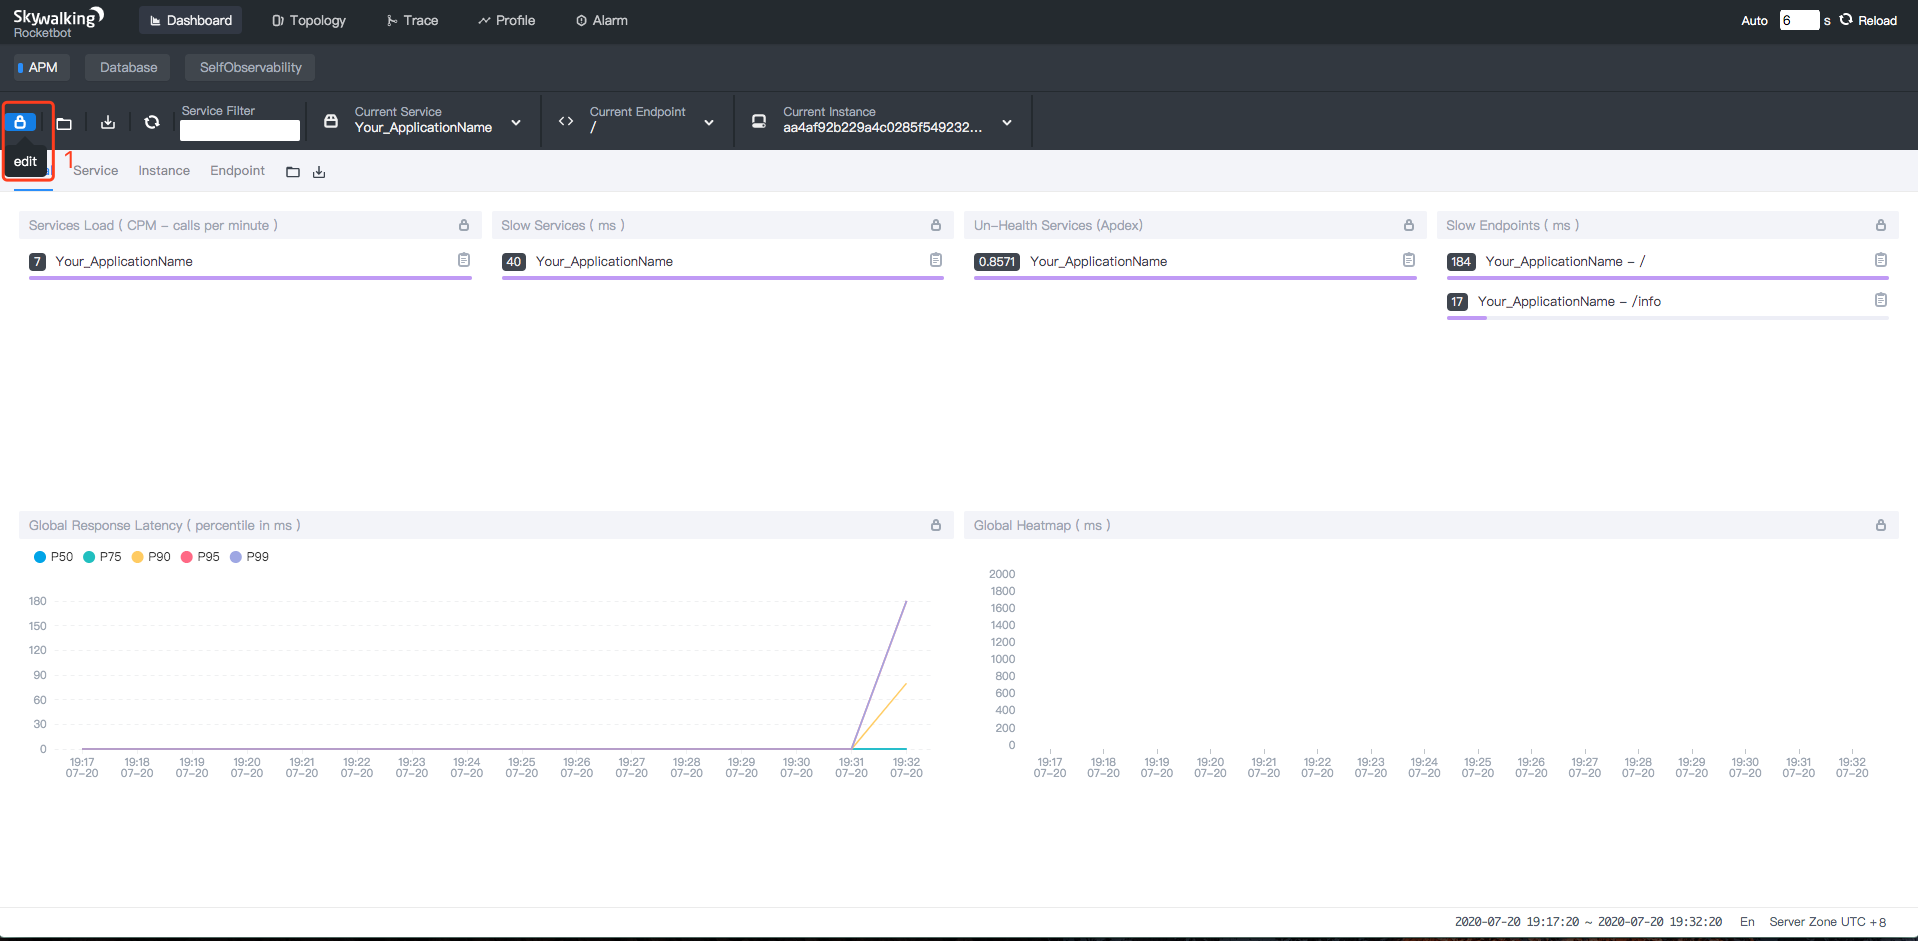
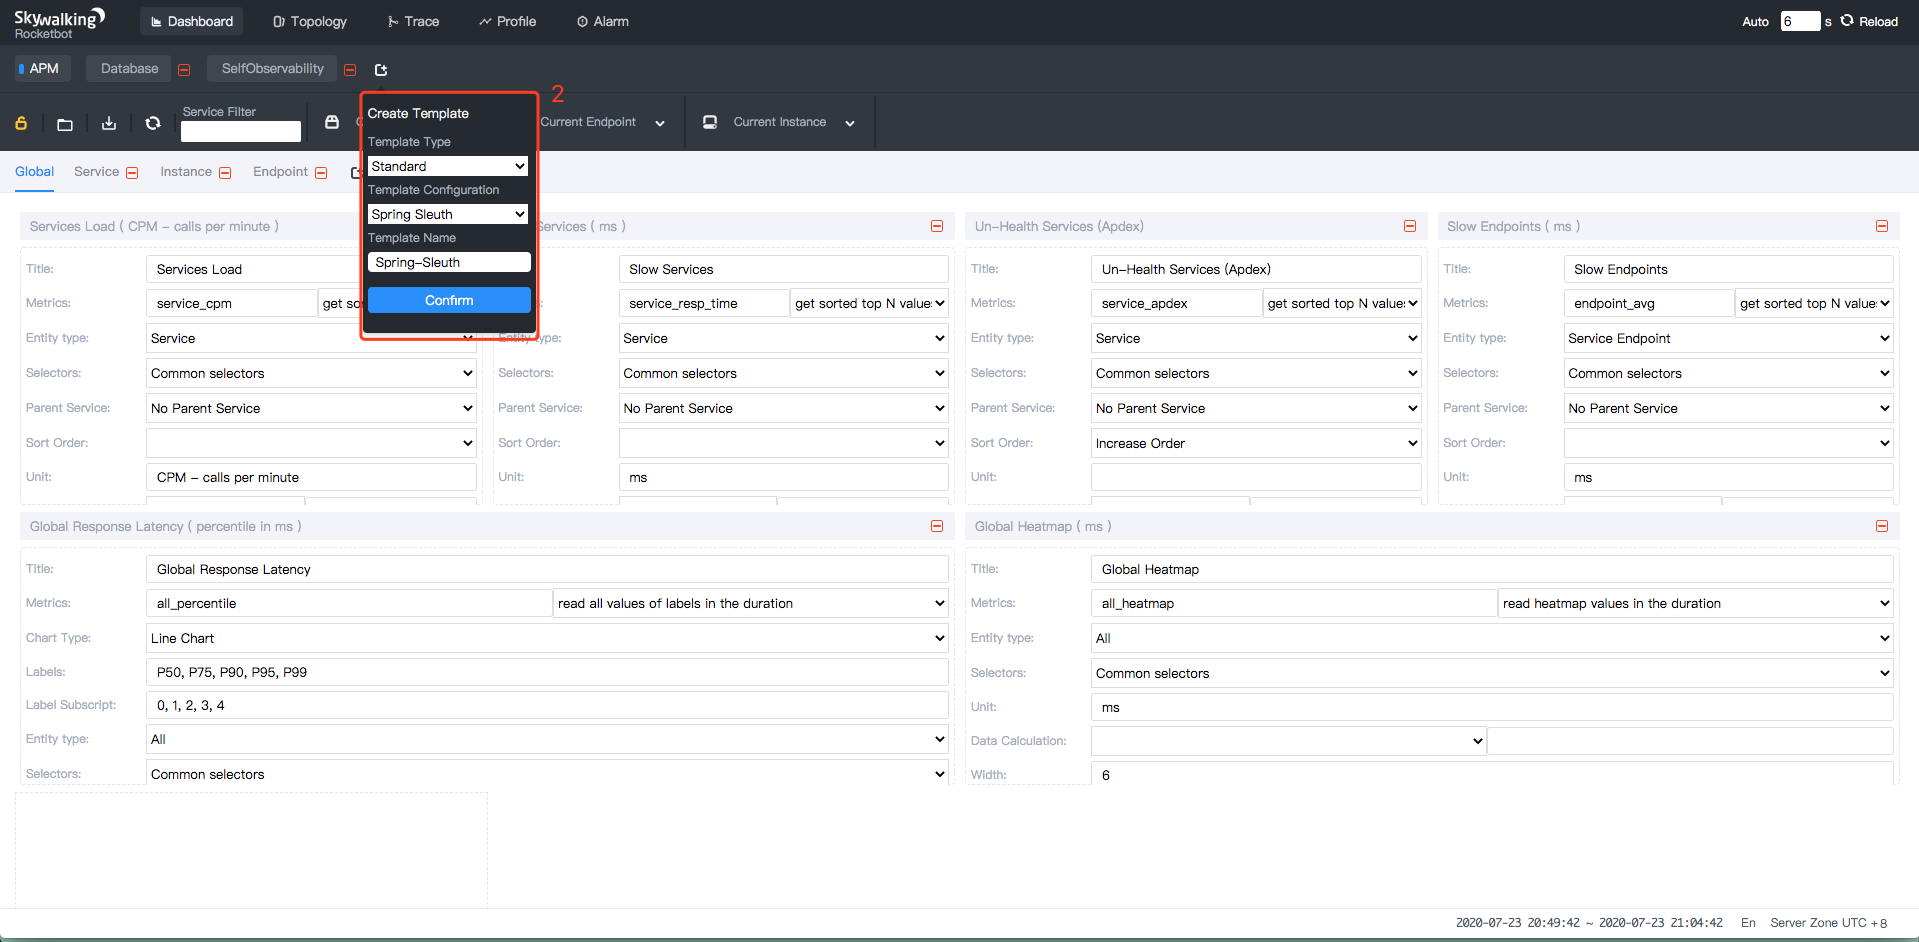
## Add UI dashboard
-1. Open the dashboard view, click `edit` button to edit the templates.
+1. Open the dashboard view. Click `edit` button to edit the templates.
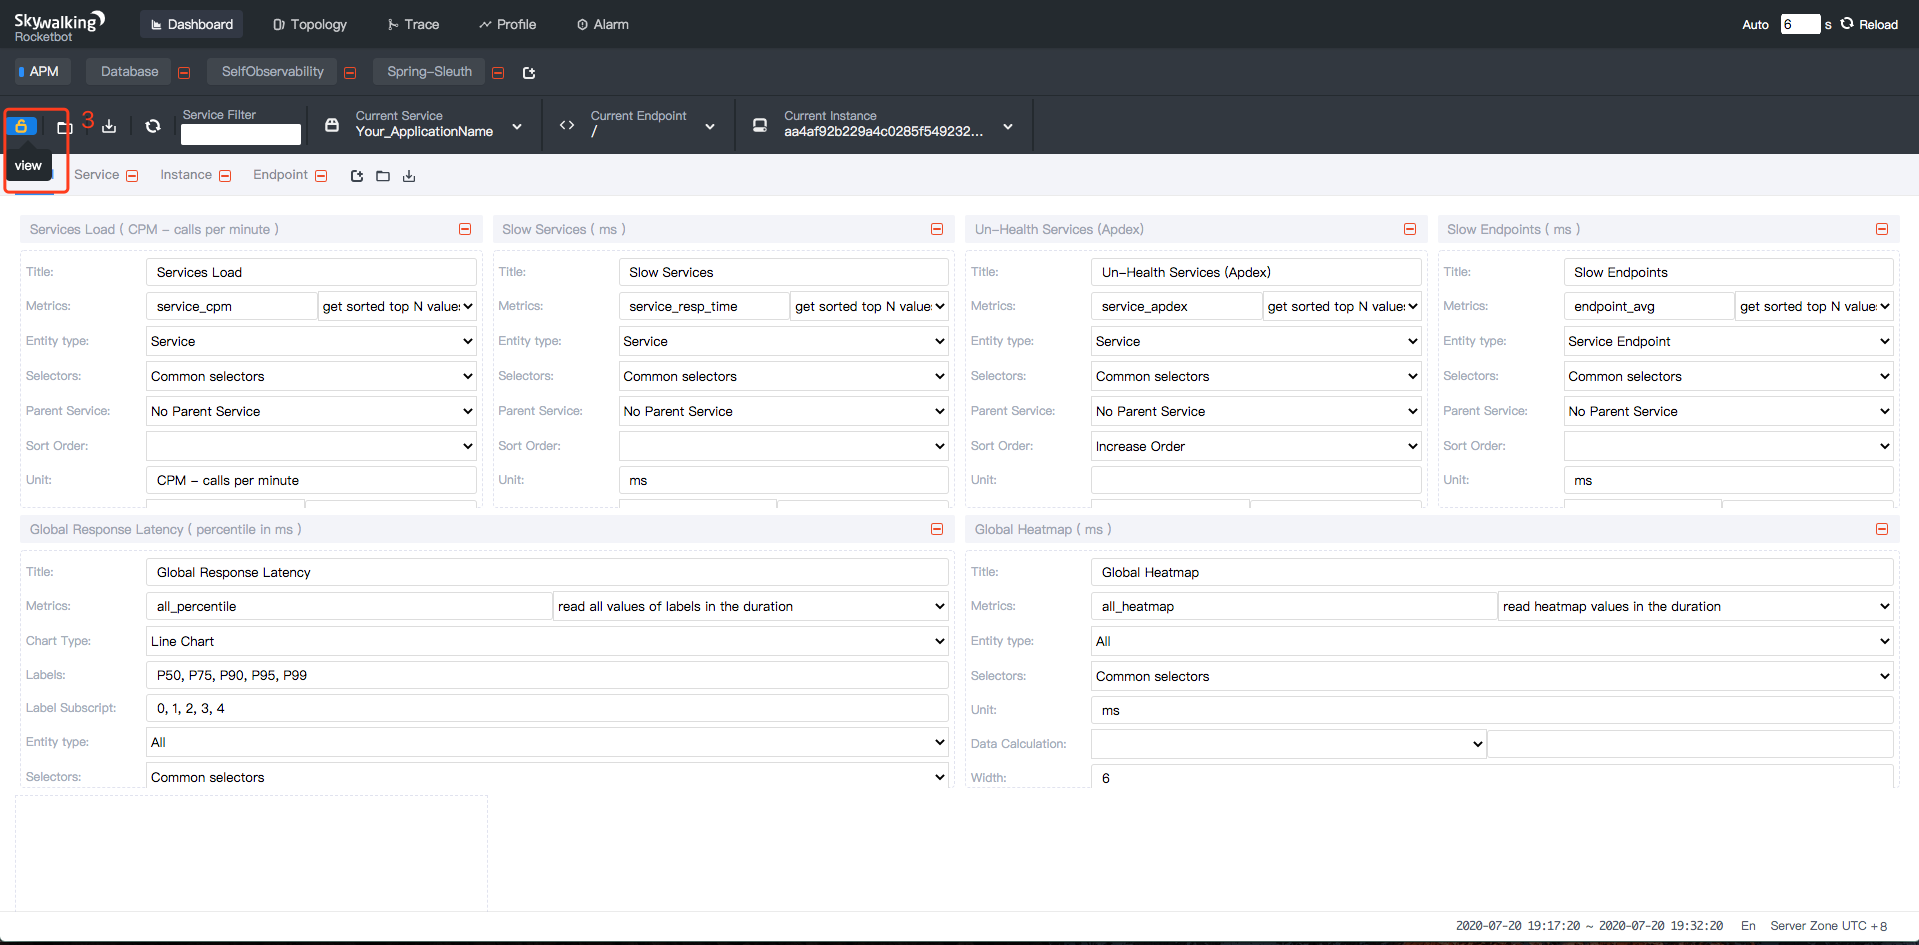
@@ -57,15 +56,15 @@ agent-analyzer:
-1. Click `view` button, Finally get the spring sleuth dashboard.
+1. Click `view` button. You'll see the spring sleuth dashboard.
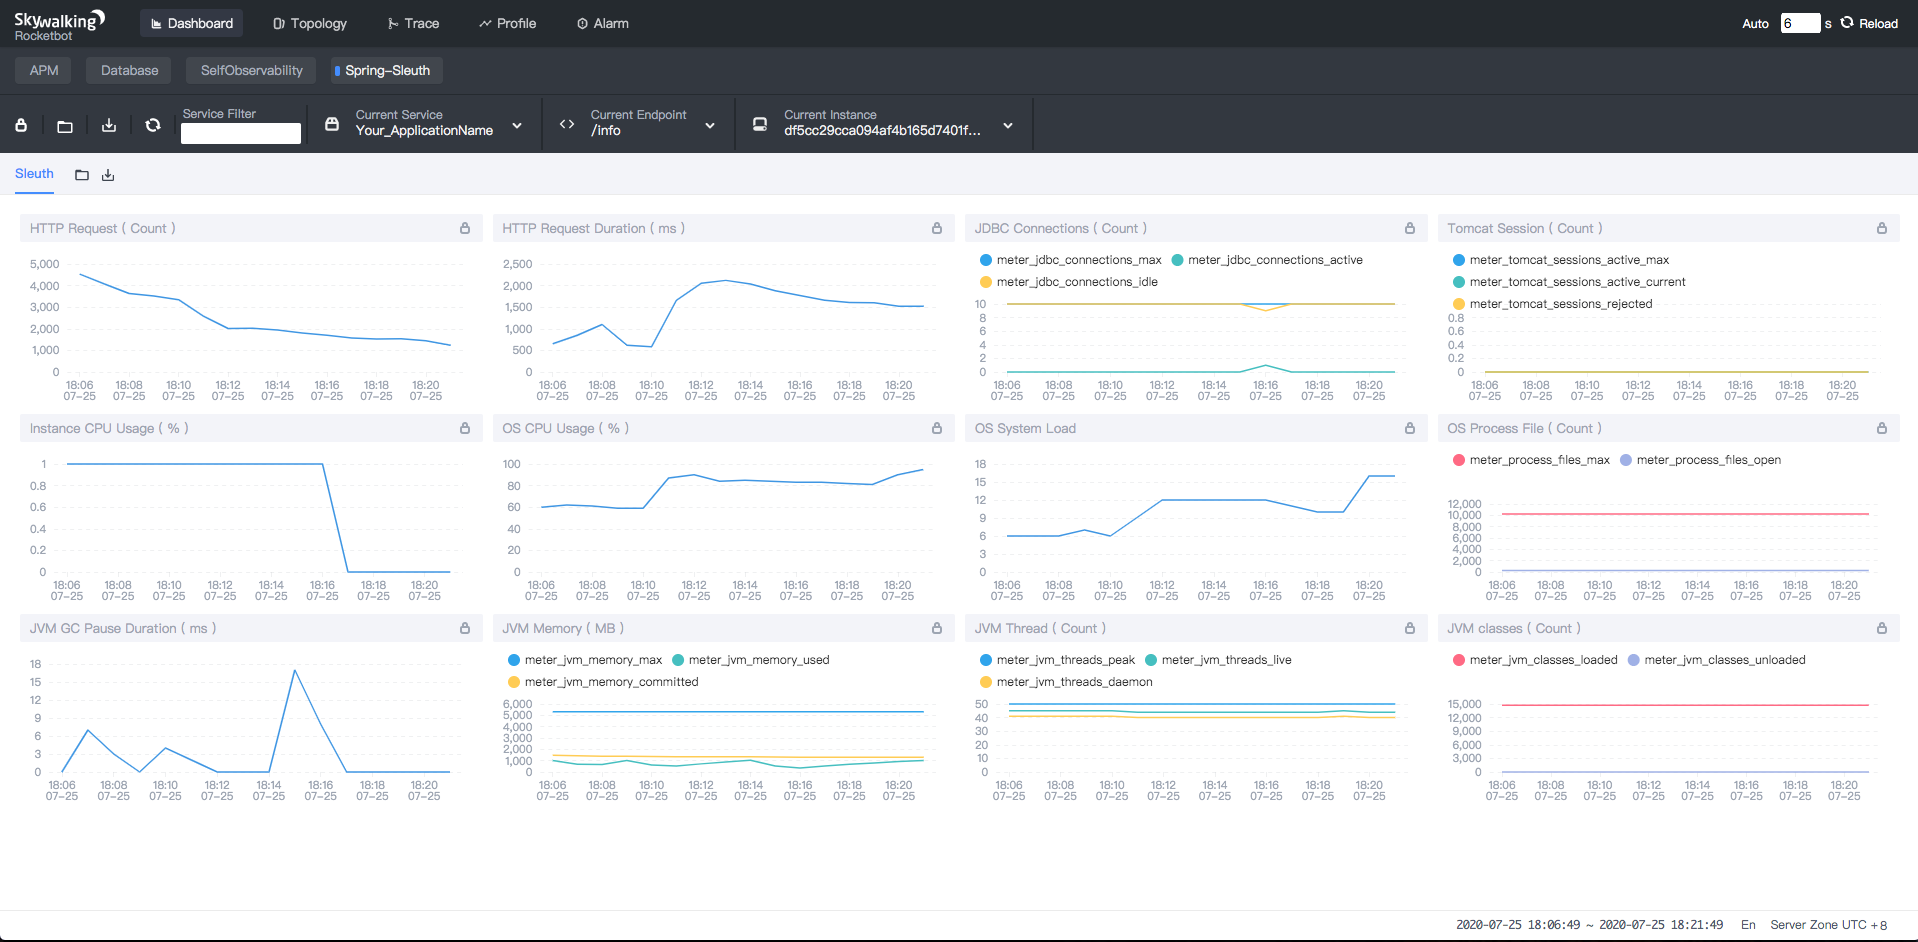
## Supported meter
-Supported 3 types information: Application, System, JVM.
+Three types of information are supported: Application, System, and JVM.
-1. Application: HTTP request count and duration, JDBC max/idle/active connection count, Tomcat session active/reject count.
-1. System: CPU system/process usage, OS System load, OS Process file count.
-1. JVM: GC pause count and duration, Memory max/used/committed size, Thread peak/live/daemon count, Classes loaded/unloaded count.
\ No newline at end of file
+1. Application: HTTP request count and duration, JDBC max/idle/active connection count, and Tomcat session active/reject count.
+1. System: CPU system/process usage, OS system load, and OS process file count.
+1. JVM: GC pause count and duration, memory max/used/committed size, thread peak/live/daemon count, and classes loaded/unloaded count.
diff --git a/docs/en/setup/backend/trace-sampling.md b/docs/en/setup/backend/trace-sampling.md
index 4c343e4..965e10d 100644
--- a/docs/en/setup/backend/trace-sampling.md
+++ b/docs/en/setup/backend/trace-sampling.md
@@ -1,14 +1,13 @@
# Trace Sampling at server side
-When we run a distributed tracing system, the trace bring us detailed info, but cost a lot at storage.
-Open server side trace sampling mechanism, the metrics of service, service instance, endpoint and topology are all accurate
-as before, but only don't save all the traces into storage.
+An advantage of a distributed tracing system is that detailed information from the traces can be obtained. However, the downside is that these traces use up a lot of storage.
+If you enable the trace sampling mechanism at the server side, you will find that the metrics of the service, service instance, endpoint, and topology all have the same accuracy as before. The only difference is that they do not save all traces into storage.
-Of course, even you open sampling, the traces will be kept as consistent as possible. **Consistent** means, once the trace
-segments have been collected and reported by agents, the backend would do their best to don't break the trace. See [Recommendation](#recommendation)
-to understand why we called it `as consistent as possible` and `do their best to don't break the trace`.
+Of course, even if you enable sampling, the traces will be kept as consistent as possible. Being **consistent** means that once the trace
+segments have been collected and reported by agents, the backend would do their best not to split the traces. See our [recommendation](#recommendation)
+to understand why you should keep the traces as consistent as possible and try not to split them.
## Set the sample rate
-In **agent-analyzer** module, you will find `sampleRate` setting.
+In the **agent-analyzer** module, you will find the `sampleRate` setting.
```yaml
agent-analyzer:
@@ -19,28 +18,25 @@ agent-analyzer:
slowTraceSegmentThreshold: ${SW_SLOW_TRACE_SEGMENT_THRESHOLD:-1} # Setting this threshold about the latency would make the slow trace segments sampled if they cost more time, even the sampling mechanism activated. The default value is `-1`, which means would not sample slow traces. Unit, millisecond.
```
-`sampleRate` is for you to set sample rate to this backend.
-The sample rate precision is 1/10000. 10000 means 100% sample in default.
+`sampleRate` allows you to set the sample rate to this backend.
+The sample rate precision is 1/10000. 10000 means 100% sample by default.
-`forceSampleErrorSegment` is for you to save all error segments when sampling mechanism actived.
-When sampling mechanism activated, this config would make the error status segment sampled, ignoring the sampling rate.
+`forceSampleErrorSegment` allows you to save all error segments when sampling mechanism is activated.
+When sampling mechanism is activated, this config would cause the error status segment to be sampled, ignoring the sampling rate.
-`slowTraceSegmentThreshold` is for you to save all slow trace segments when sampling mechanism actived.
-Setting this threshold about the latency would make the slow trace segments sampled if they cost more time, even the sampling mechanism activated. The default value is `-1`, which means would not sample slow traces. Unit, millisecond.
+`slowTraceSegmentThreshold` allows you to save all slow trace segments when sampling mechanism is activated.
+Setting this threshold on latency (in milliseconds) would cause slow trace segments to be sampled if they use up more time, even if the sampling mechanism is activated. The default value is `-1`, which means that slow traces would not be sampled.
# Recommendation
-You could set different backend instances with different `sampleRate` values, but we recommend you to set the same.
+You may choose to set different backend instances with different `sampleRate` values, although we recommend that you set the values to be the same.
-When you set the rate different, let's say
+When you set the different rates, let's say:
* Backend-Instance**A**.sampleRate = 35
* Backend-Instance**B**.sampleRate = 55
-And we assume the agents reported all trace segments to backend,
-Then the 35% traces in the global will be collected and saved in storage consistent/complete, with all spans.
-20% trace segments, which reported to Backend-Instance**B**, will saved in storage, maybe miss some trace segments,
-because they are reported to Backend-Instance**A** and ignored.
+Assume the agents have reported all trace segments to the backend. 35% of the traces at the global level will be collected and saved in storage consistently/completely together with all spans. 20% of the trace segments which are reported to Backend-Instance **B** will be saved in storage, whereas some trace segments may be missed, as they are reported to Backend-Instance**A** and ignored.
# Note
-When you open sampling, the actual sample rate could be over sampleRate. Because currently, all error/slow segments will be saved, meanwhile, the upstream and downstream may not be sampled. This feature is going to make sure you could have the error/slow stacks and segments, but don't guarantee you would have the whole trace.
+When you enable sampling, the actual sample rate may exceed sampleRate. The reason is that currently all error/slow segments will be saved; meanwhile, the upstream and downstream may not be sampled. This feature ensures that you have the error/slow stacks and segments, although it is not guaranteed that you would have the whole traces.
-Also, the side effect would be, if most of the accesses are fail/slow, the sampling rate would be closing to 100%, which could crash the backend or storage clusters.
+Note also if most of the access have failed or are slow, the sampling rate would be close to 100%. This may cause the backend or storage clusters to crash.