You are viewing a plain text version of this content. The canonical link for it is here.
Posted to commits@echarts.apache.org by GitBox <gi...@apache.org> on 2022/06/01 09:56:31 UTC
[GitHub] [echarts] Ovilia opened a new pull request, #17143: fix(dataZoom): detail shape is not the same as data with value axis
Ovilia opened a new pull request, #17143:
URL: https://github.com/apache/echarts/pull/17143
<!-- Please fill in the following information to help us review your PR more efficiently. -->
## Brief Information
This pull request is in the type of:
- [x] bug fixing
- [ ] new feature
- [ ] others
### What does this PR do?
<!-- USE ONE SENTENCE TO DESCRIBE WHAT THIS PR DOES. -->
The detail view in the dataZoom was not the same as the data in range. See the issue below.
### Fixed issues
- #17141
## Details
### Before: What was the problem?
<!-- DESCRIBE THE BUG OR REQUIREMENT HERE. -->
<!-- ADD SCREENSHOT HERE IF APPLICABLE. -->
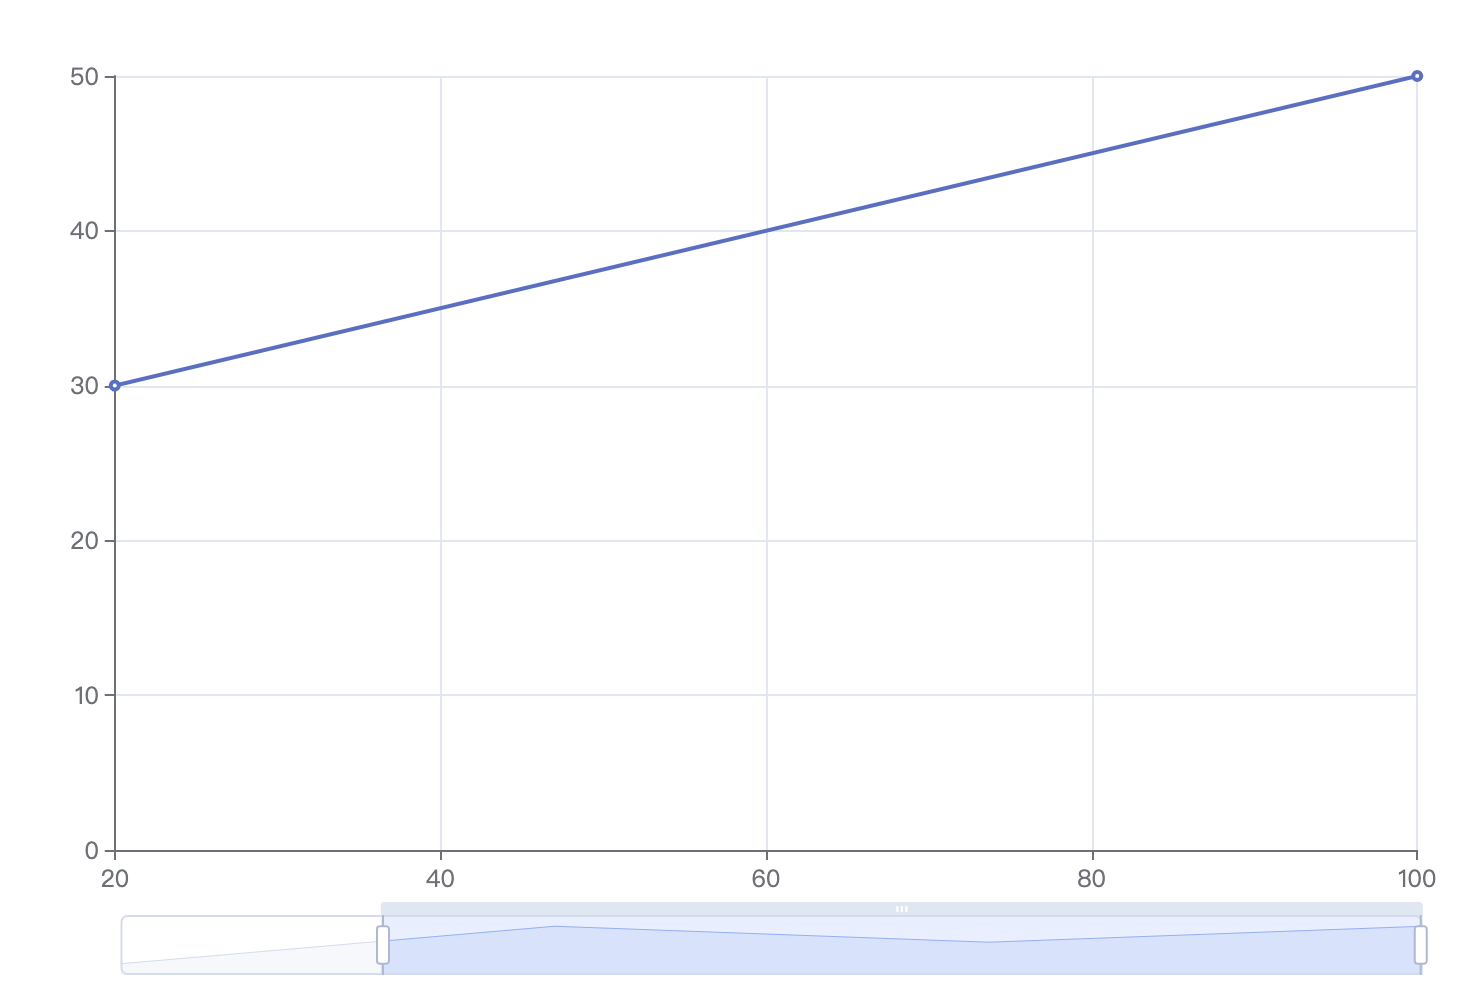
The detail view is not the same as the grid area if the axis is a value type.
### After: How is it fixed in this PR?
<!-- THE RESULT AFTER FIXING AND A SIMPLE EXPLANATION ABOUT HOW IT IS FIXED. -->
<!-- ADD SCREENSHOT HERE IF APPLICABLE. -->
The detail view should be the same as the grid area.
## Misc
<!-- ADD RELATED ISSUE ID WHEN APPLICABLE -->
- [ ] The API has been changed (apache/echarts-doc#xxx).
- [ ] This PR depends on ZRender changes (ecomfe/zrender#xxx).
### Related test cases or examples to use the new APIs
N.A.
## Others
### Merging options
- [ ] Please squash the commits into a single one when merging.
### Other information
--
This is an automated message from the Apache Git Service.
To respond to the message, please log on to GitHub and use the
URL above to go to the specific comment.
To unsubscribe, e-mail: commits-unsubscribe@echarts.apache.org
For queries about this service, please contact Infrastructure at:
users@infra.apache.org
---------------------------------------------------------------------
To unsubscribe, e-mail: commits-unsubscribe@echarts.apache.org
For additional commands, e-mail: commits-help@echarts.apache.org
[GitHub] [echarts] alienzhangyw commented on pull request #17143: fix(dataZoom): detail shape is not the same as data with value axis
Posted by "alienzhangyw (via GitHub)" <gi...@apache.org>.
alienzhangyw commented on PR #17143:
URL: https://github.com/apache/echarts/pull/17143#issuecomment-1449634036
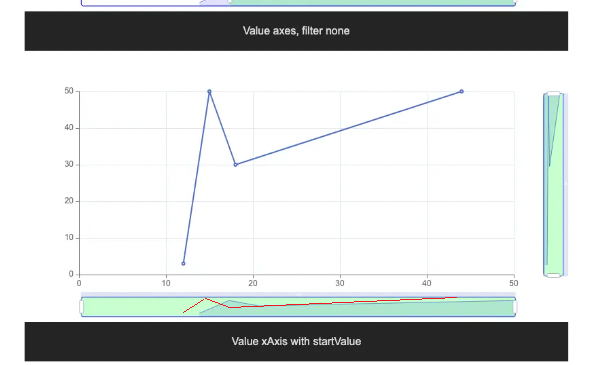
@Ovilia Your fix is still not as perfect as expected (red lines)
--
This is an automated message from the Apache Git Service.
To respond to the message, please log on to GitHub and use the
URL above to go to the specific comment.
To unsubscribe, e-mail: commits-unsubscribe@echarts.apache.org
For queries about this service, please contact Infrastructure at:
users@infra.apache.org
---------------------------------------------------------------------
To unsubscribe, e-mail: commits-unsubscribe@echarts.apache.org
For additional commands, e-mail: commits-help@echarts.apache.org
[GitHub] [echarts] ianschmitz commented on pull request #17143: fix(dataZoom): detail shape is not the same as data with value axis
Posted by GitBox <gi...@apache.org>.
ianschmitz commented on PR #17143:
URL: https://github.com/apache/echarts/pull/17143#issuecomment-1352054064

   @Ovilia does this also address stacked bar charts being rendered as a data shadow?


--
This is an automated message from the Apache Git Service.
To respond to the message, please log on to GitHub and use the
URL above to go to the specific comment.

To unsubscribe, e-mail: commits-unsubscribe@echarts.apache.org

For queries about this service, please contact Infrastructure at:
users@infra.apache.org


---------------------------------------------------------------------
To unsubscribe, e-mail: commits-unsubscribe@echarts.apache.org
For additional commands, e-mail: commits-help@echarts.apache.org
[GitHub] [echarts] martingrumbt commented on pull request #17143: fix(dataZoom): detail shape is not the same as data with value axis
Posted by "martingrumbt (via GitHub)" <gi...@apache.org>.
martingrumbt commented on PR #17143:
URL: https://github.com/apache/echarts/pull/17143#issuecomment-1710742905

   @Ovilia How can I support you to solve this issue?


--
This is an automated message from the Apache Git Service.
To respond to the message, please log on to GitHub and use the
URL above to go to the specific comment.

To unsubscribe, e-mail: commits-unsubscribe@echarts.apache.org

For queries about this service, please contact Infrastructure at:
users@infra.apache.org


---------------------------------------------------------------------
To unsubscribe, e-mail: commits-unsubscribe@echarts.apache.org
For additional commands, e-mail: commits-help@echarts.apache.org
Re: [PR] fix(dataZoom): detail shape is not the same as data with value axis [echarts]
Posted by "simonwunderlich (via GitHub)" <gi...@apache.org>.
simonwunderlich commented on PR #17143:
URL: https://github.com/apache/echarts/pull/17143#issuecomment-1792012619

   Would be great to have this integrated!


--
This is an automated message from the Apache Git Service.
To respond to the message, please log on to GitHub and use the
URL above to go to the specific comment.

To unsubscribe, e-mail: commits-unsubscribe@echarts.apache.org

For queries about this service, please contact Infrastructure at:
users@infra.apache.org


---------------------------------------------------------------------
To unsubscribe, e-mail: commits-unsubscribe@echarts.apache.org
For additional commands, e-mail: commits-help@echarts.apache.org
[GitHub] [echarts] Ovilia commented on pull request #17143: fix(dataZoom): detail shape is not the same as data with value axis
Posted by GitBox <gi...@apache.org>.
Ovilia commented on PR #17143:
URL: https://github.com/apache/echarts/pull/17143#issuecomment-1143389505

   TODO: visual testing the dataZoom related changes.


--
This is an automated message from the Apache Git Service.
To respond to the message, please log on to GitHub and use the
URL above to go to the specific comment.

To unsubscribe, e-mail: commits-unsubscribe@echarts.apache.org

For queries about this service, please contact Infrastructure at:
users@infra.apache.org


---------------------------------------------------------------------
To unsubscribe, e-mail: commits-unsubscribe@echarts.apache.org
For additional commands, e-mail: commits-help@echarts.apache.org
[GitHub] [echarts] echarts-bot[bot] commented on pull request #17143: fix(dataZoom): detail shape is not the same as data with value axis
Posted by GitBox <gi...@apache.org>.
echarts-bot[bot] commented on PR #17143:
URL: https://github.com/apache/echarts/pull/17143#issuecomment-1173277133


   To reviewers: If this PR is going to be described in the changelog in the future release, please make sure this PR has one of the following labels: `PR: doc ready`, `PR: awaiting doc`, `PR: doc unchanged`

   This message is shown because the PR description doesn't contain the document related template.


--
This is an automated message from the Apache Git Service.
To respond to the message, please log on to GitHub and use the
URL above to go to the specific comment.

To unsubscribe, e-mail: commits-unsubscribe@echarts.apache.org

For queries about this service, please contact Infrastructure at:
users@infra.apache.org


---------------------------------------------------------------------
To unsubscribe, e-mail: commits-unsubscribe@echarts.apache.org
For additional commands, e-mail: commits-help@echarts.apache.org
[GitHub] [echarts] last-Programmer commented on pull request #17143: fix(dataZoom): detail shape is not the same as data with value axis
Posted by "last-Programmer (via GitHub)" <gi...@apache.org>.
last-Programmer commented on PR #17143:
URL: https://github.com/apache/echarts/pull/17143#issuecomment-1723524208

   Any idea when this will be released to the stable npm channel? Thanks.


--
This is an automated message from the Apache Git Service.
To respond to the message, please log on to GitHub and use the
URL above to go to the specific comment.

To unsubscribe, e-mail: commits-unsubscribe@echarts.apache.org

For queries about this service, please contact Infrastructure at:
users@infra.apache.org


---------------------------------------------------------------------
To unsubscribe, e-mail: commits-unsubscribe@echarts.apache.org
For additional commands, e-mail: commits-help@echarts.apache.org
[GitHub] [echarts] Ovilia commented on pull request #17143: fix(dataZoom): detail shape is not the same as data with value axis
Posted by GitBox <gi...@apache.org>.
Ovilia commented on PR #17143:
URL: https://github.com/apache/echarts/pull/17143#issuecomment-1354313659

   @ianschmitz Current detail view for the stacked bars are not correct because only the first series is considered. I'm not sure this should be included in this PR. I will see if it can be fixed.


--
This is an automated message from the Apache Git Service.
To respond to the message, please log on to GitHub and use the
URL above to go to the specific comment.

To unsubscribe, e-mail: commits-unsubscribe@echarts.apache.org

For queries about this service, please contact Infrastructure at:
users@infra.apache.org


---------------------------------------------------------------------
To unsubscribe, e-mail: commits-unsubscribe@echarts.apache.org
For additional commands, e-mail: commits-help@echarts.apache.org
[GitHub] [echarts] echarts-bot[bot] commented on pull request #17143: fix(dataZoom): detail shape is not the same as data with value axis
Posted by GitBox <gi...@apache.org>.
echarts-bot[bot] commented on PR #17143:
URL: https://github.com/apache/echarts/pull/17143#issuecomment-1143389003

   Thanks for your contribution!
   The community will review it ASAP. In the meanwhile, please checkout [the coding standard](https://echarts.apache.org/en/coding-standard.html) and Wiki about [How to make a pull request](https://github.com/apache/echarts/wiki/How-to-make-a-pull-request).

   The pull request is marked to be `PR: author is committer` because you are a committer of this project.


--
This is an automated message from the Apache Git Service.
To respond to the message, please log on to GitHub and use the
URL above to go to the specific comment.

To unsubscribe, e-mail: commits-unsubscribe@echarts.apache.org

For queries about this service, please contact Infrastructure at:
users@infra.apache.org


---------------------------------------------------------------------
To unsubscribe, e-mail: commits-unsubscribe@echarts.apache.org
For additional commands, e-mail: commits-help@echarts.apache.org
[GitHub] [echarts] martingrumbt commented on pull request #17143: fix(dataZoom): detail shape is not the same as data with value axis
Posted by "martingrumbt (via GitHub)" <gi...@apache.org>.
martingrumbt commented on PR #17143:
URL: https://github.com/apache/echarts/pull/17143#issuecomment-1621648689

   @Ovilia Thank you for having a look into this issue.

   Your fix breaks the dataZoom panels when nullish data is involved.
   `null` as x value breaks the x-axis zoom panel.
   `null` as y value breaks the y-axis zoom panel.
   Also for `undefined`, `'-'`

   ### master branch

   <img width="1674" alt="master_datazoom_x_and_y" src="https://github.com/apache/echarts/assets/31829974/c7d2ff5c-f274-49ec-bc07-43630ecc475c">
   DataZoom for x and y axis enabled

   <img width="1674" alt="master_datazoom_x" src="https://github.com/apache/echarts/assets/31829974/0227e2da-b442-4f91-a4fd-e6a8f5abcecc">
   DataZoom only for x axis enabled
   </br>

   ### fix-17141 branch

   <img width="1674" alt="fix-17141_datazoom_x_and_y" src="https://github.com/apache/echarts/assets/31829974/24d8d1d7-18fe-4940-9b9e-7d99e81ee1ce">
   DataZoom for x and y axis enabled

   <img width="1674" alt="fix-17141_datazoom_x" src="https://github.com/apache/echarts/assets/31829974/94de18da-a3bb-43d7-8abb-ca6d2cab824f">
   DataZoom only for x axis enabled

   ### TestFile
   ```
   <!DOCTYPE html>
   <html>
   <head>
       <meta charset="utf-8">
       <meta name="viewport" content="width=device-width, initial-scale=1"/>
       <script src="lib/simpleRequire.js"></script>
       <script src="lib/config.js"></script>
       <script src="lib/jquery.min.js"></script>
       <script src="lib/facePrint.js"></script>
       <script src="lib/testHelper.js"></script>
       <link rel="stylesheet" href="lib/reset.css"/>
   </head>
   <body>
   <style>
   </style>

   <script>
       const dataNoneLinear = [
           [0, 10],
           [10, 0],
           [80, 1],
           [100, 15],
       ];
       const dataNoneLinearWithNull = [
           [0, 10],
           [10, 0],
           [null, 1],
           [100, null],
       ];

       const dataTimeNoneLinear = [
           [(new Date("07/05/2023 10:00:00")).getTime(), (new Date("07/05/2023 10:00:00")).getTime()],
           [(new Date("07/05/2023 11:00:00")).getTime(), (new Date("07/05/2023 00:00:00")).getTime()],
           [(new Date("07/05/2023 18:00:00")).getTime(), (new Date("07/05/2023 01:00:00")).getTime()],
           [(new Date("07/05/2023 20:00:00")).getTime(), (new Date("07/05/2023 15:00:00")).getTime()],
       ];
       const dataTimeNoneLinearWithNull = [
           [(new Date("07/05/2023 10:00:00")).getTime(), (new Date("07/05/2023 10:00:00")).getTime()],
           [(new Date("07/05/2023 11:00:00")).getTime(), (new Date("07/05/2023 00:00:00")).getTime()],
           [null, (new Date("07/05/2023 01:00:00")).getTime()],
           [(new Date("07/05/2023 20:00:00")).getTime(), null],
       ];

       const charts = [
           {id: '01', type: 'line', axisType: 'category', data: dataNoneLinear},
           {id: '02', type: 'line', axisType: 'category', data: dataNoneLinearWithNull},
           {id: '03', type: 'line', axisType: 'value', data: dataNoneLinear},
           {id: '04', type: 'line', axisType: 'value', data: dataNoneLinearWithNull},
           {id: '05', type: 'line', axisType: 'time', data: dataTimeNoneLinear},
           {id: '06', type: 'line', axisType: 'time', data: dataTimeNoneLinearWithNull},
       ];

       function createChartDOMDiv(id) {
           let element = document.getElementById(id);
           if (!element) {
               element = document.createElement('div');
               element.id = id;
               document.body.appendChild(element);
           }
       }

       function getDataZoom(opt) {
           const dataZoom = {
               borderColor: 'blue',
               fillerColor: 'rgba(0, 255, 0, 0.2)',
               dataBackground: {
                   lineStyle: {
                       color: 'blue'
                   },
                   areaStyle: {
                       color: 'rgba(0, 0, 255, 0.6)'
                   }
               },
               selectedDataBackground: {
                   lineStyle: {
                       color: 'blue'
                   },
                   areaStyle: {
                       color: 'rgba(0, 0, 255, 0.6)'
                   }
               }
           };
           return Object.assign(opt, dataZoom);
       }

       charts.forEach(function ({id, type, axisType, data}) {
           createChartDOMDiv(id);

           require([
               'echarts',
           ], function (echarts) {
               var option;

               option = {
                   xAxis: {
                       type: axisType
                   },
                   yAxis: {
                       type: axisType
                   },
                   series: [
                       {
                           data: data,
                           type: type
                       }
                   ],
                   dataZoom: [
                       getDataZoom({
                           xAxisIndex: 0,
                       }),
                       getDataZoom({
                           yAxisIndex: 0,
                       }),
                   ]
               };

               testHelper.create(echarts, id, {
                   title: [
                       "Test DataZoom on x and y axis",
                       `${type} | ${axisType}`,
                   ],
                   info: {
                       type: type,
                       xAxisType: axisType,
                       yAxisType: axisType,
                   },
                   dataTable: {
                       x: data.map(d => d[0]),
                       y: data.map(d => d[1]),
                   },
                   option: option
               });
           });
       })
   </script>
   </body>
   </html>
   ```


--
This is an automated message from the Apache Git Service.
To respond to the message, please log on to GitHub and use the
URL above to go to the specific comment.

To unsubscribe, e-mail: commits-unsubscribe@echarts.apache.org

For queries about this service, please contact Infrastructure at:
users@infra.apache.org


---------------------------------------------------------------------
To unsubscribe, e-mail: commits-unsubscribe@echarts.apache.org
For additional commands, e-mail: commits-help@echarts.apache.org