You are viewing a plain text version of this content. The canonical link for it is here.
Posted to dev@echarts.apache.org by GitBox <gi...@apache.org> on 2018/08/24 07:11:08 UTC
[GitHub] cxkobe opened a new issue #8940: 折线图横坐标每个间隔内展示的数据点个数能不同吗
cxkobe opened a new issue #8940: 折线图横坐标每个间隔内展示的数据点个数能不同吗
URL: https://github.com/apache/incubator-echarts/issues/8940
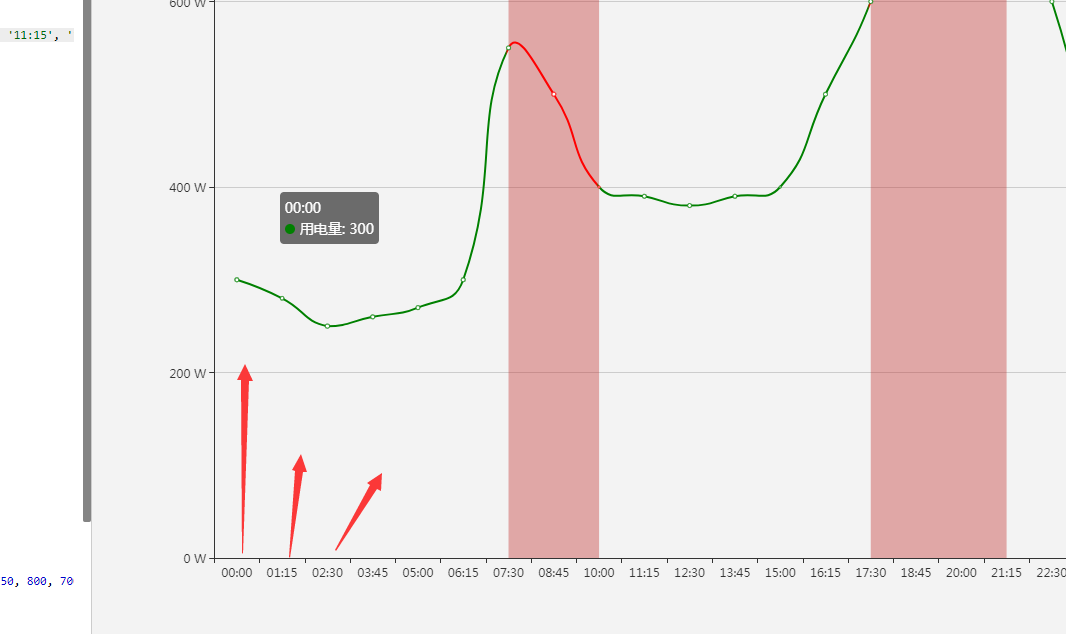
请问:如图,每个区间能展示的数据点个数能不相同吗,比如业务场景:横坐标从0点到12点分布,每个间隔是一个小时,然后0点到1点之间我想展示5个数据点,1点到两点之间展示4个数据点,这个有办法实现吗
----------------------------------------------------------------
This is an automated message from the Apache Git Service.
To respond to the message, please log on GitHub and use the
URL above to go to the specific comment.
For queries about this service, please contact Infrastructure at:
users@infra.apache.org
With regards,
Apache Git Services
---------------------------------------------------------------------
To unsubscribe, e-mail: dev-unsubscribe@echarts.apache.org
For additional commands, e-mail: dev-help@echarts.apache.org