You are viewing a plain text version of this content. The canonical link for it is here.
Posted to dev@echarts.apache.org by GitBox <gi...@apache.org> on 2018/11/12 05:32:09 UTC
[GitHub] ToughRover opened a new issue #9381: 散点图当piecewise visualMap和y轴使用同一列数据时内容无法显示
ToughRover opened a new issue #9381: 散点图当piecewise visualMap和y轴使用同一列数据时内容无法显示
URL: https://github.com/apache/incubator-echarts/issues/9381
### One-line summary [问题简述]
散点图,当y轴选择一个离散型数据列,并且设置了离散的visualMap和y轴共享一列数据时,图上的点显示为空白
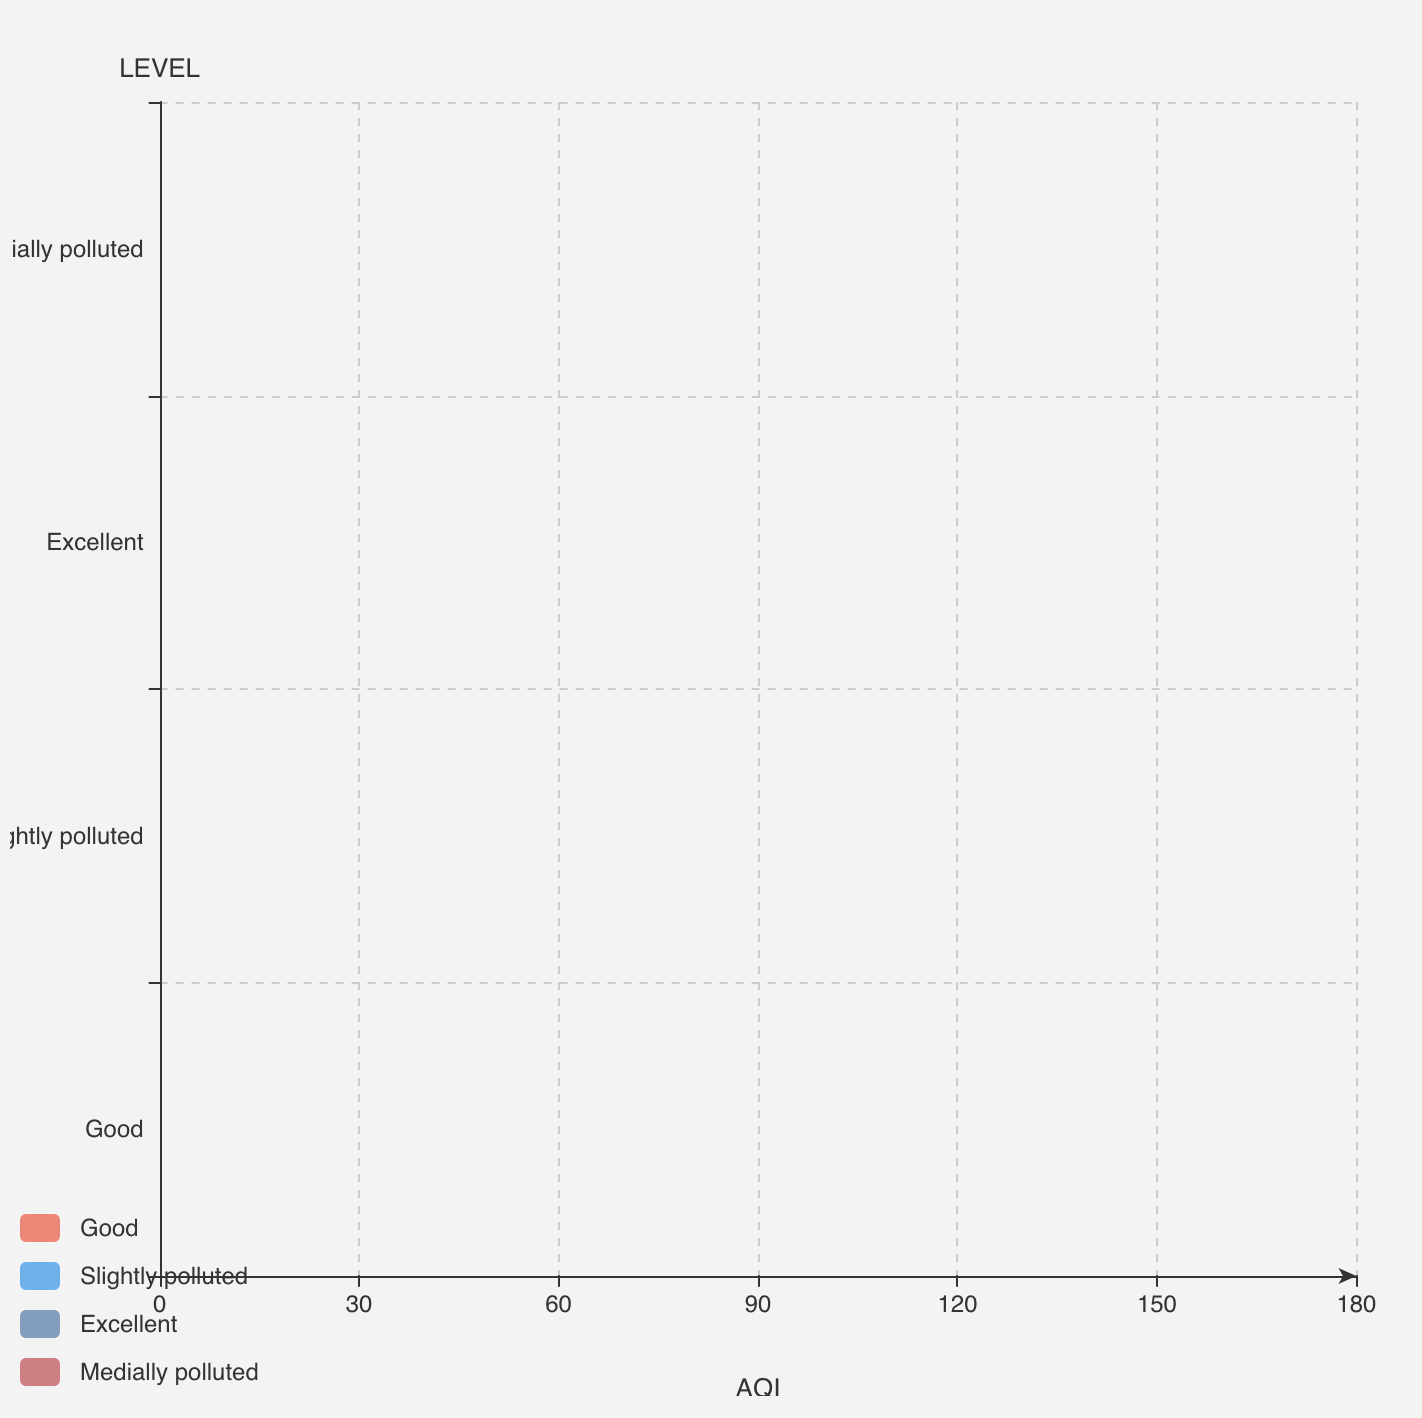
当去掉option中的visualMap部分时,图可以显示内容
### Version & Environment [版本及环境]
+ ECharts version [ECharts 版本]: 4.1.0
+ Browser version [浏览器类型和版本]: Chrome 70.0.3538.77 (Official Build) (64-bit)
+ OS Version [操作系统类型和版本]: macOS 10.14
### Expected behaviour [期望结果]
当离散visualMap和y轴使用同一列数据时,图可以正确显示
### ECharts option [ECharts配置项]
option = {
"xAxis": {
"show": true,
"nameLocation": "middle",
"name": "AQI",
"nameGap": 50,
"type": "value",
"nameTextStyle": {
"fontSize": 13
},
"scale": true,
"splitLine": {
"show": true,
"lineStyle": {
"type": "dashed"
}
},
"splitArea": {
"show": false
},
"axisLine": {
"symbol": [
"none",
"arrow"
],
"symbolSize": [
6,
9
]
}
},
"yAxis": {
"show": true,
"name": "LEVEL",
"nameLocation": "end",
"nameGap": 10,
"nameTextStyle": {
"fontSize": 13
},
"type": "category",
"scale": true,
"splitLine": {
"show": true,
"lineStyle": {
"type": "dashed"
}
},
"splitArea": {
"show": false
},
"data": [
"Good",
"Slightly polluted",
"Excellent",
"Medially polluted"
],
},
"series": [
{
"type": "scatter",
"name": "LEVEL",
"data": [
[
73,
"Good",
"Good"
],
[
133,
"Slightly polluted",
"Slightly polluted"
],
[
91,
"Good",
"Good"
],
[
81,
"Good",
"Good"
],
[
110,
"Slightly polluted",
"Slightly polluted"
],
[
60,
"Good",
"Good"
],
[
61,
"Good",
"Good"
],
[
77,
"Good",
"Good"
],
[
78,
"Good",
"Good"
],
[
74,
"Good",
"Good"
],
[
46,
"Excellent",
"Excellent"
],
[
22,
"Excellent",
"Excellent"
],
[
36,
"Excellent",
"Excellent"
],
[
60,
"Good",
"Good"
],
[
83,
"Good",
"Good"
],
[
67,
"Good",
"Good"
],
[
100,
"Good",
"Good"
],
[
88,
"Good",
"Good"
],
[
176,
"Medially polluted",
"Medially polluted"
],
[
163,
"Medially polluted",
"Medially polluted"
],
[
79,
"Good",
"Good"
],
[
87,
"Good",
"Good"
]
],
"symbolSize": 12,
"dimensions": [
{
"name": "AQI",
"type": "number"
},
{
"name": "LEVEL",
"type": "ordinal"
},
{
"name": "LEVEL",
"type": "ordinal"
}
],
"encode": {
"x": 0,
"y": 1
}
}
],
"visualMap": [
{
"seriesIndex": 0,
"dimension": 1,
"type": "piecewise",
"mapType": "color",
"splitNumber": 8,
"inRange": {
"color": [
"#fa8072",
"#5ab1ef",
"#7d9ec0",
"#d87a80"
]
},
"categories": [
"Good",
"Slightly polluted",
"Excellent",
"Medially polluted"
]
}
]
}
----------------------------------------------------------------
This is an automated message from the Apache Git Service.
To respond to the message, please log on GitHub and use the
URL above to go to the specific comment.
For queries about this service, please contact Infrastructure at:
users@infra.apache.org
With regards,
Apache Git Services
---------------------------------------------------------------------
To unsubscribe, e-mail: dev-unsubscribe@echarts.apache.org
For additional commands, e-mail: dev-help@echarts.apache.org