You are viewing a plain text version of this content. The canonical link for it is here.
Posted to dev@nutch.apache.org by GitBox <gi...@apache.org> on 2021/09/24 09:56:08 UTC
[GitHub] [nutch] sebastian-nagel commented on pull request #697: NUTCH-2896 Protocol-okhttp: make connection pool configurable
sebastian-nagel commented on pull request #697:
URL: https://github.com/apache/nutch/pull/697#issuecomment-926500796
## Tuning the connection pool configuration
Just to share the experience tuning the OkHttp connection pool(s) for a running crawl with the following characteristics:
- one crawl is split over 100 segments and each of the 100 segments is fetched in one MapReduce job. The job configuration can be adapted which allowed to try various connection pool configurations.
- every segment is fetched within 3 hours using 40 fetcher tasks, each with about 160 fetcher threads
- there is a polite delay of minimum 6 seconds between successive fetches from the same host
- every fetcher task is assigned a shuffled fetch list of about 900k URLs, about 70% of the list are successfully fetched (HTTP status code 200). HTTP redirects are added to the fetch lists on the fly.
- 90% of the fetched URLs are from hosts with at least 30 items in a fetch list. 75% with 100 or more items. So, a well-configured connection pool can save time for the bulk of the fetches.
- for 30% of the hosts only a single URL is fetched. That's why connections shouldn't kept alive for too long. But these single-URL hosts make just 1% of the URLs in a fetch list.
- the number of unique hosts per fetcher task is about 20k with 5k hosts accessed every minute
The number of accessed hosts defines the connection pool size: for the given crawl the total size should be at least 5k and there is no need for pooling 20k connections or more.
Now a couple of trials were necessary to get to a efficient configuration. For every trial the following metrics were recorded:
- CPU time (according to MapReduce job/task counters)
- profiling few fetcher map tasks using [async-profiler](https://github.com/jvm-profiling-tools/async-profiler)
Other metrics were traced but without showing significant changes. For example, the number of successfully fetched pages didn't change more than the random variation (within the range of 29.9 and 30.0 million pages per segment).
Note: All trials were run with HTTP/2 disabled, using only HTTP/1.1 - testing with HTTP/2 is planned in a later experiment.
| job CPU hours | map tasks CPU hours | pool config | description |
|---------------|---------------------|-------------|-------------|
| 169 | 108 | 1,5,300 | 1 pool with 5 idle connections, 300 sec. keep-alive time (baseline - OkHttp's default using a single client) |
| 172 | 111 | 1,50,300 | 1 pool with 50 idle connections, 300 sec. keep-alive time |
| 183 | (not measured) | 1,8192,300 | 1 pool with 8192 idle connections, 300 sec. keep-alive time |
| 141 | 78 | 48,256,300 | 48 pools each with 256 idle connections, 300 sec. keep-alive time |
| 132 | 68 | 64,256,300 | 64 pools each with 256 idle connections, 300 sec. keep-alive time |
| 133 | 68 | 128,256,300 | 128 pools each with 256 idle connections, 300 sec. keep-alive time |
The profiler gives a more detailed picture where the CPU time is spent. The absolute numbers (amount of samples) of the profiler runs are not comparable because of different contexts - other tasks running on the same node, profiling time, etc. But the relative numbers should be comparable and can be compared with the time spent in methods such as the MD5 calculation or Tika's MIME detection: if more relative time is spent there, the HTTP layer needs less CPU. Below three profiling flamegraphs (or the interactive flamegraphs (HTML) zipped: [fetcher.map.okhttp-pool-html.zip](https://github.com/apache/nutch/files/7224685/fetcher.map.okhttp-pool-html.zip)):
1. the baseline - a single pool with 5 idle connections, 300 sec. keep-alive time

2. 1 pool with 8192 idle connections, 300 sec. keep-alive time

3. 64 pools each with 256 idle connections each, 300 sec. keep-alive time
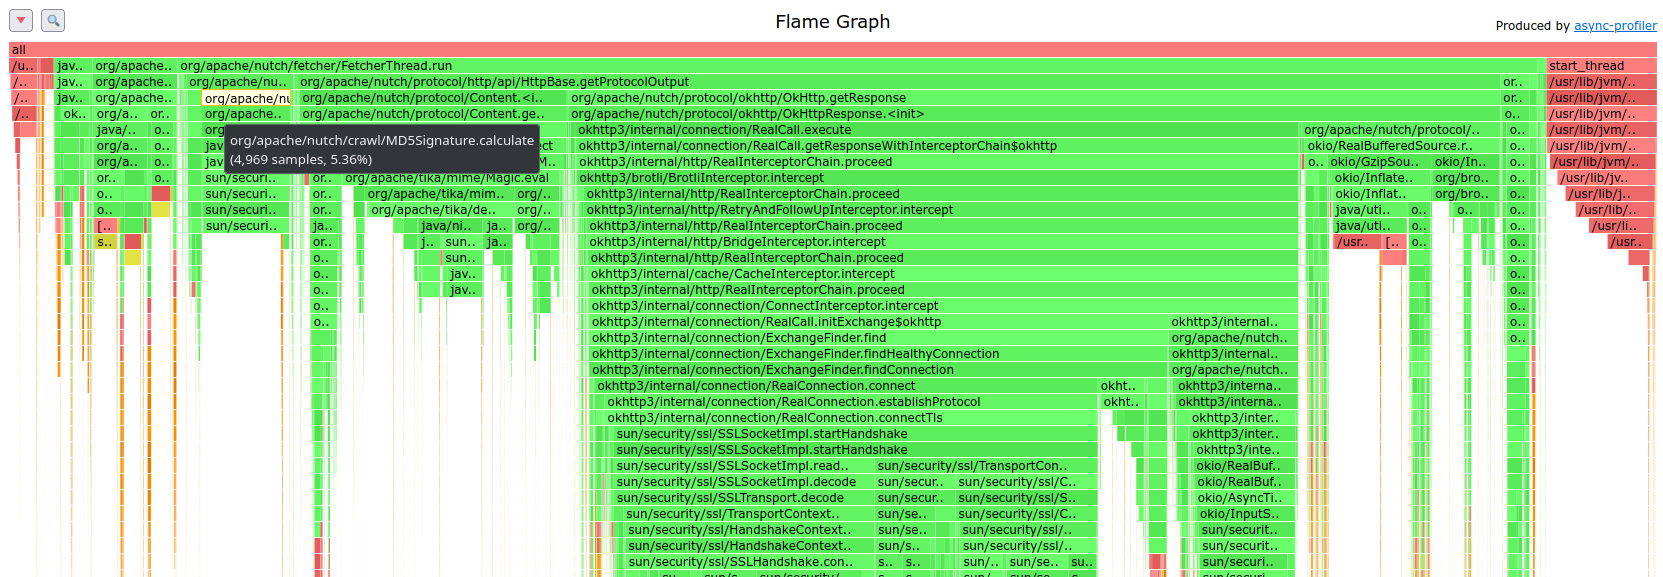
The profiles show that searching for a connection in the pool is inefficient if only a single connection pool is used. Cf. a [discussion on stackoverflow](https://stackoverflow.com/questions/63047533/connection-pool-okhttp) which confirms this finding.
Conclusion: The OkHttp protocol plugin is now configured to use 64 pools (128 seems to also work well) with max. 256 idle connections per pool. The savings are impressive:
- 20% less CPU usage (169h -> 132h) for the entire job including the reduce tasks which do the WARC packaging which is also CPU intensive
- 35% less CPU usage (108h -> 68h) in the map tasks alone
--
This is an automated message from the Apache Git Service.
To respond to the message, please log on to GitHub and use the
URL above to go to the specific comment.
To unsubscribe, e-mail: dev-unsubscribe@nutch.apache.org
For queries about this service, please contact Infrastructure at:
users@infra.apache.org