You are viewing a plain text version of this content. The canonical link for it is here.
Posted to notifications@apisix.apache.org by GitBox <gi...@apache.org> on 2021/02/02 09:25:00 UTC
[GitHub] [apisix] Firstsawyou opened a new pull request #3494: docs: update the docs of the prometheus plugin
Firstsawyou opened a new pull request #3494:
URL: https://github.com/apache/apisix/pull/3494


   ### What this PR does / why we need it:
   <!--- Why is this change required? What problem does it solve? -->
   <!--- If it fixes an open issue, please link to the issue here. -->

   close #3477

   ### Pre-submission checklist:

   * [x] Did you explain what problem does this PR solve? Or what new features have been added?
   * [ ] Have you added corresponding test cases?
   * [x] Have you modified the corresponding document?
   * [ ] Is this PR backward compatible? **If it is not backward compatible, please discuss on the [mailing list](https://github.com/apache/apisix/tree/master#community) first**


----------------------------------------------------------------
This is an automated message from the Apache Git Service.
To respond to the message, please log on to GitHub and use the
URL above to go to the specific comment.

For queries about this service, please contact Infrastructure at:
users@infra.apache.org
[GitHub] [apisix] Firstsawyou commented on a change in pull request #3494: docs: update the docs of the prometheus plugin
Posted by GitBox <gi...@apache.org>.
Firstsawyou commented on a change in pull request #3494:
URL: https://github.com/apache/apisix/pull/3494#discussion_r568529980


##########
File path: doc/plugins/prometheus.md
##########
@@ -122,12 +122,56 @@ Or you can goto [Grafana official](https://grafana.com/grafana/dashboards/11719)

 ### Available metrics

-* `Status codes`: HTTP status codes returned by upstream services. These are available per service and across all services.
+* `Status`: HTTP status codes returned by upstream services. These are available per service and across all services.
+
+    Attributes:
+
+    | Name         | Description         |
+    | -------------| --------------------|
+    | code         | The HTTP status code returned by the upstream service. |
+    | route        | The route_id of the request to match the route. If it does not match, the default is `""`. |
+    | matched_uri  | Request to match the uri of the route. If it does not match, the default is `""`. |
+    | matched_host | Request to match the hsot of the route. If it does not match, the default is `""`. |
+    | service      | The request matches the service_id of the route. If it does not match, the default is host. |

Review comment:
       updated.

##########
File path: doc/plugins/prometheus.md
##########
@@ -122,12 +122,56 @@ Or you can goto [Grafana official](https://grafana.com/grafana/dashboards/11719)

 ### Available metrics

-* `Status codes`: HTTP status codes returned by upstream services. These are available per service and across all services.
+* `Status`: HTTP status codes returned by upstream services. These are available per service and across all services.
+
+    Attributes:
+
+    | Name         | Description         |
+    | -------------| --------------------|
+    | code         | The HTTP status code returned by the upstream service. |
+    | route        | The route_id of the request to match the route. If it does not match, the default is `""`. |
+    | matched_uri  | Request to match the uri of the route. If it does not match, the default is `""`. |
+    | matched_host | Request to match the hsot of the route. If it does not match, the default is `""`. |
+    | service      | The request matches the service_id of the route. If it does not match, the default is host. |
+    | consumer     | The request matches the consumer_name of the consumer. If it does not match, the default is `""`. |
+    | node         | The request hits the ip of the upstream node. |
+
 * `Bandwidth`: Total Bandwidth (egress/ingress) flowing through apisix. This metric is available per service and as a sum across all services.
+
+    Attributes:
+
+    | Name         | Description |
+    | -------------| ------------- |
+    | type         | The type of bandwidth(egress/ingress). |
+    | route        | The route_id of the request to match the route. If it does not match, the default is `""`. |
+    | service      | The request matches the service_id of the route. If it does not match, the default is host. |
+    | consumer     | The request matches the consumer_name of the consumer. If it does not match, the default is `""`. |
+    | node         | The request hits the ip of the upstream node. |

Review comment:
       updated.


----------------------------------------------------------------
This is an automated message from the Apache Git Service.
To respond to the message, please log on to GitHub and use the
URL above to go to the specific comment.

For queries about this service, please contact Infrastructure at:
users@infra.apache.org
[GitHub] [apisix] Firstsawyou commented on a change in pull request #3494: docs: update the docs of the prometheus plugin
Posted by GitBox <gi...@apache.org>.
Firstsawyou commented on a change in pull request #3494:
URL: https://github.com/apache/apisix/pull/3494#discussion_r568509007


##########
File path: doc/plugins/prometheus.md
##########
@@ -122,12 +122,56 @@ Or you can goto [Grafana official](https://grafana.com/grafana/dashboards/11719)

 ### Available metrics

-* `Status codes`: HTTP status codes returned by upstream services. These are available per service and across all services.
+* `Status`: HTTP status codes returned by upstream services. These are available per service and across all services.
+
+    Attributes:
+
+    | Name         | Description         |
+    | -------------| --------------------|
+    | code         | The HTTP status code returned by the upstream service. |
+    | route        | The route_id of the request to match the route. If it does not match, the default is `""`. |
+    | matched_uri  | Request to match the uri of the route. If it does not match, the default is `""`. |
+    | matched_host | Request to match the hsot of the route. If it does not match, the default is `""`. |
+    | service      | The request matches the service_id of the route. If it does not match, the default is host. |

Review comment:
       Yes, the description here is inappropriate.


----------------------------------------------------------------
This is an automated message from the Apache Git Service.
To respond to the message, please log on to GitHub and use the
URL above to go to the specific comment.

For queries about this service, please contact Infrastructure at:
users@infra.apache.org
[GitHub] [apisix] Firstsawyou commented on a change in pull request #3494: docs: update the docs of the prometheus plugin
Posted by GitBox <gi...@apache.org>.
Firstsawyou commented on a change in pull request #3494:
URL: https://github.com/apache/apisix/pull/3494#discussion_r580273519


##########
File path: doc/plugins/prometheus.md
##########
@@ -122,12 +122,56 @@ Or you can goto [Grafana official](https://grafana.com/grafana/dashboards/11719)

 ### Available metrics

-* `Status codes`: HTTP status codes returned by upstream services. These are available per service and across all services.
+* `Status`: HTTP status codes returned by upstream services. These are available per service and across all services.

Review comment:
       updated.


----------------------------------------------------------------
This is an automated message from the Apache Git Service.
To respond to the message, please log on to GitHub and use the
URL above to go to the specific comment.

For queries about this service, please contact Infrastructure at:
users@infra.apache.org
[GitHub] [apisix] Firstsawyou commented on a change in pull request #3494: docs: update the docs of the prometheus plugin
Posted by GitBox <gi...@apache.org>.
Firstsawyou commented on a change in pull request #3494:
URL: https://github.com/apache/apisix/pull/3494#discussion_r580272838


##########
File path: doc/plugins/prometheus.md
##########
@@ -122,12 +122,56 @@ Or you can goto [Grafana official](https://grafana.com/grafana/dashboards/11719)

 ### Available metrics

-* `Status codes`: HTTP status codes returned by upstream services. These are available per service and across all services.
+* `Status`: HTTP status codes returned by upstream services. These are available per service and across all services.
+
+    Attributes:
+
+    | Name         | Description         |
+    | -------------| --------------------|
+    | code         | The HTTP status code returned by the upstream service. |

Review comment:
       `Status` => `Status codes`


----------------------------------------------------------------
This is an automated message from the Apache Git Service.
To respond to the message, please log on to GitHub and use the
URL above to go to the specific comment.

For queries about this service, please contact Infrastructure at:
users@infra.apache.org
[GitHub] [apisix] Firstsawyou commented on a change in pull request #3494: docs: update the docs of the prometheus plugin
Posted by GitBox <gi...@apache.org>.
Firstsawyou commented on a change in pull request #3494:
URL: https://github.com/apache/apisix/pull/3494#discussion_r603805347


##########
File path: docs/en/latest/plugins/prometheus.md
##########
@@ -122,26 +122,70 @@ Or you can goto [Grafana official](https://grafana.com/grafana/dashboards/11719)

 ### Available metrics

-* `Status codes`: HTTP status codes returned by upstream services. These are available per service and across all services.
-* `Bandwidth`: Total Bandwidth (egress/ingress) flowing through apisix. This metric is available per service and as a sum across all services.
-* `etcd reachability`: A gauge type with a value of 0 or 1, representing if etcd can be reached by a apisix or not.
+* `Status codes`: HTTP status code returned from upstream services. These status code available per service and across all services.
+
+    Attributes:
+
+    | Name         | Description         |
+    | -------------| --------------------|
+    | code         | The HTTP status code returned by the upstream service. |
+    | route        | The `route_id` of the matched route is request. If it does not match, the default value is an empty string. |
+    | matched_uri  | The `uri` of the route matching the request, if it does not match, the default value is an empty string. |
+    | matched_host | The `host` of the route that matches the request. If it does not match, the default value is an empty string. |
+    | service      | The `service_id` of the route matched by the request. When the route lacks service_id, the default is `$host`. |
+    | consumer     | The `consumer_name` of the consumer that matches the request. If it does not match, the default value is an empty string. |
+    | node         | The `ip` of the upstream node. |
+
+* `Bandwidth`: Total Bandwidth (egress/ingress) flowing through apisix. The total bandwidth of each service or all services can be counted.

Review comment:
       Updated.


--
This is an automated message from the Apache Git Service.
To respond to the message, please log on to GitHub and use the
URL above to go to the specific comment.

For queries about this service, please contact Infrastructure at:
users@infra.apache.org
[GitHub] [apisix] Firstsawyou commented on a change in pull request #3494: docs: update the docs of the prometheus plugin
Posted by GitBox <gi...@apache.org>.
Firstsawyou commented on a change in pull request #3494:
URL: https://github.com/apache/apisix/pull/3494#discussion_r580177406


##########
File path: doc/plugins/prometheus.md
##########
@@ -122,12 +122,56 @@ Or you can goto [Grafana official](https://grafana.com/grafana/dashboards/11719)

 ### Available metrics

-* `Status codes`: HTTP status codes returned by upstream services. These are available per service and across all services.
+* `Status`: HTTP status codes returned by upstream services. These are available per service and across all services.
+
+    Attributes:
+
+    | Name         | Description         |
+    | -------------| --------------------|
+    | code         | The HTTP status code returned by the upstream service. |
+    | route        | The `route_id` of the matched route is requested. If it does not match, the default value is an empty string. |
+    | matched_uri  | The `uri` of the route matching the request, if it does not match, the default value is an empty string. |
+    | matched_host | The `hsot` of the route that matches the request. If it does not match, the default value is an empty string. |

Review comment:
       updated.


----------------------------------------------------------------
This is an automated message from the Apache Git Service.
To respond to the message, please log on to GitHub and use the
URL above to go to the specific comment.

For queries about this service, please contact Infrastructure at:
users@infra.apache.org
[GitHub] [apisix] spacewander commented on a change in pull request #3494: docs: update the docs of the prometheus plugin
Posted by GitBox <gi...@apache.org>.
spacewander commented on a change in pull request #3494:
URL: https://github.com/apache/apisix/pull/3494#discussion_r568495637


##########
File path: doc/plugins/prometheus.md
##########
@@ -122,12 +122,56 @@ Or you can goto [Grafana official](https://grafana.com/grafana/dashboards/11719)

 ### Available metrics

-* `Status codes`: HTTP status codes returned by upstream services. These are available per service and across all services.
+* `Status`: HTTP status codes returned by upstream services. These are available per service and across all services.
+
+    Attributes:
+
+    | Name         | Description         |
+    | -------------| --------------------|
+    | code         | The HTTP status code returned by the upstream service. |
+    | route        | The route_id of the request to match the route. If it does not match, the default is `""`. |
+    | matched_uri  | Request to match the uri of the route. If it does not match, the default is `""`. |
+    | matched_host | Request to match the hsot of the route. If it does not match, the default is `""`. |
+    | service      | The request matches the service_id of the route. If it does not match, the default is host. |
+    | consumer     | The request matches the consumer_name of the consumer. If it does not match, the default is `""`. |
+    | node         | The request hits the ip of the upstream node. |
+
 * `Bandwidth`: Total Bandwidth (egress/ingress) flowing through apisix. This metric is available per service and as a sum across all services.
+
+    Attributes:
+
+    | Name         | Description |
+    | -------------| ------------- |
+    | type         | The type of bandwidth(egress/ingress). |
+    | route        | The route_id of the request to match the route. If it does not match, the default is `""`. |
+    | service      | The request matches the service_id of the route. If it does not match, the default is host. |
+    | consumer     | The request matches the consumer_name of the consumer. If it does not match, the default is `""`. |
+    | node         | The request hits the ip of the upstream node. |

Review comment:
       The subject should be the `ip`, not `the request`. Please fix other similar cases.


----------------------------------------------------------------
This is an automated message from the Apache Git Service.
To respond to the message, please log on to GitHub and use the
URL above to go to the specific comment.

For queries about this service, please contact Infrastructure at:
users@infra.apache.org
[GitHub] [apisix] moonming commented on a change in pull request #3494: docs: update the docs of the prometheus plugin
Posted by GitBox <gi...@apache.org>.
moonming commented on a change in pull request #3494:
URL: https://github.com/apache/apisix/pull/3494#discussion_r583421215


##########
File path: docs/zh/latest/plugins/prometheus.md
##########
@@ -118,12 +118,49 @@ plugin_attr:

 ### 可有的指标

-* `Status codes`: upstream 服务返回的 HTTP 状态码,每个服务返回状态码的次数或者所有服务的状态码次数总和都可以统计到。
-* `Bandwidth`: 流经apisix的总带宽(可分出口带宽和入口带宽). 每个服务指标或者是所有服务指标的总和都可以统计到。
+* `Status codes`: upstream 服务返回的 HTTP 状态码,每个服务返回状态码的次数或者所有服务的状态码次数总和都可以统计到。具有的维度:

Review comment:
       I think you need add a issue for improve grammar and grammar, the writing skill is not good


----------------------------------------------------------------
This is an automated message from the Apache Git Service.
To respond to the message, please log on to GitHub and use the
URL above to go to the specific comment.

For queries about this service, please contact Infrastructure at:
users@infra.apache.org
[GitHub] [apisix] membphis commented on pull request #3494: docs: update the docs of the prometheus plugin
Posted by GitBox <gi...@apache.org>.
membphis commented on pull request #3494:
URL: https://github.com/apache/apisix/pull/3494#issuecomment-782782578


   @Yiyiyimu Chaos Test failed, please take a look


----------------------------------------------------------------
This is an automated message from the Apache Git Service.
To respond to the message, please log on to GitHub and use the
URL above to go to the specific comment.

For queries about this service, please contact Infrastructure at:
users@infra.apache.org
[GitHub] [apisix] Firstsawyou commented on a change in pull request #3494: docs: update the docs of the prometheus plugin
Posted by GitBox <gi...@apache.org>.
Firstsawyou commented on a change in pull request #3494:
URL: https://github.com/apache/apisix/pull/3494#discussion_r583633418


##########
File path: docs/zh/latest/plugins/prometheus.md
##########
@@ -118,12 +118,49 @@ plugin_attr:

 ### 可有的指标

-* `Status codes`: upstream 服务返回的 HTTP 状态码,每个服务返回状态码的次数或者所有服务的状态码次数总和都可以统计到。
-* `Bandwidth`: 流经apisix的总带宽(可分出口带宽和入口带宽). 每个服务指标或者是所有服务指标的总和都可以统计到。
+* `Status codes`: upstream 服务返回的 HTTP 状态码,每个服务返回状态码的次数或者所有服务的状态码次数总和都可以统计到。具有的维度:

Review comment:
       added: [https://github.com/apache/apisix/issues/3689 ](https://github.com/apache/apisix/issues/3689)


----------------------------------------------------------------
This is an automated message from the Apache Git Service.
To respond to the message, please log on to GitHub and use the
URL above to go to the specific comment.

For queries about this service, please contact Infrastructure at:
users@infra.apache.org
[GitHub] [apisix] moonming commented on a change in pull request #3494: docs: update the docs of the prometheus plugin
Posted by GitBox <gi...@apache.org>.
moonming commented on a change in pull request #3494:
URL: https://github.com/apache/apisix/pull/3494#discussion_r583421215


##########
File path: docs/zh/latest/plugins/prometheus.md
##########
@@ -118,12 +118,49 @@ plugin_attr:

 ### 可有的指标

-* `Status codes`: upstream 服务返回的 HTTP 状态码,每个服务返回状态码的次数或者所有服务的状态码次数总和都可以统计到。
-* `Bandwidth`: 流经apisix的总带宽(可分出口带宽和入口带宽). 每个服务指标或者是所有服务指标的总和都可以统计到。
+* `Status codes`: upstream 服务返回的 HTTP 状态码,每个服务返回状态码的次数或者所有服务的状态码次数总和都可以统计到。具有的维度:

Review comment:
       I think you need add a issue for improve grammar, the writing skill is not good


----------------------------------------------------------------
This is an automated message from the Apache Git Service.
To respond to the message, please log on to GitHub and use the
URL above to go to the specific comment.

For queries about this service, please contact Infrastructure at:
users@infra.apache.org
[GitHub] [apisix] moonming commented on pull request #3494: docs: update the docs of the prometheus plugin
Posted by GitBox <gi...@apache.org>.
moonming commented on pull request #3494:
URL: https://github.com/apache/apisix/pull/3494#issuecomment-782587227


   you are not modify the doc.


----------------------------------------------------------------
This is an automated message from the Apache Git Service.
To respond to the message, please log on to GitHub and use the
URL above to go to the specific comment.

For queries about this service, please contact Infrastructure at:
users@infra.apache.org
[GitHub] [apisix] spacewander commented on a change in pull request #3494: docs: update the docs of the prometheus plugin
Posted by GitBox <gi...@apache.org>.
spacewander commented on a change in pull request #3494:
URL: https://github.com/apache/apisix/pull/3494#discussion_r568495637


##########
File path: doc/plugins/prometheus.md
##########
@@ -122,12 +122,56 @@ Or you can goto [Grafana official](https://grafana.com/grafana/dashboards/11719)

 ### Available metrics

-* `Status codes`: HTTP status codes returned by upstream services. These are available per service and across all services.
+* `Status`: HTTP status codes returned by upstream services. These are available per service and across all services.
+
+    Attributes:
+
+    | Name         | Description         |
+    | -------------| --------------------|
+    | code         | The HTTP status code returned by the upstream service. |
+    | route        | The route_id of the request to match the route. If it does not match, the default is `""`. |
+    | matched_uri  | Request to match the uri of the route. If it does not match, the default is `""`. |
+    | matched_host | Request to match the hsot of the route. If it does not match, the default is `""`. |
+    | service      | The request matches the service_id of the route. If it does not match, the default is host. |
+    | consumer     | The request matches the consumer_name of the consumer. If it does not match, the default is `""`. |
+    | node         | The request hits the ip of the upstream node. |
+
 * `Bandwidth`: Total Bandwidth (egress/ingress) flowing through apisix. This metric is available per service and as a sum across all services.
+
+    Attributes:
+
+    | Name         | Description |
+    | -------------| ------------- |
+    | type         | The type of bandwidth(egress/ingress). |
+    | route        | The route_id of the request to match the route. If it does not match, the default is `""`. |
+    | service      | The request matches the service_id of the route. If it does not match, the default is host. |
+    | consumer     | The request matches the consumer_name of the consumer. If it does not match, the default is `""`. |
+    | node         | The request hits the ip of the upstream node. |

Review comment:
       The subject should be the `ip`, not `the request`.

##########
File path: doc/plugins/prometheus.md
##########
@@ -122,12 +122,56 @@ Or you can goto [Grafana official](https://grafana.com/grafana/dashboards/11719)

 ### Available metrics

-* `Status codes`: HTTP status codes returned by upstream services. These are available per service and across all services.
+* `Status`: HTTP status codes returned by upstream services. These are available per service and across all services.
+
+    Attributes:
+
+    | Name         | Description         |
+    | -------------| --------------------|
+    | code         | The HTTP status code returned by the upstream service. |
+    | route        | The route_id of the request to match the route. If it does not match, the default is `""`. |
+    | matched_uri  | Request to match the uri of the route. If it does not match, the default is `""`. |
+    | matched_host | Request to match the hsot of the route. If it does not match, the default is `""`. |
+    | service      | The request matches the service_id of the route. If it does not match, the default is host. |

Review comment:
       "host" should be `$host`? And we use the default value not because "it does not match", but because there is no service id of the matched route.

##########
File path: doc/plugins/prometheus.md
##########
@@ -122,12 +122,56 @@ Or you can goto [Grafana official](https://grafana.com/grafana/dashboards/11719)

 ### Available metrics

-* `Status codes`: HTTP status codes returned by upstream services. These are available per service and across all services.
+* `Status`: HTTP status codes returned by upstream services. These are available per service and across all services.
+
+    Attributes:
+
+    | Name         | Description         |
+    | -------------| --------------------|
+    | code         | The HTTP status code returned by the upstream service. |
+    | route        | The route_id of the request to match the route. If it does not match, the default is `""`. |
+    | matched_uri  | Request to match the uri of the route. If it does not match, the default is `""`. |
+    | matched_host | Request to match the hsot of the route. If it does not match, the default is `""`. |
+    | service      | The request matches the service_id of the route. If it does not match, the default is host. |
+    | consumer     | The request matches the consumer_name of the consumer. If it does not match, the default is `""`. |
+    | node         | The request hits the ip of the upstream node. |
+
 * `Bandwidth`: Total Bandwidth (egress/ingress) flowing through apisix. This metric is available per service and as a sum across all services.
+
+    Attributes:
+
+    | Name         | Description |
+    | -------------| ------------- |
+    | type         | The type of bandwidth(egress/ingress). |
+    | route        | The route_id of the request to match the route. If it does not match, the default is `""`. |
+    | service      | The request matches the service_id of the route. If it does not match, the default is host. |

Review comment:
       The service_id of the route matched by the request?

##########
File path: doc/plugins/prometheus.md
##########
@@ -122,12 +122,56 @@ Or you can goto [Grafana official](https://grafana.com/grafana/dashboards/11719)

 ### Available metrics

-* `Status codes`: HTTP status codes returned by upstream services. These are available per service and across all services.
+* `Status`: HTTP status codes returned by upstream services. These are available per service and across all services.
+
+    Attributes:
+
+    | Name         | Description         |
+    | -------------| --------------------|
+    | code         | The HTTP status code returned by the upstream service. |
+    | route        | The route_id of the request to match the route. If it does not match, the default is `""`. |
+    | matched_uri  | Request to match the uri of the route. If it does not match, the default is `""`. |
+    | matched_host | Request to match the hsot of the route. If it does not match, the default is `""`. |
+    | service      | The request matches the service_id of the route. If it does not match, the default is host. |
+    | consumer     | The request matches the consumer_name of the consumer. If it does not match, the default is `""`. |
+    | node         | The request hits the ip of the upstream node. |
+
 * `Bandwidth`: Total Bandwidth (egress/ingress) flowing through apisix. This metric is available per service and as a sum across all services.
+
+    Attributes:
+
+    | Name         | Description |
+    | -------------| ------------- |
+    | type         | The type of bandwidth(egress/ingress). |
+    | route        | The route_id of the request to match the route. If it does not match, the default is `""`. |
+    | service      | The request matches the service_id of the route. If it does not match, the default is host. |
+    | consumer     | The request matches the consumer_name of the consumer. If it does not match, the default is `""`. |
+    | node         | The request hits the ip of the upstream node. |

Review comment:
       The subject should be the `ip`, not `the request`. Please fix other similar cases.


----------------------------------------------------------------
This is an automated message from the Apache Git Service.
To respond to the message, please log on to GitHub and use the
URL above to go to the specific comment.

For queries about this service, please contact Infrastructure at:
users@infra.apache.org
[GitHub] [apisix] Firstsawyou commented on a change in pull request #3494: docs: update the docs of the prometheus plugin
Posted by GitBox <gi...@apache.org>.
Firstsawyou commented on a change in pull request #3494:
URL: https://github.com/apache/apisix/pull/3494#discussion_r568509007


##########
File path: doc/plugins/prometheus.md
##########
@@ -122,12 +122,56 @@ Or you can goto [Grafana official](https://grafana.com/grafana/dashboards/11719)

 ### Available metrics

-* `Status codes`: HTTP status codes returned by upstream services. These are available per service and across all services.
+* `Status`: HTTP status codes returned by upstream services. These are available per service and across all services.
+
+    Attributes:
+
+    | Name         | Description         |
+    | -------------| --------------------|
+    | code         | The HTTP status code returned by the upstream service. |
+    | route        | The route_id of the request to match the route. If it does not match, the default is `""`. |
+    | matched_uri  | Request to match the uri of the route. If it does not match, the default is `""`. |
+    | matched_host | Request to match the hsot of the route. If it does not match, the default is `""`. |
+    | service      | The request matches the service_id of the route. If it does not match, the default is host. |

Review comment:
       Yes, the description here is inappropriate.

##########
File path: doc/plugins/prometheus.md
##########
@@ -122,12 +122,56 @@ Or you can goto [Grafana official](https://grafana.com/grafana/dashboards/11719)

 ### Available metrics

-* `Status codes`: HTTP status codes returned by upstream services. These are available per service and across all services.
+* `Status`: HTTP status codes returned by upstream services. These are available per service and across all services.
+
+    Attributes:
+
+    | Name         | Description         |
+    | -------------| --------------------|
+    | code         | The HTTP status code returned by the upstream service. |
+    | route        | The route_id of the request to match the route. If it does not match, the default is `""`. |
+    | matched_uri  | Request to match the uri of the route. If it does not match, the default is `""`. |
+    | matched_host | Request to match the hsot of the route. If it does not match, the default is `""`. |
+    | service      | The request matches the service_id of the route. If it does not match, the default is host. |

Review comment:
       updated.

##########
File path: doc/plugins/prometheus.md
##########
@@ -122,12 +122,56 @@ Or you can goto [Grafana official](https://grafana.com/grafana/dashboards/11719)

 ### Available metrics

-* `Status codes`: HTTP status codes returned by upstream services. These are available per service and across all services.
+* `Status`: HTTP status codes returned by upstream services. These are available per service and across all services.
+
+    Attributes:
+
+    | Name         | Description         |
+    | -------------| --------------------|
+    | code         | The HTTP status code returned by the upstream service. |
+    | route        | The route_id of the request to match the route. If it does not match, the default is `""`. |
+    | matched_uri  | Request to match the uri of the route. If it does not match, the default is `""`. |
+    | matched_host | Request to match the hsot of the route. If it does not match, the default is `""`. |
+    | service      | The request matches the service_id of the route. If it does not match, the default is host. |
+    | consumer     | The request matches the consumer_name of the consumer. If it does not match, the default is `""`. |
+    | node         | The request hits the ip of the upstream node. |
+
 * `Bandwidth`: Total Bandwidth (egress/ingress) flowing through apisix. This metric is available per service and as a sum across all services.
+
+    Attributes:
+
+    | Name         | Description |
+    | -------------| ------------- |
+    | type         | The type of bandwidth(egress/ingress). |
+    | route        | The route_id of the request to match the route. If it does not match, the default is `""`. |
+    | service      | The request matches the service_id of the route. If it does not match, the default is host. |
+    | consumer     | The request matches the consumer_name of the consumer. If it does not match, the default is `""`. |
+    | node         | The request hits the ip of the upstream node. |

Review comment:
       updated.

##########
File path: doc/zh-cn/plugins/prometheus.md
##########
@@ -120,12 +120,49 @@ plugin_attr:

 ### 可有的指标

-* `Status codes`: upstream 服务返回的 HTTP 状态码,每个服务返回状态码的次数或者所有服务的状态码次数总和都可以统计到。
-* `Bandwidth`: 流经apisix的总带宽(可分出口带宽和入口带宽). 每个服务指标或者是所有服务指标的总和都可以统计到。
+* `Status`: upstream 服务返回的 HTTP 状态码,每个服务返回状态码的次数或者所有服务的状态码次数总和都可以统计到。具有的维度:
+
+    | 名称          |    描述             |
+    | -------------| --------------------|
+    | code         | upstream 服务返回的 HTTP 状态码。 |
+    | route        | 请求匹配的 route 的 `route_id`,未匹配,则默认为`""`。 |

Review comment:
       Yes, in the case of no matching route, the default value is an empty string.

   like this:

   ```
   apisix_http_status{code="404",route="",matched_uri="",matched_host="",service="127.0.0.1",consumer="",node=""} 1
   ```


----------------------------------------------------------------
This is an automated message from the Apache Git Service.
To respond to the message, please log on to GitHub and use the
URL above to go to the specific comment.

For queries about this service, please contact Infrastructure at:
users@infra.apache.org
[GitHub] [apisix] membphis commented on a change in pull request #3494: docs: update the docs of the prometheus plugin
Posted by GitBox <gi...@apache.org>.
membphis commented on a change in pull request #3494:
URL: https://github.com/apache/apisix/pull/3494#discussion_r584113634
##########
File path: docs/zh/latest/plugins/prometheus.md
##########
@@ -118,12 +118,49 @@ plugin_attr:
### 可有的指标
-* `Status codes`: upstream 服务返回的 HTTP 状态码,每个服务返回状态码的次数或者所有服务的状态码次数总和都可以统计到。
-* `Bandwidth`: 流经apisix的总带宽(可分出口带宽和入口带宽). 每个服务指标或者是所有服务指标的总和都可以统计到。
+* `Status codes`: upstream 服务返回的 HTTP 状态码,每个服务返回状态码的次数或者所有服务的状态码次数总和都可以统计到。具有的维度:
Review comment:
ping @moonming

----------------------------------------------------------------
This is an automated message from the Apache Git Service.
To respond to the message, please log on to GitHub and use the
URL above to go to the specific comment.
For queries about this service, please contact Infrastructure at:
users@infra.apache.org
[GitHub] [apisix] Firstsawyou commented on a change in pull request #3494: docs: update the docs of the prometheus plugin
Posted by GitBox <gi...@apache.org>.
Firstsawyou commented on a change in pull request #3494:
URL: https://github.com/apache/apisix/pull/3494#discussion_r603805041


##########
File path: docs/en/latest/plugins/prometheus.md
##########
@@ -122,26 +122,70 @@ Or you can goto [Grafana official](https://grafana.com/grafana/dashboards/11719)

 ### Available metrics

-* `Status codes`: HTTP status codes returned by upstream services. These are available per service and across all services.
-* `Bandwidth`: Total Bandwidth (egress/ingress) flowing through apisix. This metric is available per service and as a sum across all services.
-* `etcd reachability`: A gauge type with a value of 0 or 1, representing if etcd can be reached by a apisix or not.
+* `Status codes`: HTTP status code returned from upstream services. These status code available per service and across all services.
+
+    Attributes:
+
+    | Name         | Description         |
+    | -------------| --------------------|
+    | code         | The HTTP status code returned by the upstream service. |
+    | route        | The `route_id` of the matched route is request. If it does not match, the default value is an empty string. |
+    | matched_uri  | The `uri` of the route matching the request, if it does not match, the default value is an empty string. |
+    | matched_host | The `host` of the route that matches the request. If it does not match, the default value is an empty string. |
+    | service      | The `service_id` of the route matched by the request. When the route lacks service_id, the default is `$host`. |

Review comment:
       Updated.


--
This is an automated message from the Apache Git Service.
To respond to the message, please log on to GitHub and use the
URL above to go to the specific comment.

For queries about this service, please contact Infrastructure at:
users@infra.apache.org
[GitHub] [apisix] Firstsawyou commented on pull request #3494: docs: update the docs of the prometheus plugin
Posted by GitBox <gi...@apache.org>.
Firstsawyou commented on pull request #3494:
URL: https://github.com/apache/apisix/pull/3494#issuecomment-810713235


   @spacewander  Please take a look, when you have time.


--
This is an automated message from the Apache Git Service.
To respond to the message, please log on to GitHub and use the
URL above to go to the specific comment.

For queries about this service, please contact Infrastructure at:
users@infra.apache.org
[GitHub] [apisix] Firstsawyou commented on pull request #3494: docs: update the docs of the prometheus plugin
Posted by GitBox <gi...@apache.org>.
Firstsawyou commented on pull request #3494:
URL: https://github.com/apache/apisix/pull/3494#issuecomment-785793278


   @moonming  @juzhiyuan @tokers   Please take a look.


----------------------------------------------------------------
This is an automated message from the Apache Git Service.
To respond to the message, please log on to GitHub and use the
URL above to go to the specific comment.

For queries about this service, please contact Infrastructure at:
users@infra.apache.org
[GitHub] [apisix] moonming commented on a change in pull request #3494: docs: update the docs of the prometheus plugin
Posted by GitBox <gi...@apache.org>.
moonming commented on a change in pull request #3494:
URL: https://github.com/apache/apisix/pull/3494#discussion_r568716755


##########
File path: doc/zh-cn/plugins/prometheus.md
##########
@@ -120,12 +120,49 @@ plugin_attr:

 ### 可有的指标

-* `Status codes`: upstream 服务返回的 HTTP 状态码,每个服务返回状态码的次数或者所有服务的状态码次数总和都可以统计到。
-* `Bandwidth`: 流经apisix的总带宽(可分出口带宽和入口带宽). 每个服务指标或者是所有服务指标的总和都可以统计到。
+* `Status`: upstream 服务返回的 HTTP 状态码,每个服务返回状态码的次数或者所有服务的状态码次数总和都可以统计到。具有的维度:
+
+    | 名称          |    描述             |
+    | -------------| --------------------|
+    | code         | upstream 服务返回的 HTTP 状态码。 |
+    | route        | 请求匹配的 route 的 `route_id`,未匹配,则默认为`""`。 |

Review comment:
       the default value is empyy string or what else?


----------------------------------------------------------------
This is an automated message from the Apache Git Service.
To respond to the message, please log on to GitHub and use the
URL above to go to the specific comment.

For queries about this service, please contact Infrastructure at:
users@infra.apache.org
[GitHub] [apisix] membphis commented on pull request #3494: docs: update the docs of the prometheus plugin
Posted by GitBox <gi...@apache.org>.
membphis commented on pull request #3494:
URL: https://github.com/apache/apisix/pull/3494#issuecomment-786446705


   ping @moonming


----------------------------------------------------------------
This is an automated message from the Apache Git Service.
To respond to the message, please log on to GitHub and use the
URL above to go to the specific comment.

For queries about this service, please contact Infrastructure at:
users@infra.apache.org
[GitHub] [apisix] Firstsawyou commented on pull request #3494: docs: update the docs of the prometheus plugin
Posted by GitBox <gi...@apache.org>.
Firstsawyou commented on pull request #3494:
URL: https://github.com/apache/apisix/pull/3494#issuecomment-782561713


   ping @moonming   please take a look.


----------------------------------------------------------------
This is an automated message from the Apache Git Service.
To respond to the message, please log on to GitHub and use the
URL above to go to the specific comment.

For queries about this service, please contact Infrastructure at:
users@infra.apache.org
[GitHub] [apisix] tokers commented on a change in pull request #3494: docs: update the docs of the prometheus plugin
Posted by GitBox <gi...@apache.org>.
tokers commented on a change in pull request #3494:
URL: https://github.com/apache/apisix/pull/3494#discussion_r580164824


##########
File path: doc/plugins/prometheus.md
##########
@@ -122,12 +122,56 @@ Or you can goto [Grafana official](https://grafana.com/grafana/dashboards/11719)

 ### Available metrics

-* `Status codes`: HTTP status codes returned by upstream services. These are available per service and across all services.
+* `Status`: HTTP status codes returned by upstream services. These are available per service and across all services.
+
+    Attributes:
+
+    | Name         | Description         |
+    | -------------| --------------------|
+    | code         | The HTTP status code returned by the upstream service. |
+    | route        | The `route_id` of the matched route is requested. If it does not match, the default value is an empty string. |
+    | matched_uri  | The `uri` of the route matching the request, if it does not match, the default value is an empty string. |
+    | matched_host | The `hsot` of the route that matches the request. If it does not match, the default value is an empty string. |

Review comment:
       Typo: `hsot` => `host`.


----------------------------------------------------------------
This is an automated message from the Apache Git Service.
To respond to the message, please log on to GitHub and use the
URL above to go to the specific comment.

For queries about this service, please contact Infrastructure at:
users@infra.apache.org
[GitHub] [apisix] Firstsawyou commented on a change in pull request #3494: docs: update the docs of the prometheus plugin
Posted by GitBox <gi...@apache.org>.
Firstsawyou commented on a change in pull request #3494:
URL: https://github.com/apache/apisix/pull/3494#discussion_r582844902


##########
File path: docs/en/latest/plugins/prometheus.md
##########
@@ -120,12 +120,56 @@ Or you can goto [Grafana official](https://grafana.com/grafana/dashboards/11719)

 ### Available metrics

-* `Status codes`: HTTP status codes returned by upstream services. These are available per service and across all services.
+* `Status codes`: HTTP status code returned from upstream services. These status code available per service and across all services.
+
+    Attributes:
+
+    | Name         | Description         |
+    | -------------| --------------------|
+    | code         | The HTTP status code returned by the upstream service. |
+    | route        | The `route_id` of the matched route is request. If it does not match, the default value is an empty string. |
+    | matched_uri  | The `uri` of the route matching the request, if it does not match, the default value is an empty string. |
+    | matched_host | The `host` of the route that matches the request. If it does not match, the default value is an empty string. |
+    | service      | The `service_id` of the route matched by the request. When the route lacks service_id, the default is `$host`. |
+    | consumer     | The `consumer_name` of the consumer that matches the request. If it does not match, the default value is an empty string. |
+    | node         | The `ip` of the upstream node. |
+
 * `Bandwidth`: Total Bandwidth (egress/ingress) flowing through apisix. This metric is available per service and as a sum across all services.
+
+    Attributes:
+
+    | Name         | Description |
+    | -------------| ------------- |
+    | type         | The type of bandwidth(egress/ingress). |
+    | route        | The `route_id` of the matched route is request. If it does not match, the default value is an empty string.. |
+    | service      | The `service_id` of the route matched by the request. When the route lacks service_id, the default is `$host`. |
+    | consumer     | The `consumer_name` of the consumer that matches the request. If it does not match, the default value is an empty string. |
+    | node         | The `ip` of the upstream node. |
+
 * `etcd reachability`: A gauge type with a value of 0 or 1, representing if etcd can be reached by a apisix or not.
 * `Connections`: Various Nginx connection metrics like active, reading, writing, and number of accepted connections.
 * `Batch process entries`: A gauge type, when we use plugins and the plugin used batch process to send data, such as: sys logger, http logger, sls logger, tcp logger, udp logger and zipkin, then the entries which hasn't been sent in batch process will be counted in the metrics.
 * `Latency`: The per service histogram of request time and the overhead added by APISIX (request time - upstream response time).
+
+    Attributes:
+
+    | Name      | Description |
+    | ----------| ------------- |
+    | type      | The type of request. |

Review comment:
       updated.


----------------------------------------------------------------
This is an automated message from the Apache Git Service.
To respond to the message, please log on to GitHub and use the
URL above to go to the specific comment.

For queries about this service, please contact Infrastructure at:
users@infra.apache.org
[GitHub] [apisix] spacewander merged pull request #3494: docs: update the docs of the prometheus plugin
Posted by GitBox <gi...@apache.org>.
spacewander merged pull request #3494:
URL: https://github.com/apache/apisix/pull/3494


--
This is an automated message from the Apache Git Service.
To respond to the message, please log on to GitHub and use the
URL above to go to the specific comment.

For queries about this service, please contact Infrastructure at:
users@infra.apache.org
[GitHub] [apisix] juzhiyuan commented on a change in pull request #3494: docs: update the docs of the prometheus plugin
Posted by GitBox <gi...@apache.org>.
juzhiyuan commented on a change in pull request #3494:
URL: https://github.com/apache/apisix/pull/3494#discussion_r580219629
##########
File path: doc/plugins/prometheus.md
##########
@@ -122,12 +122,56 @@ Or you can goto [Grafana official](https://grafana.com/grafana/dashboards/11719)
### Available metrics
-* `Status codes`: HTTP status codes returned by upstream services. These are available per service and across all services.
+* `Status`: HTTP status codes returned by upstream services. These are available per service and across all services.
Review comment:
```suggestion
* `Status`: HTTP status code returned from upstream services. These are available per service and across all services.
```
##########
File path: doc/plugins/prometheus.md
##########
@@ -122,12 +122,56 @@ Or you can goto [Grafana official](https://grafana.com/grafana/dashboards/11719)
### Available metrics
-* `Status codes`: HTTP status codes returned by upstream services. These are available per service and across all services.
+* `Status`: HTTP status codes returned by upstream services. These are available per service and across all services.
+
+ Attributes:
+
+ | Name | Description |
+ | -------------| --------------------|
+ | code | The HTTP status code returned by the upstream service. |
+ | route | The `route_id` of the matched route is requested. If it does not match, the default value is an empty string. |
Review comment:
> The `route_id` of the matched route is requested
requested?
##########
File path: doc/plugins/prometheus.md
##########
@@ -122,12 +122,56 @@ Or you can goto [Grafana official](https://grafana.com/grafana/dashboards/11719)
### Available metrics
-* `Status codes`: HTTP status codes returned by upstream services. These are available per service and across all services.
+* `Status`: HTTP status codes returned by upstream services. These are available per service and across all services.
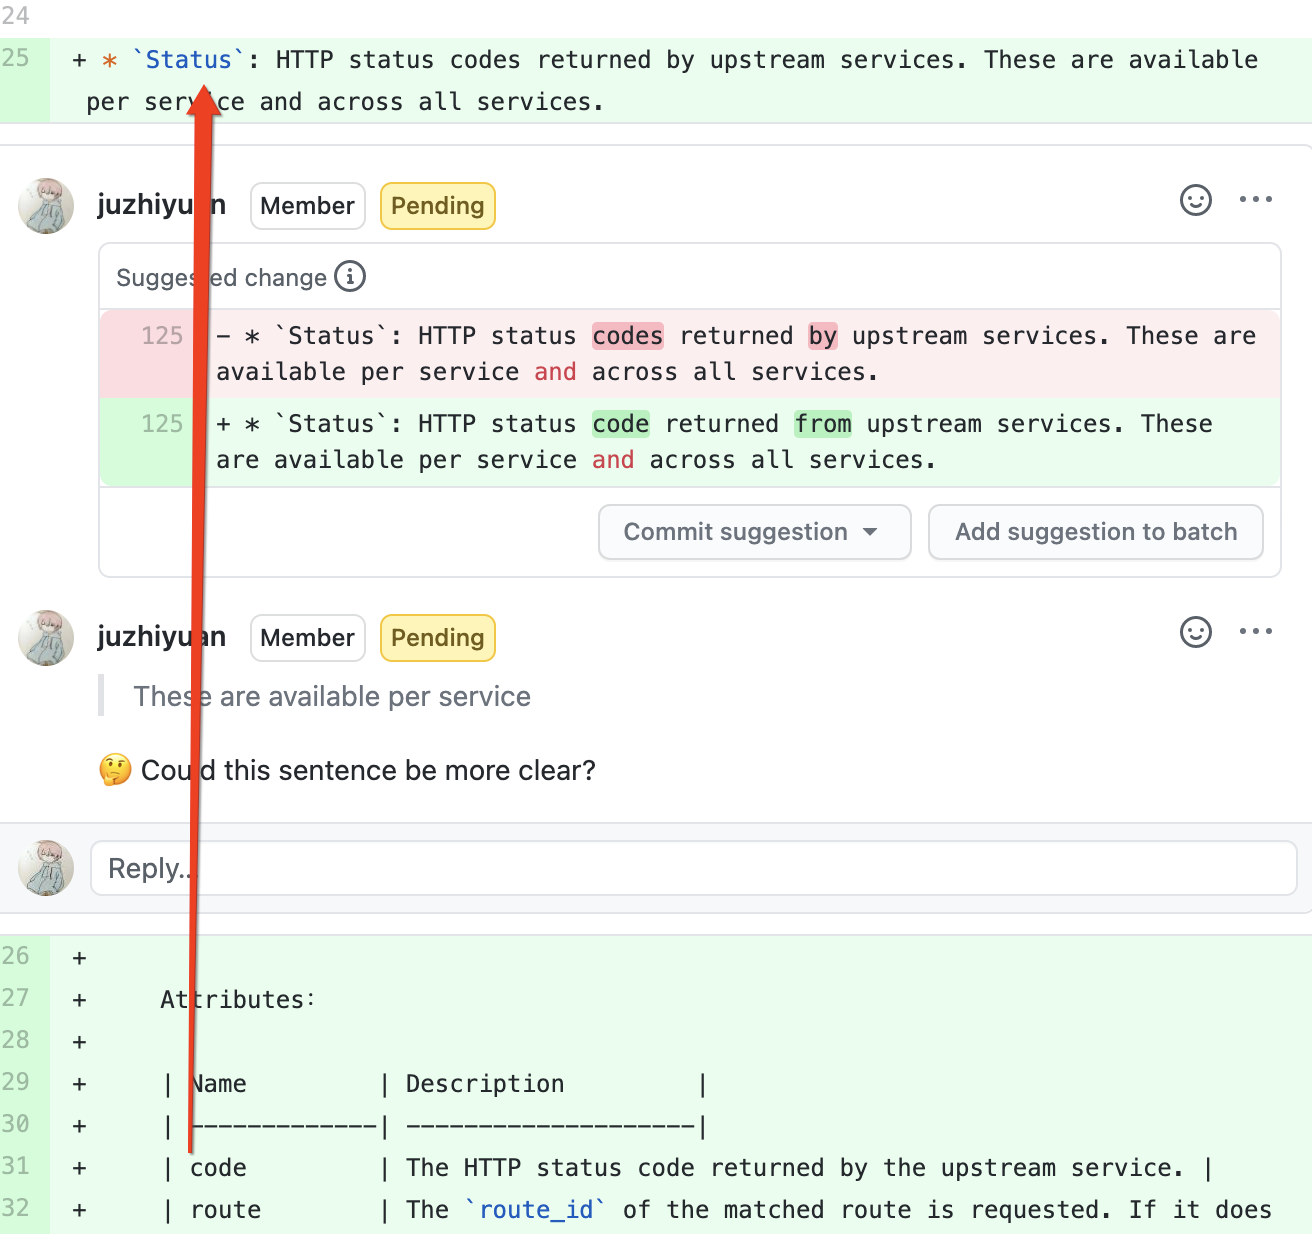
Review comment:
> These are available per service
🤔 Could this sentence be more clear?
##########
File path: doc/plugins/prometheus.md
##########
@@ -122,12 +122,56 @@ Or you can goto [Grafana official](https://grafana.com/grafana/dashboards/11719)
### Available metrics
-* `Status codes`: HTTP status codes returned by upstream services. These are available per service and across all services.
+* `Status`: HTTP status codes returned by upstream services. These are available per service and across all services.
+
+ Attributes:
+
+ | Name | Description |
+ | -------------| --------------------|
+ | code | The HTTP status code returned by the upstream service. |
Review comment:
Status or Code?
----------------------------------------------------------------
This is an automated message from the Apache Git Service.
To respond to the message, please log on to GitHub and use the
URL above to go to the specific comment.
For queries about this service, please contact Infrastructure at:
users@infra.apache.org
[GitHub] [apisix] Firstsawyou commented on a change in pull request #3494: docs: update the docs of the prometheus plugin
Posted by GitBox <gi...@apache.org>.
Firstsawyou commented on a change in pull request #3494:
URL: https://github.com/apache/apisix/pull/3494#discussion_r580272229


##########
File path: doc/plugins/prometheus.md
##########
@@ -122,12 +122,56 @@ Or you can goto [Grafana official](https://grafana.com/grafana/dashboards/11719)

 ### Available metrics

-* `Status codes`: HTTP status codes returned by upstream services. These are available per service and across all services.
+* `Status`: HTTP status codes returned by upstream services. These are available per service and across all services.
+
+    Attributes:
+
+    | Name         | Description         |
+    | -------------| --------------------|
+    | code         | The HTTP status code returned by the upstream service. |
+    | route        | The `route_id` of the matched route is requested. If it does not match, the default value is an empty string. |

Review comment:
       updated.


----------------------------------------------------------------
This is an automated message from the Apache Git Service.
To respond to the message, please log on to GitHub and use the
URL above to go to the specific comment.

For queries about this service, please contact Infrastructure at:
users@infra.apache.org
[GitHub] [apisix] spacewander commented on a change in pull request #3494: docs: update the docs of the prometheus plugin
Posted by GitBox <gi...@apache.org>.
spacewander commented on a change in pull request #3494:
URL: https://github.com/apache/apisix/pull/3494#discussion_r568495637


##########
File path: doc/plugins/prometheus.md
##########
@@ -122,12 +122,56 @@ Or you can goto [Grafana official](https://grafana.com/grafana/dashboards/11719)

 ### Available metrics

-* `Status codes`: HTTP status codes returned by upstream services. These are available per service and across all services.
+* `Status`: HTTP status codes returned by upstream services. These are available per service and across all services.
+
+    Attributes:
+
+    | Name         | Description         |
+    | -------------| --------------------|
+    | code         | The HTTP status code returned by the upstream service. |
+    | route        | The route_id of the request to match the route. If it does not match, the default is `""`. |
+    | matched_uri  | Request to match the uri of the route. If it does not match, the default is `""`. |
+    | matched_host | Request to match the hsot of the route. If it does not match, the default is `""`. |
+    | service      | The request matches the service_id of the route. If it does not match, the default is host. |
+    | consumer     | The request matches the consumer_name of the consumer. If it does not match, the default is `""`. |
+    | node         | The request hits the ip of the upstream node. |
+
 * `Bandwidth`: Total Bandwidth (egress/ingress) flowing through apisix. This metric is available per service and as a sum across all services.
+
+    Attributes:
+
+    | Name         | Description |
+    | -------------| ------------- |
+    | type         | The type of bandwidth(egress/ingress). |
+    | route        | The route_id of the request to match the route. If it does not match, the default is `""`. |
+    | service      | The request matches the service_id of the route. If it does not match, the default is host. |
+    | consumer     | The request matches the consumer_name of the consumer. If it does not match, the default is `""`. |
+    | node         | The request hits the ip of the upstream node. |

Review comment:
       The subject should be the `ip`, not `the request`.

##########
File path: doc/plugins/prometheus.md
##########
@@ -122,12 +122,56 @@ Or you can goto [Grafana official](https://grafana.com/grafana/dashboards/11719)

 ### Available metrics

-* `Status codes`: HTTP status codes returned by upstream services. These are available per service and across all services.
+* `Status`: HTTP status codes returned by upstream services. These are available per service and across all services.
+
+    Attributes:
+
+    | Name         | Description         |
+    | -------------| --------------------|
+    | code         | The HTTP status code returned by the upstream service. |
+    | route        | The route_id of the request to match the route. If it does not match, the default is `""`. |
+    | matched_uri  | Request to match the uri of the route. If it does not match, the default is `""`. |
+    | matched_host | Request to match the hsot of the route. If it does not match, the default is `""`. |
+    | service      | The request matches the service_id of the route. If it does not match, the default is host. |

Review comment:
       "host" should be `$host`? And we use the default value not because "it does not match", but because there is no service id of the matched route.

##########
File path: doc/plugins/prometheus.md
##########
@@ -122,12 +122,56 @@ Or you can goto [Grafana official](https://grafana.com/grafana/dashboards/11719)

 ### Available metrics

-* `Status codes`: HTTP status codes returned by upstream services. These are available per service and across all services.
+* `Status`: HTTP status codes returned by upstream services. These are available per service and across all services.
+
+    Attributes:
+
+    | Name         | Description         |
+    | -------------| --------------------|
+    | code         | The HTTP status code returned by the upstream service. |
+    | route        | The route_id of the request to match the route. If it does not match, the default is `""`. |
+    | matched_uri  | Request to match the uri of the route. If it does not match, the default is `""`. |
+    | matched_host | Request to match the hsot of the route. If it does not match, the default is `""`. |
+    | service      | The request matches the service_id of the route. If it does not match, the default is host. |
+    | consumer     | The request matches the consumer_name of the consumer. If it does not match, the default is `""`. |
+    | node         | The request hits the ip of the upstream node. |
+
 * `Bandwidth`: Total Bandwidth (egress/ingress) flowing through apisix. This metric is available per service and as a sum across all services.
+
+    Attributes:
+
+    | Name         | Description |
+    | -------------| ------------- |
+    | type         | The type of bandwidth(egress/ingress). |
+    | route        | The route_id of the request to match the route. If it does not match, the default is `""`. |
+    | service      | The request matches the service_id of the route. If it does not match, the default is host. |

Review comment:
       The service_id of the route matched by the request?


----------------------------------------------------------------
This is an automated message from the Apache Git Service.
To respond to the message, please log on to GitHub and use the
URL above to go to the specific comment.

For queries about this service, please contact Infrastructure at:
users@infra.apache.org
[GitHub] [apisix] membphis commented on pull request #3494: docs: update the docs of the prometheus plugin
Posted by GitBox <gi...@apache.org>.
membphis commented on pull request #3494:
URL: https://github.com/apache/apisix/pull/3494#issuecomment-787065480


   > The Chinese and English documents are written not good that they can’t be merged

   ok, got it.


----------------------------------------------------------------
This is an automated message from the Apache Git Service.
To respond to the message, please log on to GitHub and use the
URL above to go to the specific comment.

For queries about this service, please contact Infrastructure at:
users@infra.apache.org
[GitHub] [apisix] moonming commented on a change in pull request #3494: docs: update the docs of the prometheus plugin
Posted by GitBox <gi...@apache.org>.
moonming commented on a change in pull request #3494:
URL: https://github.com/apache/apisix/pull/3494#discussion_r603773164


##########
File path: docs/en/latest/plugins/prometheus.md
##########
@@ -122,26 +122,70 @@ Or you can goto [Grafana official](https://grafana.com/grafana/dashboards/11719)

 ### Available metrics

-* `Status codes`: HTTP status codes returned by upstream services. These are available per service and across all services.
-* `Bandwidth`: Total Bandwidth (egress/ingress) flowing through apisix. This metric is available per service and as a sum across all services.
-* `etcd reachability`: A gauge type with a value of 0 or 1, representing if etcd can be reached by a apisix or not.
+* `Status codes`: HTTP status code returned from upstream services. These status code available per service and across all services.
+
+    Attributes:
+
+    | Name         | Description         |
+    | -------------| --------------------|
+    | code         | The HTTP status code returned by the upstream service. |
+    | route        | The `route_id` of the matched route is request. If it does not match, the default value is an empty string. |
+    | matched_uri  | The `uri` of the route matching the request, if it does not match, the default value is an empty string. |
+    | matched_host | The `host` of the route that matches the request. If it does not match, the default value is an empty string. |
+    | service      | The `service_id` of the route matched by the request. When the route lacks service_id, the default is `$host`. |
+    | consumer     | The `consumer_name` of the consumer that matches the request. If it does not match, the default value is an empty string. |
+    | node         | The `ip` of the upstream node. |
+
+* `Bandwidth`: Total Bandwidth (egress/ingress) flowing through apisix. The total bandwidth of each service or all services can be counted.

Review comment:
       `apisix` -> `APISIX`

##########
File path: docs/en/latest/plugins/prometheus.md
##########
@@ -122,26 +122,70 @@ Or you can goto [Grafana official](https://grafana.com/grafana/dashboards/11719)

 ### Available metrics

-* `Status codes`: HTTP status codes returned by upstream services. These are available per service and across all services.
-* `Bandwidth`: Total Bandwidth (egress/ingress) flowing through apisix. This metric is available per service and as a sum across all services.
-* `etcd reachability`: A gauge type with a value of 0 or 1, representing if etcd can be reached by a apisix or not.
+* `Status codes`: HTTP status code returned from upstream services. These status code available per service and across all services.
+
+    Attributes:
+
+    | Name         | Description         |
+    | -------------| --------------------|
+    | code         | The HTTP status code returned by the upstream service. |
+    | route        | The `route_id` of the matched route is request. If it does not match, the default value is an empty string. |
+    | matched_uri  | The `uri` of the route matching the request, if it does not match, the default value is an empty string. |
+    | matched_host | The `host` of the route that matches the request. If it does not match, the default value is an empty string. |
+    | service      | The `service_id` of the route matched by the request. When the route lacks service_id, the default is `$host`. |

Review comment:
       how to config `all services`?


--
This is an automated message from the Apache Git Service.
To respond to the message, please log on to GitHub and use the
URL above to go to the specific comment.

For queries about this service, please contact Infrastructure at:
users@infra.apache.org
[GitHub] [apisix] moonming commented on a change in pull request #3494: docs: update the docs of the prometheus plugin
Posted by GitBox <gi...@apache.org>.
moonming commented on a change in pull request #3494:
URL: https://github.com/apache/apisix/pull/3494#discussion_r568716755


##########
File path: doc/zh-cn/plugins/prometheus.md
##########
@@ -120,12 +120,49 @@ plugin_attr:

 ### 可有的指标

-* `Status codes`: upstream 服务返回的 HTTP 状态码,每个服务返回状态码的次数或者所有服务的状态码次数总和都可以统计到。
-* `Bandwidth`: 流经apisix的总带宽(可分出口带宽和入口带宽). 每个服务指标或者是所有服务指标的总和都可以统计到。
+* `Status`: upstream 服务返回的 HTTP 状态码,每个服务返回状态码的次数或者所有服务的状态码次数总和都可以统计到。具有的维度:
+
+    | 名称          |    描述             |
+    | -------------| --------------------|
+    | code         | upstream 服务返回的 HTTP 状态码。 |
+    | route        | 请求匹配的 route 的 `route_id`,未匹配,则默认为`""`。 |

Review comment:
       the default value is empyy string or what else?


----------------------------------------------------------------
This is an automated message from the Apache Git Service.
To respond to the message, please log on to GitHub and use the
URL above to go to the specific comment.

For queries about this service, please contact Infrastructure at:
users@infra.apache.org
[GitHub] [apisix] moonming commented on a change in pull request #3494: docs: update the docs of the prometheus plugin
Posted by GitBox <gi...@apache.org>.
moonming commented on a change in pull request #3494:
URL: https://github.com/apache/apisix/pull/3494#discussion_r583421624


##########
File path: docs/zh/latest/plugins/prometheus.md
##########
@@ -118,12 +118,49 @@ plugin_attr:

 ### 可有的指标

-* `Status codes`: upstream 服务返回的 HTTP 状态码,每个服务返回状态码的次数或者所有服务的状态码次数总和都可以统计到。
-* `Bandwidth`: 流经apisix的总带宽(可分出口带宽和入口带宽). 每个服务指标或者是所有服务指标的总和都可以统计到。
+* `Status codes`: upstream 服务返回的 HTTP 状态码,每个服务返回状态码的次数或者所有服务的状态码次数总和都可以统计到。具有的维度:

Review comment:
       the doc is ready hard to read.


----------------------------------------------------------------
This is an automated message from the Apache Git Service.
To respond to the message, please log on to GitHub and use the
URL above to go to the specific comment.

For queries about this service, please contact Infrastructure at:
users@infra.apache.org
[GitHub] [apisix] tokers commented on a change in pull request #3494: docs: update the docs of the prometheus plugin
Posted by GitBox <gi...@apache.org>.
tokers commented on a change in pull request #3494:
URL: https://github.com/apache/apisix/pull/3494#discussion_r582794663


##########
File path: docs/en/latest/plugins/prometheus.md
##########
@@ -120,12 +120,56 @@ Or you can goto [Grafana official](https://grafana.com/grafana/dashboards/11719)

 ### Available metrics

-* `Status codes`: HTTP status codes returned by upstream services. These are available per service and across all services.
+* `Status codes`: HTTP status code returned from upstream services. These status code available per service and across all services.
+
+    Attributes:
+
+    | Name         | Description         |
+    | -------------| --------------------|
+    | code         | The HTTP status code returned by the upstream service. |
+    | route        | The `route_id` of the matched route is request. If it does not match, the default value is an empty string. |
+    | matched_uri  | The `uri` of the route matching the request, if it does not match, the default value is an empty string. |
+    | matched_host | The `host` of the route that matches the request. If it does not match, the default value is an empty string. |
+    | service      | The `service_id` of the route matched by the request. When the route lacks service_id, the default is `$host`. |
+    | consumer     | The `consumer_name` of the consumer that matches the request. If it does not match, the default value is an empty string. |
+    | node         | The `ip` of the upstream node. |
+
 * `Bandwidth`: Total Bandwidth (egress/ingress) flowing through apisix. This metric is available per service and as a sum across all services.
+
+    Attributes:
+
+    | Name         | Description |
+    | -------------| ------------- |
+    | type         | The type of bandwidth(egress/ingress). |
+    | route        | The `route_id` of the matched route is request. If it does not match, the default value is an empty string.. |
+    | service      | The `service_id` of the route matched by the request. When the route lacks service_id, the default is `$host`. |
+    | consumer     | The `consumer_name` of the consumer that matches the request. If it does not match, the default value is an empty string. |
+    | node         | The `ip` of the upstream node. |
+
 * `etcd reachability`: A gauge type with a value of 0 or 1, representing if etcd can be reached by a apisix or not.
 * `Connections`: Various Nginx connection metrics like active, reading, writing, and number of accepted connections.
 * `Batch process entries`: A gauge type, when we use plugins and the plugin used batch process to send data, such as: sys logger, http logger, sls logger, tcp logger, udp logger and zipkin, then the entries which hasn't been sent in batch process will be counted in the metrics.
 * `Latency`: The per service histogram of request time and the overhead added by APISIX (request time - upstream response time).
+
+    Attributes:
+
+    | Name      | Description |
+    | ----------| ------------- |
+    | type      | The type of request. |

Review comment:
       What is the type of request? It's hard to understand.


----------------------------------------------------------------
This is an automated message from the Apache Git Service.
To respond to the message, please log on to GitHub and use the
URL above to go to the specific comment.

For queries about this service, please contact Infrastructure at:
users@infra.apache.org
[GitHub] [apisix] Firstsawyou commented on pull request #3494: docs: update the docs of the prometheus plugin
Posted by GitBox <gi...@apache.org>.
Firstsawyou commented on pull request #3494:
URL: https://github.com/apache/apisix/pull/3494#issuecomment-787683233


   > The Chinese and English documents are written not good that they can’t be merged

   updated.


----------------------------------------------------------------
This is an automated message from the Apache Git Service.
To respond to the message, please log on to GitHub and use the
URL above to go to the specific comment.

For queries about this service, please contact Infrastructure at:
users@infra.apache.org
[GitHub] [apisix] Firstsawyou commented on a change in pull request #3494: docs: update the docs of the prometheus plugin
Posted by GitBox <gi...@apache.org>.
Firstsawyou commented on a change in pull request #3494:
URL: https://github.com/apache/apisix/pull/3494#discussion_r568724325


##########
File path: doc/zh-cn/plugins/prometheus.md
##########
@@ -120,12 +120,49 @@ plugin_attr:

 ### 可有的指标

-* `Status codes`: upstream 服务返回的 HTTP 状态码,每个服务返回状态码的次数或者所有服务的状态码次数总和都可以统计到。
-* `Bandwidth`: 流经apisix的总带宽(可分出口带宽和入口带宽). 每个服务指标或者是所有服务指标的总和都可以统计到。
+* `Status`: upstream 服务返回的 HTTP 状态码,每个服务返回状态码的次数或者所有服务的状态码次数总和都可以统计到。具有的维度:
+
+    | 名称          |    描述             |
+    | -------------| --------------------|
+    | code         | upstream 服务返回的 HTTP 状态码。 |
+    | route        | 请求匹配的 route 的 `route_id`,未匹配,则默认为`""`。 |

Review comment:
       Yes, in the case of no matching route, the default value is an empty string.

   like this:

   ```
   apisix_http_status{code="404",route="",matched_uri="",matched_host="",service="127.0.0.1",consumer="",node=""} 1
   ```


----------------------------------------------------------------
This is an automated message from the Apache Git Service.
To respond to the message, please log on to GitHub and use the
URL above to go to the specific comment.

For queries about this service, please contact Infrastructure at:
users@infra.apache.org
[GitHub] [apisix] Firstsawyou commented on pull request #3494: docs: update the docs of the prometheus plugin
Posted by GitBox <gi...@apache.org>.
Firstsawyou commented on pull request #3494:
URL: https://github.com/apache/apisix/pull/3494#issuecomment-782598361


   > you are not modify the doc.

   updated.


----------------------------------------------------------------
This is an automated message from the Apache Git Service.
To respond to the message, please log on to GitHub and use the
URL above to go to the specific comment.

For queries about this service, please contact Infrastructure at:
users@infra.apache.org