You are viewing a plain text version of this content. The canonical link for it is here.
Posted to notifications@skywalking.apache.org by GitBox <gi...@apache.org> on 2022/10/02 06:07:26 UTC
[GitHub] [skywalking] pg-yang opened a new pull request, #9725: Add APISIX metrics monitoring
pg-yang opened a new pull request, #9725:
URL: https://github.com/apache/skywalking/pull/9725

   <!--
       ⚠️ Please make sure to read this template first, pull requests that don't accord with this template
       maybe closed without notice.
       Texts surrounded by `<` and `>` are meant to be replaced by you, e.g. <framework name>, <issue number>.
       Put an `x` in the `[ ]` to mark the item as CHECKED. `[x]`
   -->

   <!-- ==== 🐛 Remove this line WHEN AND ONLY WHEN you're fixing a bug, follow the checklist 👇 ====
   ### Fix <bug description or the bug issue number or bug issue link>
   - [ ] Add a unit test to verify that the fix works.
   - [ ] Explain briefly why the bug exists and how to fix it.
        ==== 🐛 Remove this line WHEN AND ONLY WHEN you're fixing a bug, follow the checklist 👆 ==== -->

   <!-- ==== 📈 Remove this line WHEN AND ONLY WHEN you're improving the performance, follow the checklist 👇 ====
   ### Improve the performance of <class or module or ...>
   - [ ] Add a benchmark for the improvement, refer to [the existing ones](https://github.com/apache/skywalking/blob/master/apm-commons/apm-datacarrier/src/test/java/org/apache/skywalking/apm/commons/datacarrier/LinkedArrayBenchmark.java)
   - [ ] The benchmark result.
   ```text
   <Paste the benchmark results here>
   ```
   - [ ] Links/URLs to the theory proof or discussion articles/blogs. <links/URLs here>
        ==== 📈 Remove this line WHEN AND ONLY WHEN you're improving the performance, follow the checklist 👆 ==== -->

   <!-- ==== 🆕 Remove this line WHEN AND ONLY WHEN you're adding a new feature, follow the checklist 👇 ====
   ### <Feature description>
   - [ ] If this is non-trivial feature, paste the links/URLs to the design doc.
   - [ ] Update the documentation to include this new feature.
   - [ ] Tests(including UT, IT, E2E) are added to verify the new feature.
   - [ ] If it's UI related, attach the screenshots below.
        ==== 🆕 Remove this line WHEN AND ONLY WHEN you're adding a new feature, follow the checklist 👆 ==== -->

   - [ ] If this pull request closes/resolves/fixes an existing issue, replace the issue number. Closes #<issue number>.
   - [ ] Update the [`CHANGES` log](https://github.com/apache/skywalking/blob/master/docs/en/changes/changes.md).

   Related https://github.com/apache/skywalking/issues/9677


--
This is an automated message from the Apache Git Service.
To respond to the message, please log on to GitHub and use the
URL above to go to the specific comment.

To unsubscribe, e-mail: notifications-unsubscribe@skywalking.apache.org

For queries about this service, please contact Infrastructure at:
users@infra.apache.org
[GitHub] [skywalking] pg-yang commented on pull request #9725: Add APISIX metrics monitoring
Posted by GitBox <gi...@apache.org>.
pg-yang commented on PR #9725:
URL: https://github.com/apache/skywalking/pull/9725#issuecomment-1265647837

   And  changing latency unit from ms to  nano-sec is not a good choice . because `OpenTelemetryMetricHandler` have already convert nano-sec to ms .

   https://github.com/apache/skywalking/blob/5ae4c125f8cbeb7c53fed4269ca110eeac9aa661/oap-server/server-receiver-plugin/otel-receiver-plugin/src/main/java/org/apache/skywalking/oap/server/receiver/otel/otlp/OpenTelemetryMetricHandler.java#L172-L179


--
This is an automated message from the Apache Git Service.
To respond to the message, please log on to GitHub and use the
URL above to go to the specific comment.

To unsubscribe, e-mail: notifications-unsubscribe@skywalking.apache.org

For queries about this service, please contact Infrastructure at:
users@infra.apache.org
[GitHub] [skywalking] wu-sheng commented on pull request #9725: Add APISIX metrics monitoring
Posted by GitBox <gi...@apache.org>.
wu-sheng commented on PR #9725:
URL: https://github.com/apache/skywalking/pull/9725#issuecomment-1265162348

   you could do
   1. Showing the no `route` as the `no route rule metrics`
   2. Is there any real case about no `node`? That seems a bug rather than a metric.
   3. You could aggregate all not-null route and node metrics as the global one.


--
This is an automated message from the Apache Git Service.
To respond to the message, please log on to GitHub and use the
URL above to go to the specific comment.

To unsubscribe, e-mail: notifications-unsubscribe@skywalking.apache.org

For queries about this service, please contact Infrastructure at:
users@infra.apache.org
[GitHub] [skywalking] wu-sheng commented on a diff in pull request #9725: Add APISIX metrics monitoring
Posted by GitBox <gi...@apache.org>.
wu-sheng commented on code in PR #9725:
URL: https://github.com/apache/skywalking/pull/9725#discussion_r985234041
##########
docs/en/setup/backend/backend-apisix-monitoring.md:
##########
@@ -0,0 +1,40 @@
+# APISIX monitoring
+## APISIX performance from `apisix prometheus plugin`
+SkyWalking leverages OpenTelemetry Collector to transfer the metrics to
+[OpenTelemetry receiver](opentelemetry-receiver.md) and into the [Meter System](./../../concepts-and-designs/meter.md).
+
+### Data flow
+1. [APXSIX prometheus plugin](https://apisix.apache.org/docs/apisix/plugins/prometheus/) collect metrics data from APSIX.
+2. OpenTelemetry Collector fetches metrics from [APXSIX prometheus plugin](https://apisix.apache.org/docs/apisix/plugins/prometheus/) via Prometheus Receiver and pushes metrics to SkyWalking OAP Server via the OpenCensus gRPC Exporter or OpenTelemetry gRPC exporter.
+3. The SkyWalking OAP Server parses the expression with [MAL](../../concepts-and-designs/mal.md) to filter/calculate/aggregate and store the results.
+
+### Set up
+1. Enable APISIX [APXSIX prometheus plugin](https://apisix.apache.org/docs/apisix/plugins/prometheus/) .
+2. Set up [OpenTelemetry Collector ](https://opentelemetry.io/docs/collector/getting-started/#docker). For details on Prometheus Receiver in OpenTelemetry Collector, refer to [here](../../../../test/e2e-v2/cases/apisix/otel-collector/otel-collector-config.yaml).
+3. Config SkyWalking [OpenTelemetry receiver](opentelemetry-receiver.md).
+
+### MySQL Monitoring
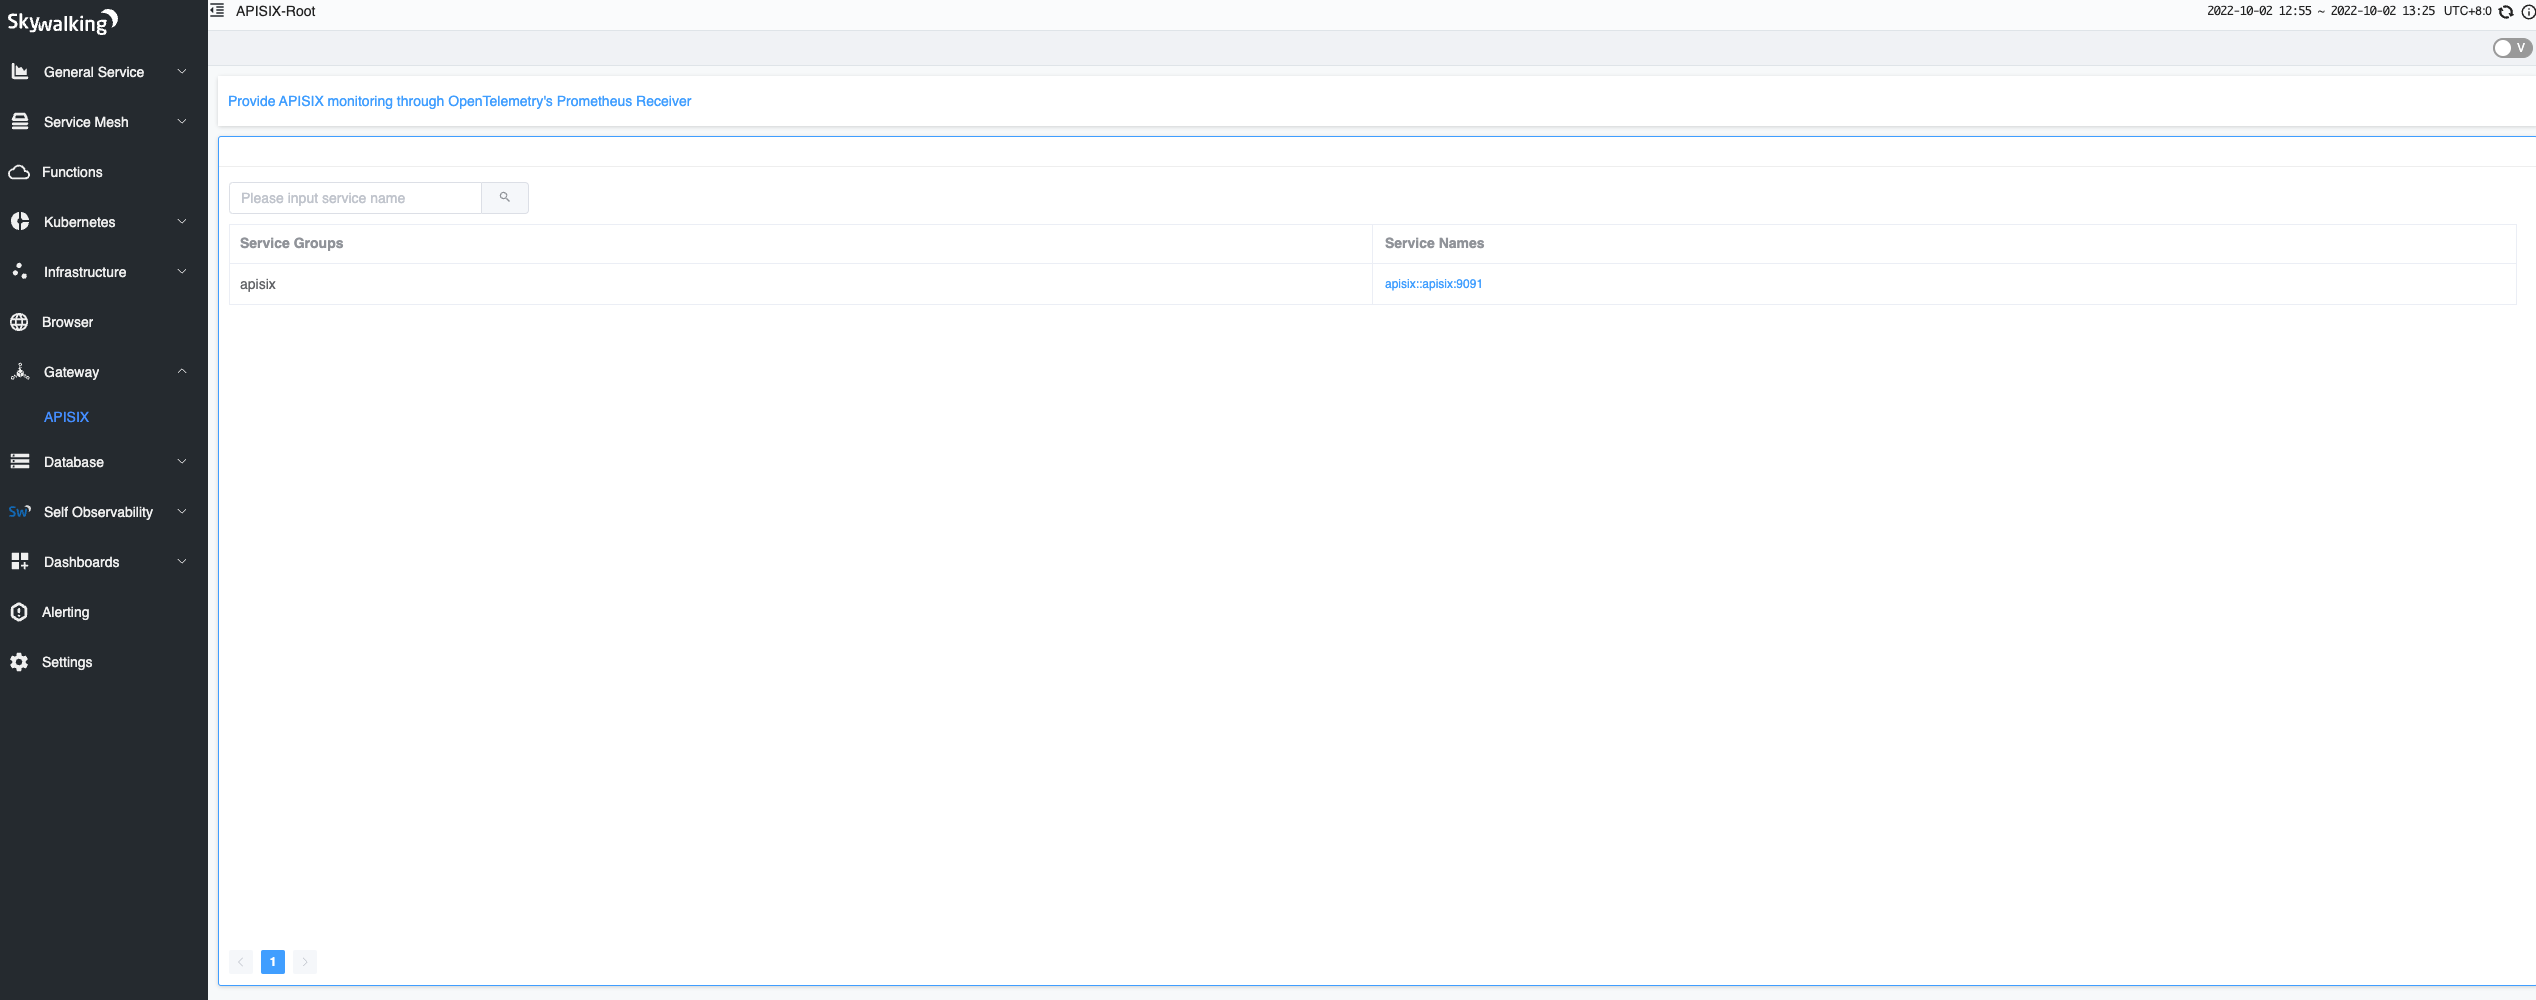
+[APXSIX prometheus plugin](https://apisix.apache.org/docs/apisix/plugins/prometheus/) provide multiple dimensions metrics for APISIX server , node , route , etc.
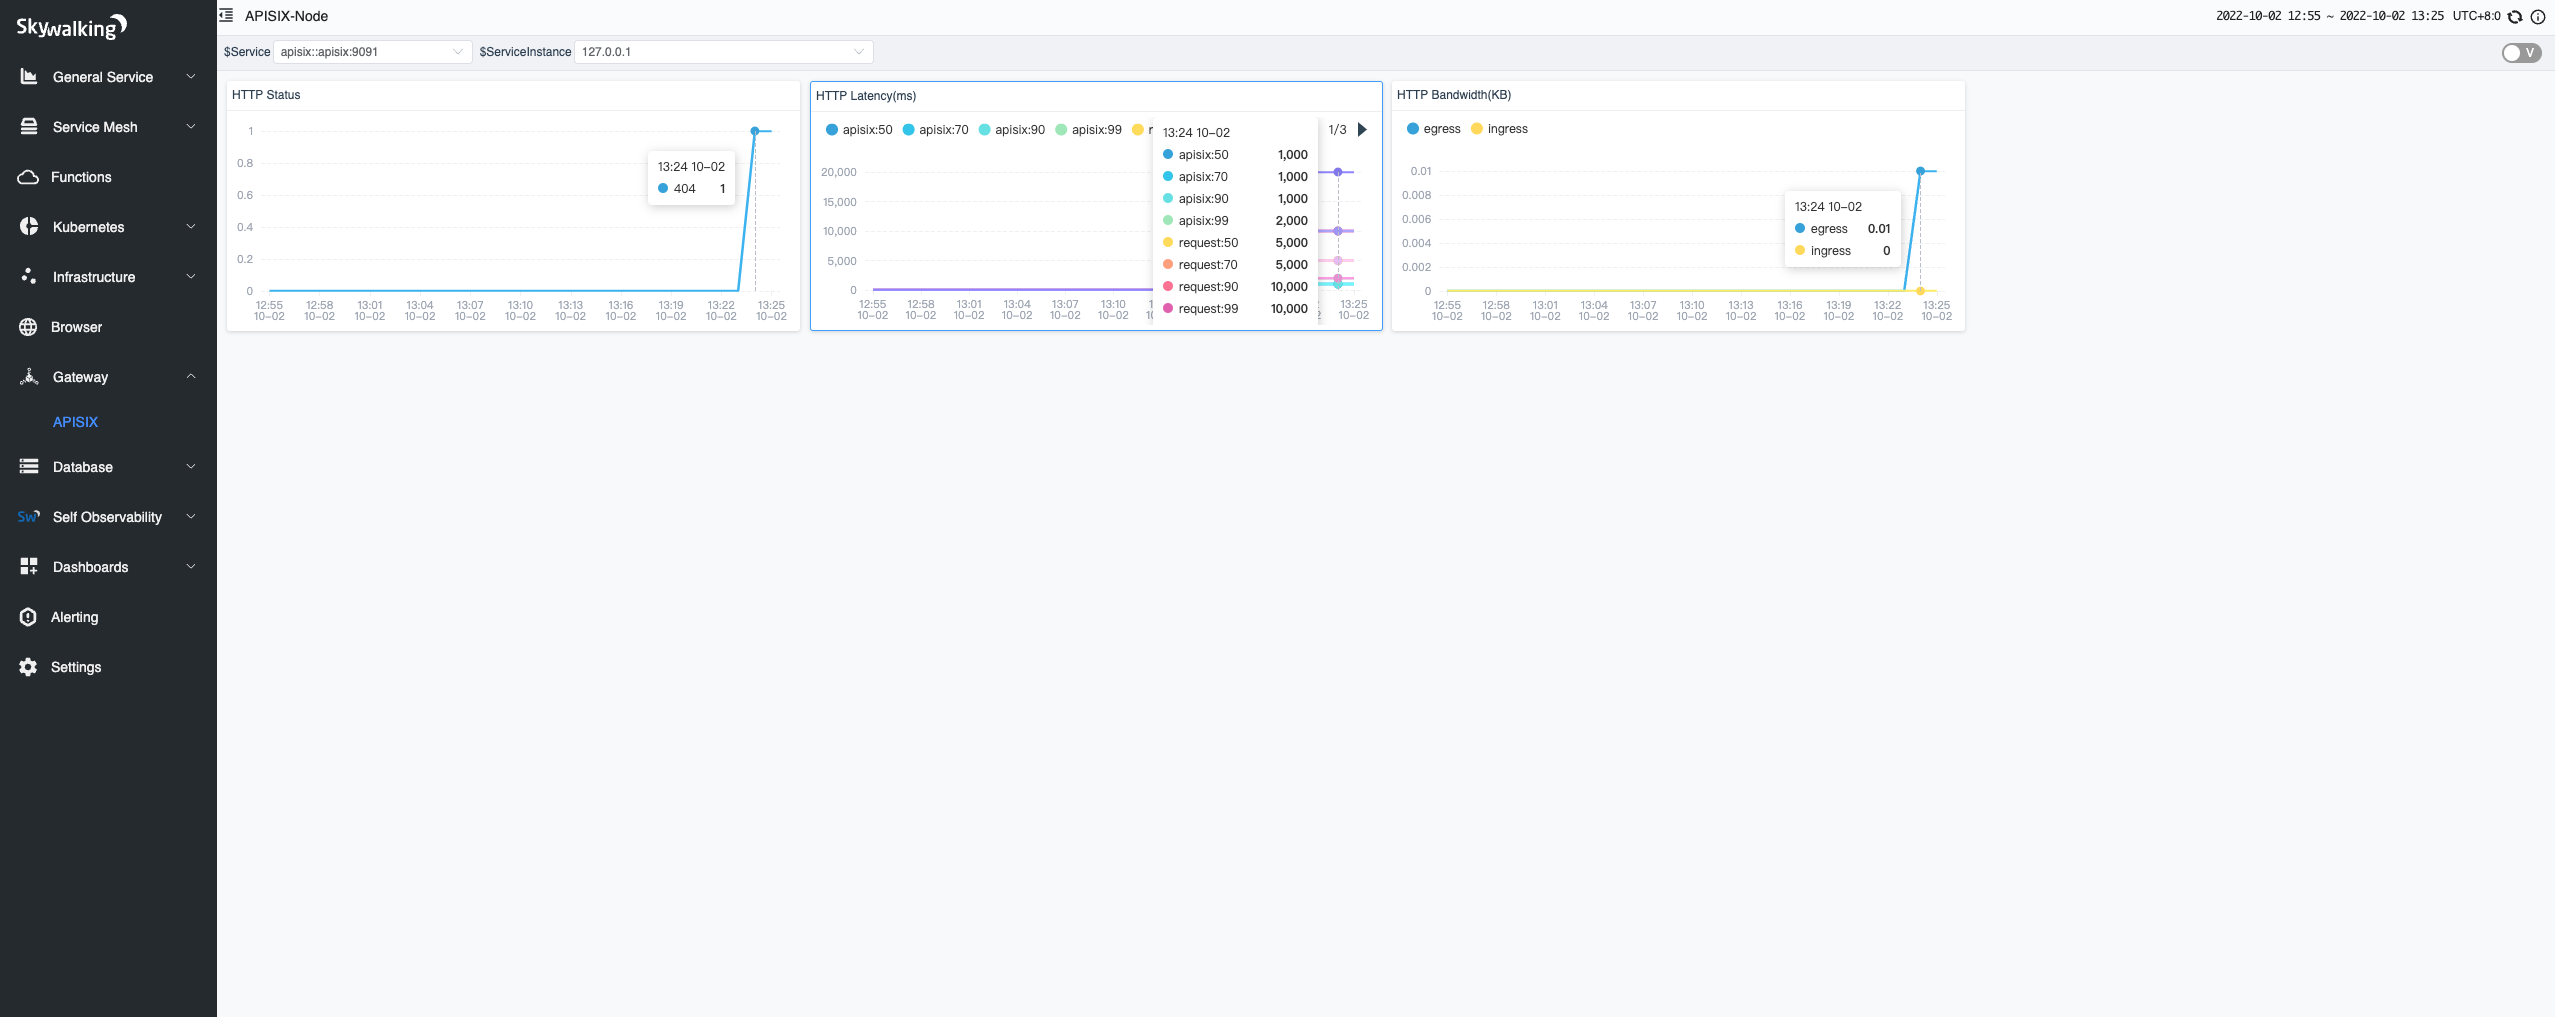
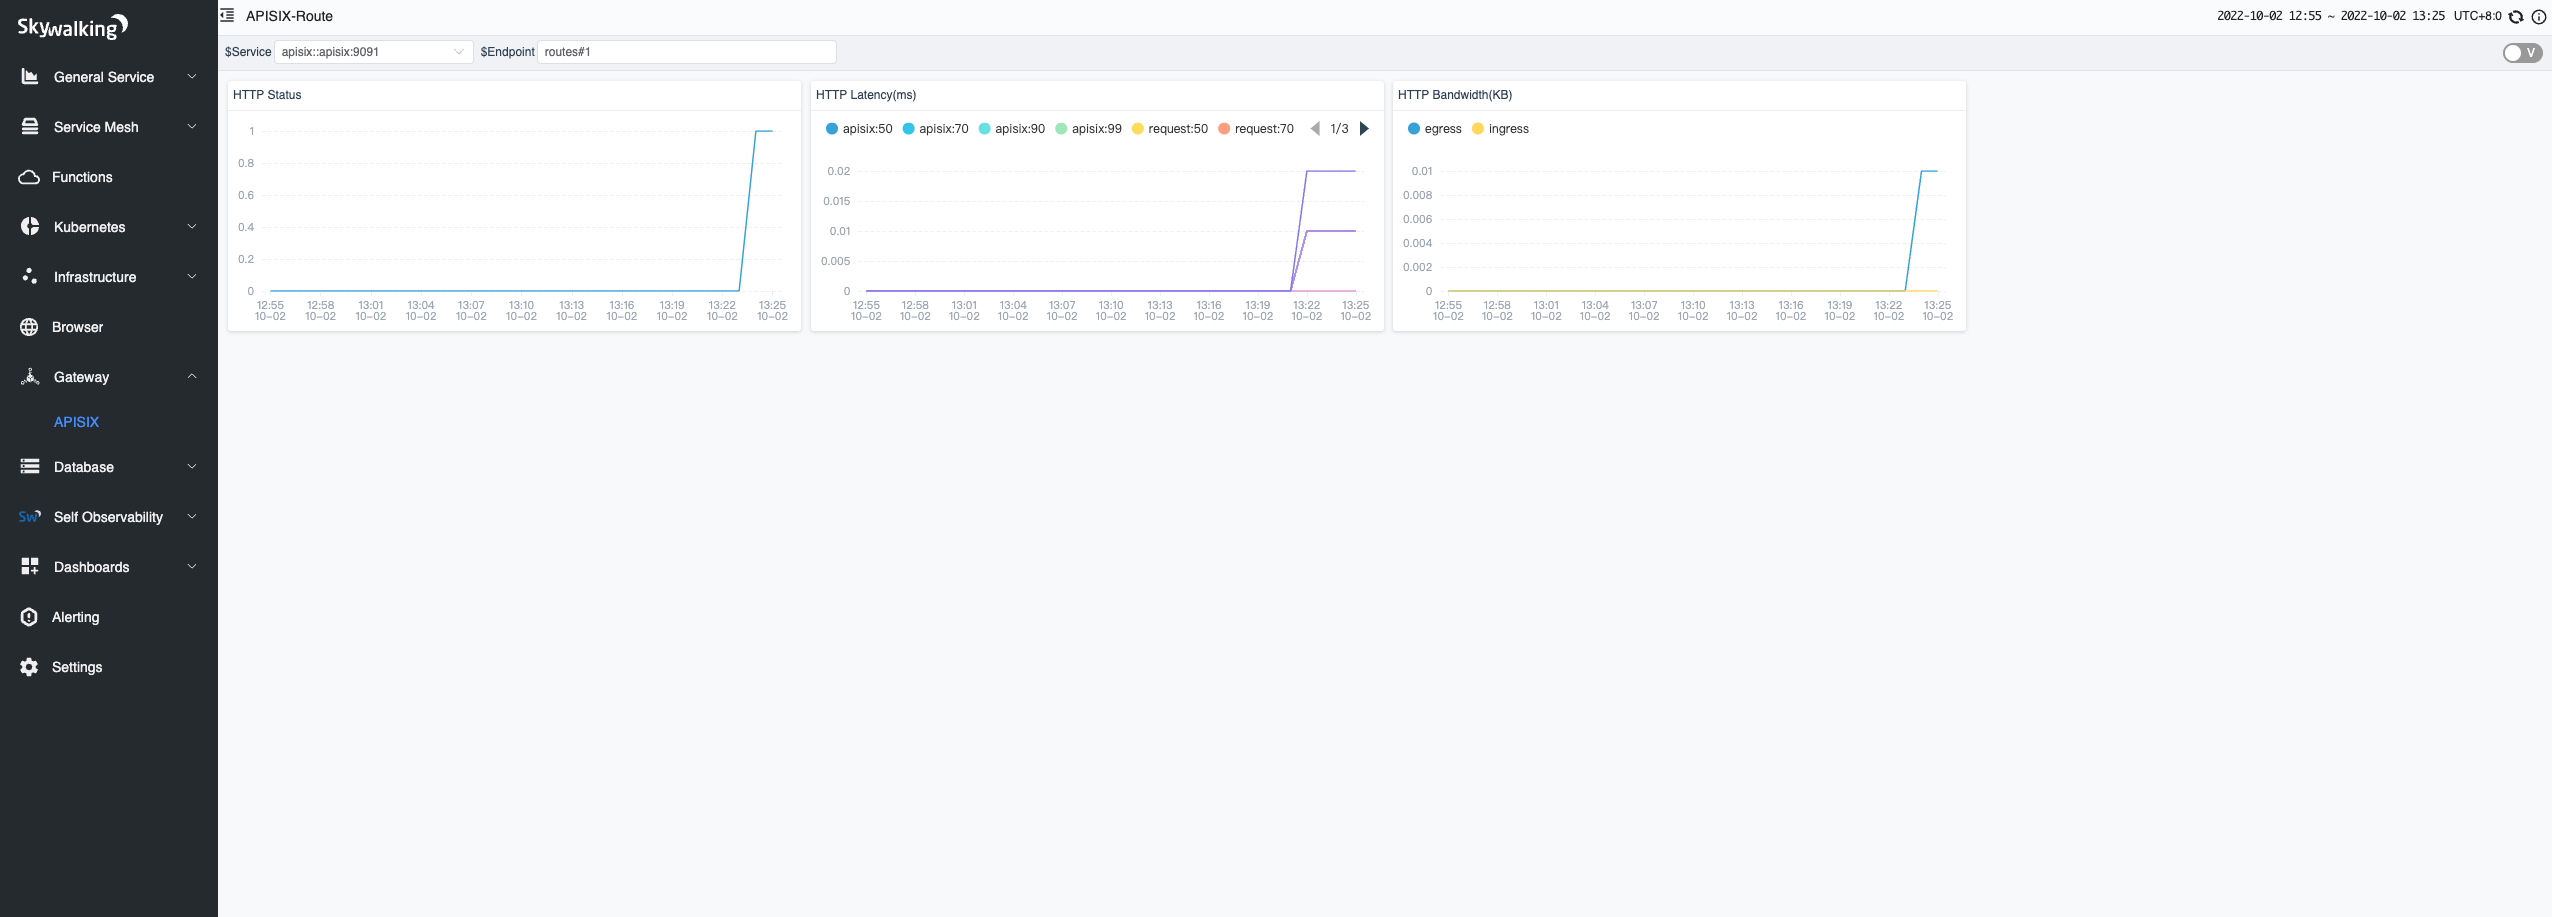
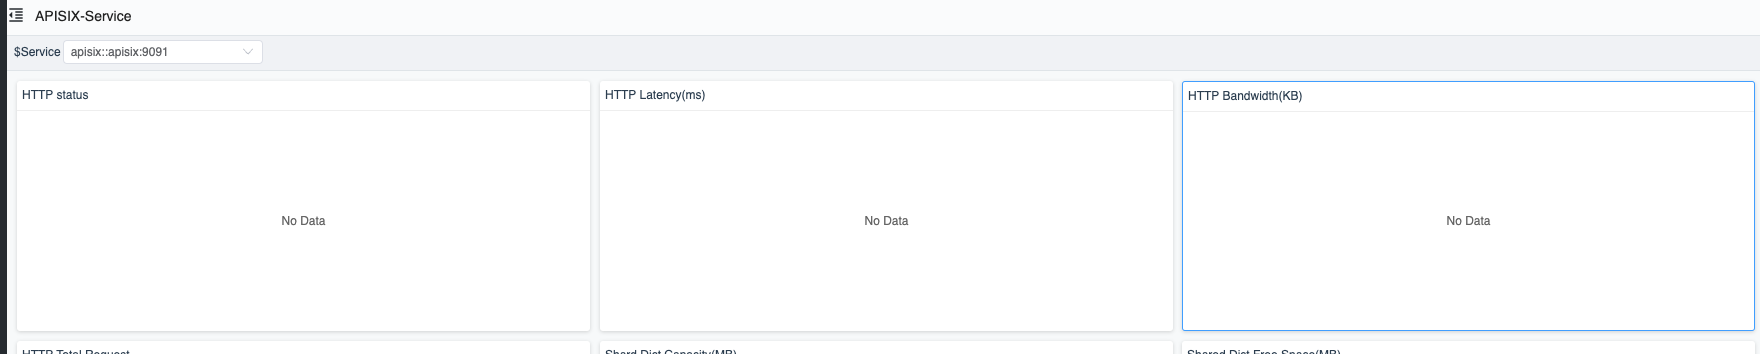
+Accordingly , Skywalking APISIX monitoring monitor status, resources through APISIX server , node, route aspects . APISIX server is cataloged as a `Layer: APISIX` `Service` in OAP, APISIX node as a `Layer: APISIX` `Instance `, and APISIX route as a `Layer: APISIX` `Endpoint`,
Review Comment:
```suggestion
Accordingly, Skywalking observes the status, payload, and latency of the APISIX server, which is cataloged as a `LAYER: APISIX` `Service` in the OAP. Meanwhile, the server node would be recognized as `instance, and the route rule would be recognized as `endpoint`.
```
--
This is an automated message from the Apache Git Service.
To respond to the message, please log on to GitHub and use the
URL above to go to the specific comment.
To unsubscribe, e-mail: notifications-unsubscribe@skywalking.apache.org
For queries about this service, please contact Infrastructure at:
users@infra.apache.org
[GitHub] [skywalking] wu-sheng commented on a diff in pull request #9725: Add APISIX metrics monitoring
Posted by GitBox <gi...@apache.org>.
wu-sheng commented on code in PR #9725:
URL: https://github.com/apache/skywalking/pull/9725#discussion_r985233371


##########
docs/en/setup/backend/backend-apisix-monitoring.md:
##########
@@ -0,0 +1,40 @@
+# APISIX monitoring
+## APISIX  performance from `apisix prometheus plugin`
+SkyWalking leverages OpenTelemetry Collector to transfer the metrics to
+[OpenTelemetry receiver](opentelemetry-receiver.md) and into the [Meter System](./../../concepts-and-designs/meter.md).
+
+### Data flow
+1. [APXSIX prometheus plugin](https://apisix.apache.org/docs/apisix/plugins/prometheus/) collect metrics data from APSIX.
+2. OpenTelemetry Collector fetches metrics from [APXSIX prometheus plugin](https://apisix.apache.org/docs/apisix/plugins/prometheus/) via Prometheus Receiver and pushes metrics to SkyWalking OAP Server via the OpenCensus gRPC Exporter or OpenTelemetry gRPC exporter.
+3. The SkyWalking OAP Server parses the expression with [MAL](../../concepts-and-designs/mal.md) to filter/calculate/aggregate and store the results.
+
+### Set up
+1. Enable APISIX [APXSIX prometheus plugin](https://apisix.apache.org/docs/apisix/plugins/prometheus/) .
+2. Set up [OpenTelemetry Collector ](https://opentelemetry.io/docs/collector/getting-started/#docker). For details on Prometheus Receiver in OpenTelemetry Collector, refer to [here](../../../../test/e2e-v2/cases/apisix/otel-collector/otel-collector-config.yaml).
+3. Config SkyWalking [OpenTelemetry receiver](opentelemetry-receiver.md).
+
+### MySQL Monitoring
+[APXSIX prometheus plugin](https://apisix.apache.org/docs/apisix/plugins/prometheus/) provide multiple dimensions metrics for APISIX server , node , route , etc.
+Accordingly , Skywalking APISIX monitoring monitor status, resources through APISIX server , node, route aspects . APISIX server is cataloged as a `Layer: APISIX` `Service` in OAP, APISIX node as a `Layer: APISIX` `Instance `, and APISIX route as a `Layer: APISIX` `Endpoint`,
+#### Supported Metrics

Review Comment:
   @gxthrj Could you verify the following metrics meanings of APISIX?


--
This is an automated message from the Apache Git Service.
To respond to the message, please log on to GitHub and use the
URL above to go to the specific comment.

To unsubscribe, e-mail: notifications-unsubscribe@skywalking.apache.org

For queries about this service, please contact Infrastructure at:
users@infra.apache.org
[GitHub] [skywalking] wankai123 commented on a diff in pull request #9725: Add APISIX metrics monitoring
Posted by GitBox <gi...@apache.org>.
wankai123 commented on code in PR #9725:
URL: https://github.com/apache/skywalking/pull/9725#discussion_r985259177


##########
oap-server/server-starter/src/main/resources/otel-rules/apisix.yaml:
##########
@@ -0,0 +1,68 @@
+# Licensed to the Apache Software Foundation (ASF) under one or more
+# contributor license agreements.  See the NOTICE file distributed with
+# this work for additional information regarding copyright ownership.
+# The ASF licenses this file to You under the Apache License, Version 2.0
+# (the "License"); you may not use this file except in compliance with
+# the License.  You may obtain a copy of the License at
+#
+#     http://www.apache.org/licenses/LICENSE-2.0
+#
+# Unless required by applicable law or agreed to in writing, software
+# distributed under the License is distributed on an "AS IS" BASIS,
+# WITHOUT WARRANTIES OR CONDITIONS OF ANY KIND, either express or implied.
+# See the License for the specific language governing permissions and
+# limitations under the License.
+
+# This will parse a textual representation of a duration. The formats
+# accepted are based on the ISO-8601 duration format {@code PnDTnHnMn.nS}
+# with days considered to be exactly 24 hours.
+# <p>
+# Examples:
+# <pre>
+#    "PT20.345S" -- parses as "20.345 seconds"
+#    "PT15M"     -- parses as "15 minutes" (where a minute is 60 seconds)
+#    "PT10H"     -- parses as "10 hours" (where an hour is 3600 seconds)
+#    "P2D"       -- parses as "2 days" (where a day is 24 hours or 86400 seconds)
+#    "P2DT3H4M"  -- parses as "2 days, 3 hours and 4 minutes"
+#    "P-6H3M"    -- parses as "-6 hours and +3 minutes"
+#    "-P6H3M"    -- parses as "-6 hours and -3 minutes"
+#    "-P-6H+3M"  -- parses as "+6 hours and -3 minutes"
+# </pre>
+filter: "{ tags -> tags.job_name == 'apisix-monitoring' }" # The OpenTelemetry job name
+expPrefix:  tag({tags -> tags.host_name = 'apisix::' + tags.service_instance_id})
+expSuffix:
+metricPrefix: meter_apisix
+metricsRules:
+  # apisix
+  - name: sv_http_connections
+    exp: apisix_nginx_http_current_connections.sum(['state','host_name']).service(['host_name'] , Layer.APISIX)
+  - name: shared_dict_capacity_bytes
+    exp: apisix_shared_dict_capacity_bytes.sum(['name','host_name']).service(['host_name'] , Layer.APISIX)
+  - name: shared_dict_free_space_bytes
+    exp: apisix_shared_dict_free_space_bytes.sum(['name','host_name']).service(['host_name'] , Layer.APISIX)
+  - name: sv_etcd_indexes
+    exp: apisix_etcd_modify_indexes.sum(['key','host_name']).service(['host_name'] , Layer.APISIX)
+  - name: sv_bandwidth
+    exp: apisix_bandwidth.tagEqual('route','').tagEqual('service','').tagEqual('consumer','').tagEqual('node','').sum(['type','host_name']).rate('PT1M').service(['host_name'] , Layer.APISIX)
+  - name: sv_http_status
+    exp: apisix_http_status.tagEqual('route','').tagEqual('matched_uri','').tagEqual('matched_host','').tagEqual('service','').tagEqual('consumer','').tagEqual('node','').sum(['code','host_name']).rate('PT1M').service(['host_name'] , Layer.APISIX)

Review Comment:
   The `different code of http_status per second` ? If  that so, suggest add unit and more explanations on the UI for users to avoid the confusion.


##########
oap-server/server-starter/src/main/resources/otel-rules/apisix.yaml:
##########
@@ -0,0 +1,68 @@
+# Licensed to the Apache Software Foundation (ASF) under one or more
+# contributor license agreements.  See the NOTICE file distributed with
+# this work for additional information regarding copyright ownership.
+# The ASF licenses this file to You under the Apache License, Version 2.0
+# (the "License"); you may not use this file except in compliance with
+# the License.  You may obtain a copy of the License at
+#
+#     http://www.apache.org/licenses/LICENSE-2.0
+#
+# Unless required by applicable law or agreed to in writing, software
+# distributed under the License is distributed on an "AS IS" BASIS,
+# WITHOUT WARRANTIES OR CONDITIONS OF ANY KIND, either express or implied.
+# See the License for the specific language governing permissions and
+# limitations under the License.
+
+# This will parse a textual representation of a duration. The formats
+# accepted are based on the ISO-8601 duration format {@code PnDTnHnMn.nS}
+# with days considered to be exactly 24 hours.
+# <p>
+# Examples:
+# <pre>
+#    "PT20.345S" -- parses as "20.345 seconds"
+#    "PT15M"     -- parses as "15 minutes" (where a minute is 60 seconds)
+#    "PT10H"     -- parses as "10 hours" (where an hour is 3600 seconds)
+#    "P2D"       -- parses as "2 days" (where a day is 24 hours or 86400 seconds)
+#    "P2DT3H4M"  -- parses as "2 days, 3 hours and 4 minutes"
+#    "P-6H3M"    -- parses as "-6 hours and +3 minutes"
+#    "-P6H3M"    -- parses as "-6 hours and -3 minutes"
+#    "-P-6H+3M"  -- parses as "+6 hours and -3 minutes"
+# </pre>
+filter: "{ tags -> tags.job_name == 'apisix-monitoring' }" # The OpenTelemetry job name
+expPrefix:  tag({tags -> tags.host_name = 'apisix::' + tags.service_instance_id})
+expSuffix:
+metricPrefix: meter_apisix
+metricsRules:
+  # apisix
+  - name: sv_http_connections
+    exp: apisix_nginx_http_current_connections.sum(['state','host_name']).service(['host_name'] , Layer.APISIX)
+  - name: shared_dict_capacity_bytes
+    exp: apisix_shared_dict_capacity_bytes.sum(['name','host_name']).service(['host_name'] , Layer.APISIX)
+  - name: shared_dict_free_space_bytes
+    exp: apisix_shared_dict_free_space_bytes.sum(['name','host_name']).service(['host_name'] , Layer.APISIX)
+  - name: sv_etcd_indexes
+    exp: apisix_etcd_modify_indexes.sum(['key','host_name']).service(['host_name'] , Layer.APISIX)
+  - name: sv_bandwidth
+    exp: apisix_bandwidth.tagEqual('route','').tagEqual('service','').tagEqual('consumer','').tagEqual('node','').sum(['type','host_name']).rate('PT1M').service(['host_name'] , Layer.APISIX)
+  - name: sv_http_status
+    exp: apisix_http_status.tagEqual('route','').tagEqual('matched_uri','').tagEqual('matched_host','').tagEqual('service','').tagEqual('consumer','').tagEqual('node','').sum(['code','host_name']).rate('PT1M').service(['host_name'] , Layer.APISIX)

Review Comment:
   The `different code of http_status per second` ? If  that so, suggest add unit and more explanations (tips) on the UI for users to avoid the confusion.


##########
oap-server/server-starter/src/main/resources/otel-rules/apisix.yaml:
##########
@@ -0,0 +1,68 @@
+# Licensed to the Apache Software Foundation (ASF) under one or more
+# contributor license agreements.  See the NOTICE file distributed with
+# this work for additional information regarding copyright ownership.
+# The ASF licenses this file to You under the Apache License, Version 2.0
+# (the "License"); you may not use this file except in compliance with
+# the License.  You may obtain a copy of the License at
+#
+#     http://www.apache.org/licenses/LICENSE-2.0
+#
+# Unless required by applicable law or agreed to in writing, software
+# distributed under the License is distributed on an "AS IS" BASIS,
+# WITHOUT WARRANTIES OR CONDITIONS OF ANY KIND, either express or implied.
+# See the License for the specific language governing permissions and
+# limitations under the License.
+
+# This will parse a textual representation of a duration. The formats
+# accepted are based on the ISO-8601 duration format {@code PnDTnHnMn.nS}
+# with days considered to be exactly 24 hours.
+# <p>
+# Examples:
+# <pre>
+#    "PT20.345S" -- parses as "20.345 seconds"
+#    "PT15M"     -- parses as "15 minutes" (where a minute is 60 seconds)
+#    "PT10H"     -- parses as "10 hours" (where an hour is 3600 seconds)
+#    "P2D"       -- parses as "2 days" (where a day is 24 hours or 86400 seconds)
+#    "P2DT3H4M"  -- parses as "2 days, 3 hours and 4 minutes"
+#    "P-6H3M"    -- parses as "-6 hours and +3 minutes"
+#    "-P6H3M"    -- parses as "-6 hours and -3 minutes"
+#    "-P-6H+3M"  -- parses as "+6 hours and -3 minutes"
+# </pre>
+filter: "{ tags -> tags.job_name == 'apisix-monitoring' }" # The OpenTelemetry job name
+expPrefix:  tag({tags -> tags.host_name = 'apisix::' + tags.service_instance_id})
+expSuffix:
+metricPrefix: meter_apisix
+metricsRules:
+  # apisix
+  - name: sv_http_connections
+    exp: apisix_nginx_http_current_connections.sum(['state','host_name']).service(['host_name'] , Layer.APISIX)
+  - name: shared_dict_capacity_bytes
+    exp: apisix_shared_dict_capacity_bytes.sum(['name','host_name']).service(['host_name'] , Layer.APISIX)
+  - name: shared_dict_free_space_bytes
+    exp: apisix_shared_dict_free_space_bytes.sum(['name','host_name']).service(['host_name'] , Layer.APISIX)
+  - name: sv_etcd_indexes
+    exp: apisix_etcd_modify_indexes.sum(['key','host_name']).service(['host_name'] , Layer.APISIX)
+  - name: sv_bandwidth
+    exp: apisix_bandwidth.tagEqual('route','').tagEqual('service','').tagEqual('consumer','').tagEqual('node','').sum(['type','host_name']).rate('PT1M').service(['host_name'] , Layer.APISIX)
+  - name: sv_http_status
+    exp: apisix_http_status.tagEqual('route','').tagEqual('matched_uri','').tagEqual('matched_host','').tagEqual('service','').tagEqual('consumer','').tagEqual('node','').sum(['code','host_name']).rate('PT1M').service(['host_name'] , Layer.APISIX)

Review Comment:
   I don't think the unit (Rate) is appropriate, I think `404 per second` not meaning the percentage of the `404`, WDYT @wu-sheng


--
This is an automated message from the Apache Git Service.
To respond to the message, please log on to GitHub and use the
URL above to go to the specific comment.

To unsubscribe, e-mail: notifications-unsubscribe@skywalking.apache.org

For queries about this service, please contact Infrastructure at:
users@infra.apache.org
[GitHub] [skywalking] wu-sheng commented on a diff in pull request #9725: Add APISIX metrics monitoring
Posted by GitBox <gi...@apache.org>.
wu-sheng commented on code in PR #9725:
URL: https://github.com/apache/skywalking/pull/9725#discussion_r985261710


##########
oap-server/server-starter/src/main/resources/otel-rules/apisix.yaml:
##########
@@ -0,0 +1,68 @@
+# Licensed to the Apache Software Foundation (ASF) under one or more
+# contributor license agreements.  See the NOTICE file distributed with
+# this work for additional information regarding copyright ownership.
+# The ASF licenses this file to You under the Apache License, Version 2.0
+# (the "License"); you may not use this file except in compliance with
+# the License.  You may obtain a copy of the License at
+#
+#     http://www.apache.org/licenses/LICENSE-2.0
+#
+# Unless required by applicable law or agreed to in writing, software
+# distributed under the License is distributed on an "AS IS" BASIS,
+# WITHOUT WARRANTIES OR CONDITIONS OF ANY KIND, either express or implied.
+# See the License for the specific language governing permissions and
+# limitations under the License.
+
+# This will parse a textual representation of a duration. The formats
+# accepted are based on the ISO-8601 duration format {@code PnDTnHnMn.nS}
+# with days considered to be exactly 24 hours.
+# <p>
+# Examples:
+# <pre>
+#    "PT20.345S" -- parses as "20.345 seconds"
+#    "PT15M"     -- parses as "15 minutes" (where a minute is 60 seconds)
+#    "PT10H"     -- parses as "10 hours" (where an hour is 3600 seconds)
+#    "P2D"       -- parses as "2 days" (where a day is 24 hours or 86400 seconds)
+#    "P2DT3H4M"  -- parses as "2 days, 3 hours and 4 minutes"
+#    "P-6H3M"    -- parses as "-6 hours and +3 minutes"
+#    "-P6H3M"    -- parses as "-6 hours and -3 minutes"
+#    "-P-6H+3M"  -- parses as "+6 hours and -3 minutes"
+# </pre>
+filter: "{ tags -> tags.job_name == 'apisix-monitoring' }" # The OpenTelemetry job name
+expPrefix:  tag({tags -> tags.host_name = 'apisix::' + tags.service_instance_id})
+expSuffix:
+metricPrefix: meter_apisix
+metricsRules:
+  # apisix
+  - name: sv_http_connections
+    exp: apisix_nginx_http_current_connections.sum(['state','host_name']).service(['host_name'] , Layer.APISIX)
+  - name: shared_dict_capacity_bytes
+    exp: apisix_shared_dict_capacity_bytes.sum(['name','host_name']).service(['host_name'] , Layer.APISIX)
+  - name: shared_dict_free_space_bytes
+    exp: apisix_shared_dict_free_space_bytes.sum(['name','host_name']).service(['host_name'] , Layer.APISIX)
+  - name: sv_etcd_indexes
+    exp: apisix_etcd_modify_indexes.sum(['key','host_name']).service(['host_name'] , Layer.APISIX)
+  - name: sv_bandwidth
+    exp: apisix_bandwidth.tagEqual('route','').tagEqual('service','').tagEqual('consumer','').tagEqual('node','').sum(['type','host_name']).rate('PT1M').service(['host_name'] , Layer.APISIX)
+  - name: sv_http_status
+    exp: apisix_http_status.tagEqual('route','').tagEqual('matched_uri','').tagEqual('matched_host','').tagEqual('service','').tagEqual('consumer','').tagEqual('node','').sum(['code','host_name']).rate('PT1M').service(['host_name'] , Layer.APISIX)

Review Comment:
   Let's go back to the original, why 404 matters?

   This is a gateway, so, unless the firewall blocks some IPs(such as DDoS), most likely, every client/browser could access any URI randomly. 404 is just a code but doesn't represent the health status.


##########
oap-server/server-starter/src/main/resources/otel-rules/apisix.yaml:
##########
@@ -0,0 +1,68 @@
+# Licensed to the Apache Software Foundation (ASF) under one or more
+# contributor license agreements.  See the NOTICE file distributed with
+# this work for additional information regarding copyright ownership.
+# The ASF licenses this file to You under the Apache License, Version 2.0
+# (the "License"); you may not use this file except in compliance with
+# the License.  You may obtain a copy of the License at
+#
+#     http://www.apache.org/licenses/LICENSE-2.0
+#
+# Unless required by applicable law or agreed to in writing, software
+# distributed under the License is distributed on an "AS IS" BASIS,
+# WITHOUT WARRANTIES OR CONDITIONS OF ANY KIND, either express or implied.
+# See the License for the specific language governing permissions and
+# limitations under the License.
+
+# This will parse a textual representation of a duration. The formats
+# accepted are based on the ISO-8601 duration format {@code PnDTnHnMn.nS}
+# with days considered to be exactly 24 hours.
+# <p>
+# Examples:
+# <pre>
+#    "PT20.345S" -- parses as "20.345 seconds"
+#    "PT15M"     -- parses as "15 minutes" (where a minute is 60 seconds)
+#    "PT10H"     -- parses as "10 hours" (where an hour is 3600 seconds)
+#    "P2D"       -- parses as "2 days" (where a day is 24 hours or 86400 seconds)
+#    "P2DT3H4M"  -- parses as "2 days, 3 hours and 4 minutes"
+#    "P-6H3M"    -- parses as "-6 hours and +3 minutes"
+#    "-P6H3M"    -- parses as "-6 hours and -3 minutes"
+#    "-P-6H+3M"  -- parses as "+6 hours and -3 minutes"
+# </pre>
+filter: "{ tags -> tags.job_name == 'apisix-monitoring' }" # The OpenTelemetry job name
+expPrefix:  tag({tags -> tags.host_name = 'apisix::' + tags.service_instance_id})
+expSuffix:
+metricPrefix: meter_apisix
+metricsRules:
+  # apisix
+  - name: sv_http_connections
+    exp: apisix_nginx_http_current_connections.sum(['state','host_name']).service(['host_name'] , Layer.APISIX)
+  - name: shared_dict_capacity_bytes
+    exp: apisix_shared_dict_capacity_bytes.sum(['name','host_name']).service(['host_name'] , Layer.APISIX)
+  - name: shared_dict_free_space_bytes
+    exp: apisix_shared_dict_free_space_bytes.sum(['name','host_name']).service(['host_name'] , Layer.APISIX)
+  - name: sv_etcd_indexes
+    exp: apisix_etcd_modify_indexes.sum(['key','host_name']).service(['host_name'] , Layer.APISIX)
+  - name: sv_bandwidth
+    exp: apisix_bandwidth.tagEqual('route','').tagEqual('service','').tagEqual('consumer','').tagEqual('node','').sum(['type','host_name']).rate('PT1M').service(['host_name'] , Layer.APISIX)
+  - name: sv_http_status
+    exp: apisix_http_status.tagEqual('route','').tagEqual('matched_uri','').tagEqual('matched_host','').tagEqual('service','').tagEqual('consumer','').tagEqual('node','').sum(['code','host_name']).rate('PT1M').service(['host_name'] , Layer.APISIX)

Review Comment:
   `rate('PT1M')` for a counter only means what the increase/decrease rate of this metric in the past one minute is. It has no logic connection about the percentage of 404 in all requests. Also, as my previous comments, even it is the percentage, 404 actually doesn't have real meaning to measure server performance.


##########
oap-server/server-starter/src/main/resources/otel-rules/apisix.yaml:
##########
@@ -0,0 +1,68 @@
+# Licensed to the Apache Software Foundation (ASF) under one or more
+# contributor license agreements.  See the NOTICE file distributed with
+# this work for additional information regarding copyright ownership.
+# The ASF licenses this file to You under the Apache License, Version 2.0
+# (the "License"); you may not use this file except in compliance with
+# the License.  You may obtain a copy of the License at
+#
+#     http://www.apache.org/licenses/LICENSE-2.0
+#
+# Unless required by applicable law or agreed to in writing, software
+# distributed under the License is distributed on an "AS IS" BASIS,
+# WITHOUT WARRANTIES OR CONDITIONS OF ANY KIND, either express or implied.
+# See the License for the specific language governing permissions and
+# limitations under the License.
+
+# This will parse a textual representation of a duration. The formats
+# accepted are based on the ISO-8601 duration format {@code PnDTnHnMn.nS}
+# with days considered to be exactly 24 hours.
+# <p>
+# Examples:
+# <pre>
+#    "PT20.345S" -- parses as "20.345 seconds"
+#    "PT15M"     -- parses as "15 minutes" (where a minute is 60 seconds)
+#    "PT10H"     -- parses as "10 hours" (where an hour is 3600 seconds)
+#    "P2D"       -- parses as "2 days" (where a day is 24 hours or 86400 seconds)
+#    "P2DT3H4M"  -- parses as "2 days, 3 hours and 4 minutes"
+#    "P-6H3M"    -- parses as "-6 hours and +3 minutes"
+#    "-P6H3M"    -- parses as "-6 hours and -3 minutes"
+#    "-P-6H+3M"  -- parses as "+6 hours and -3 minutes"
+# </pre>
+filter: "{ tags -> tags.job_name == 'apisix-monitoring' }" # The OpenTelemetry job name
+expPrefix:  tag({tags -> tags.host_name = 'apisix::' + tags.service_instance_id})
+expSuffix:
+metricPrefix: meter_apisix
+metricsRules:
+  # apisix
+  - name: sv_http_connections
+    exp: apisix_nginx_http_current_connections.sum(['state','host_name']).service(['host_name'] , Layer.APISIX)
+  - name: shared_dict_capacity_bytes
+    exp: apisix_shared_dict_capacity_bytes.sum(['name','host_name']).service(['host_name'] , Layer.APISIX)
+  - name: shared_dict_free_space_bytes
+    exp: apisix_shared_dict_free_space_bytes.sum(['name','host_name']).service(['host_name'] , Layer.APISIX)
+  - name: sv_etcd_indexes
+    exp: apisix_etcd_modify_indexes.sum(['key','host_name']).service(['host_name'] , Layer.APISIX)
+  - name: sv_bandwidth
+    exp: apisix_bandwidth.tagEqual('route','').tagEqual('service','').tagEqual('consumer','').tagEqual('node','').sum(['type','host_name']).rate('PT1M').service(['host_name'] , Layer.APISIX)
+  - name: sv_http_status
+    exp: apisix_http_status.tagEqual('route','').tagEqual('matched_uri','').tagEqual('matched_host','').tagEqual('service','').tagEqual('consumer','').tagEqual('node','').sum(['code','host_name']).rate('PT1M').service(['host_name'] , Layer.APISIX)

Review Comment:
   Does `apisix_http_status` include all response codes? Or just some >= 300?


--
This is an automated message from the Apache Git Service.
To respond to the message, please log on to GitHub and use the
URL above to go to the specific comment.

To unsubscribe, e-mail: notifications-unsubscribe@skywalking.apache.org

For queries about this service, please contact Infrastructure at:
users@infra.apache.org
[GitHub] [skywalking] wu-sheng commented on pull request #9725: Add APISIX metrics monitoring
Posted by GitBox <gi...@apache.org>.
wu-sheng commented on PR #9725:
URL: https://github.com/apache/skywalking/pull/9725#issuecomment-1264562652

   Have you synced UI to latest? If so, there are several other changes should be added into changes.md


--
This is an automated message from the Apache Git Service.
To respond to the message, please log on to GitHub and use the
URL above to go to the specific comment.

To unsubscribe, e-mail: notifications-unsubscribe@skywalking.apache.org

For queries about this service, please contact Infrastructure at:
users@infra.apache.org
[GitHub] [skywalking] pg-yang commented on a diff in pull request #9725: Add APISIX metrics monitoring
Posted by GitBox <gi...@apache.org>.
pg-yang commented on code in PR #9725:
URL: https://github.com/apache/skywalking/pull/9725#discussion_r985197392


##########
docs/en/concepts-and-designs/mal.md:
##########
@@ -164,7 +164,7 @@ These operations can be used to aggregate overall label dimensions or preserve d
 Example expression:

 ```
-instance_trace_count.sum(by: ['az'])
+instance_trace_count.sum(['az'])

Review Comment:
   When I add by keyword , OAP  throw exception
   ```
     - name: sv_http_connections
       exp: "apisix_nginx_http_current_connections.sum(by: ['state','host_name']).service(['host_name'] , Layer.APISIX)"

   ```

   ```
   Possible solutions: sum(java.util.List), dump(), use([Ljava.lang.Object;), any(), use(java.util.List, groovy.lang.Closure), use(java.lang.Class, groovy.lang.Closure)
   org.apache.skywalking.oap.meter.analyzer.dsl.ExpressionParsingException: failed to parse expression: (apisix_nginx_http_current_connections.tag({tags -> tags.host_name = 'apisix::' + tags.service_instance_id})).sum(by: ['state','host_name']).service(['host_name'] , Layer.APISIX), error:No signature of method: org.apache.skywalking.oap.meter.analyzer.dsl.SampleFamily.sum() is applicable for argument types: (LinkedHashMap) values: [[by:[state, host_name]]]
   Possible solutions: sum(java.util.List), dump(), use([Ljava.lang.Object;), any(), use(java.util.List, groovy.lang.Closure), use(java.lang.Class, groovy.lang.Closure)
   	at org.apache.skywalking.oap.meter.analyzer.dsl.Expression.parse(Expression.java:59) ~[classes/:?]
   	at org.apache.skywalking.oap.meter.analyzer.Analyzer.build(Analyzer.java:91) ~[classes/:?]
   	at org.apache.skywalking.oap.meter.analyzer.MetricConvert.lambda$new$2(MetricConvert.java:71) ~[classes/:?]
   	at java.util.stream.ReferencePipeline$3$1.accept(ReferencePipeline.java:193) ~[?:1.8.0_321]
   	at java.util.ArrayList$ArrayListSpliterator.forEachRemaining(ArrayList.java:1384) ~[?:1.8.0_321]
   	at java.util.stream.AbstractPipeline.copyInto(AbstractPipeline.java:482) ~[?:1.8.0_321]
   	at java.util.stream.AbstractPipeline.wrapAndCopyInto(AbstractPipeline.java:472) ~[?:1.8.0_321]
   	at java.util.stream.ReduceOps$ReduceOp.evaluateSequential(ReduceOps.java:708) ~[?:1.8.0_321]
   	at java.util.stream.AbstractPipeline.evaluate(AbstractPipeline.java:234) ~[?:1.8.0_321]
   	at java.util.stream.ReferencePipeline.collect(ReferencePipeline.java:499) ~[?:1.8.0_321]
   	at org.apache.skywalking.oap.meter.analyzer.MetricConvert.<init>(MetricConvert.java:78) ~[classes/:?]
   	at org.apache.skywalking.oap.meter.analyzer.prometheus.PrometheusMetricConverter.<init>(PrometheusMetricConverter.java:73) ~[classes/:?]
   	at org.apache.skywalking.oap.server.receiver.otel.oc.OCMetricHandler.lambda$active$1(OCMetricHandler.java:188) ~[classes/:?]
   	at java.util.stream.ReferencePipeline$3$1.accept(ReferencePipeline.java:193) ~[?:1.8.0_321]
   	at java.util.ArrayList$ArrayListSpliterator.forEachRemaining(ArrayList.java:1384) ~[?:1.8.0_321]
   	at java.util.stream.AbstractPipeline.copyInto(AbstractPipeline.java:482) ~[?:1.8.0_321]
   	at java.util.stream.AbstractPipeline.wrapAndCopyInto(AbstractPipeline.java:472) ~[?:1.8.0_321]
   	at java.util.stream.ReduceOps$ReduceOp.evaluateSequential(ReduceOps.java:708) ~[?:1.8.0_321]
   	at java.util.stream.AbstractPipeline.evaluate(AbstractPipeline.java:234) ~[?:1.8.0_321]
   	at java.util.stream.ReferencePipeline.collect(ReferencePipeline.java:499) ~[?:1.8.0_321]
   ```


--
This is an automated message from the Apache Git Service.
To respond to the message, please log on to GitHub and use the
URL above to go to the specific comment.

To unsubscribe, e-mail: notifications-unsubscribe@skywalking.apache.org

For queries about this service, please contact Infrastructure at:
users@infra.apache.org
[GitHub] [skywalking] wu-sheng commented on pull request #9725: Add APISIX metrics monitoring
Posted by GitBox <gi...@apache.org>.
wu-sheng commented on PR #9725:
URL: https://github.com/apache/skywalking/pull/9725#issuecomment-1265680886

   > And latency unit is ms , it's defined by apisix prometheus plugin , so we couldn't convert it to nano-sec

   OK, if that is from APISIX plugin, let's keep them as they are now.


--
This is an automated message from the Apache Git Service.
To respond to the message, please log on to GitHub and use the
URL above to go to the specific comment.

To unsubscribe, e-mail: notifications-unsubscribe@skywalking.apache.org

For queries about this service, please contact Infrastructure at:
users@infra.apache.org
[GitHub] [skywalking] pg-yang commented on a diff in pull request #9725: Add APISIX metrics monitoring
Posted by GitBox <gi...@apache.org>.
pg-yang commented on code in PR #9725:
URL: https://github.com/apache/skywalking/pull/9725#discussion_r985235095


##########
oap-server/server-starter/src/main/resources/otel-rules/apisix.yaml:
##########
@@ -0,0 +1,68 @@
+# Licensed to the Apache Software Foundation (ASF) under one or more
+# contributor license agreements.  See the NOTICE file distributed with
+# this work for additional information regarding copyright ownership.
+# The ASF licenses this file to You under the Apache License, Version 2.0
+# (the "License"); you may not use this file except in compliance with
+# the License.  You may obtain a copy of the License at
+#
+#     http://www.apache.org/licenses/LICENSE-2.0
+#
+# Unless required by applicable law or agreed to in writing, software
+# distributed under the License is distributed on an "AS IS" BASIS,
+# WITHOUT WARRANTIES OR CONDITIONS OF ANY KIND, either express or implied.
+# See the License for the specific language governing permissions and
+# limitations under the License.
+
+# This will parse a textual representation of a duration. The formats
+# accepted are based on the ISO-8601 duration format {@code PnDTnHnMn.nS}
+# with days considered to be exactly 24 hours.
+# <p>
+# Examples:
+# <pre>
+#    "PT20.345S" -- parses as "20.345 seconds"
+#    "PT15M"     -- parses as "15 minutes" (where a minute is 60 seconds)
+#    "PT10H"     -- parses as "10 hours" (where an hour is 3600 seconds)
+#    "P2D"       -- parses as "2 days" (where a day is 24 hours or 86400 seconds)
+#    "P2DT3H4M"  -- parses as "2 days, 3 hours and 4 minutes"
+#    "P-6H3M"    -- parses as "-6 hours and +3 minutes"
+#    "-P6H3M"    -- parses as "-6 hours and -3 minutes"
+#    "-P-6H+3M"  -- parses as "+6 hours and -3 minutes"
+# </pre>
+filter: "{ tags -> tags.job_name == 'apisix-monitoring' }" # The OpenTelemetry job name
+expPrefix:  tag({tags -> tags.host_name = 'apisix::' + tags.service_instance_id})
+expSuffix:
+metricPrefix: meter_apisix
+metricsRules:
+  # apisix
+  - name: sv_http_connections
+    exp: apisix_nginx_http_current_connections.sum(['state','host_name']).service(['host_name'] , Layer.APISIX)
+  - name: shared_dict_capacity_bytes
+    exp: apisix_shared_dict_capacity_bytes.sum(['name','host_name']).service(['host_name'] , Layer.APISIX)
+  - name: shared_dict_free_space_bytes
+    exp: apisix_shared_dict_free_space_bytes.sum(['name','host_name']).service(['host_name'] , Layer.APISIX)
+  - name: sv_etcd_indexes
+    exp: apisix_etcd_modify_indexes.sum(['key','host_name']).service(['host_name'] , Layer.APISIX)
+  - name: sv_bandwidth
+    exp: apisix_bandwidth.tagEqual('route','').tagEqual('service','').tagEqual('consumer','').tagEqual('node','').sum(['type','host_name']).rate('PT1M').service(['host_name'] , Layer.APISIX)

Review Comment:
   Sure


--
This is an automated message from the Apache Git Service.
To respond to the message, please log on to GitHub and use the
URL above to go to the specific comment.

To unsubscribe, e-mail: notifications-unsubscribe@skywalking.apache.org

For queries about this service, please contact Infrastructure at:
users@infra.apache.org
[GitHub] [skywalking] wankai123 commented on a diff in pull request #9725: Add APISIX metrics monitoring
Posted by GitBox <gi...@apache.org>.
wankai123 commented on code in PR #9725:
URL: https://github.com/apache/skywalking/pull/9725#discussion_r985252803
##########
docs/en/concepts-and-designs/mal.md:
##########
@@ -164,7 +164,7 @@ These operations can be used to aggregate overall label dimensions or preserve d
Example expression:
```
-instance_trace_count.sum(by: ['az'])
+instance_trace_count.sum(['az'])
Review Comment:
The expression should be `apisix_nginx_http_current_connections.sum(by = ['state','host_name']).service(['host_name'] , Layer.APISIX)`,
see: https://github.com/apache/skywalking/blob/dd6b7a1fc0f8581e25c86cf6c904848f0c574e92/oap-server/analyzer/meter-analyzer/src/test/java/org/apache/skywalking/oap/meter/analyzer/dsl/AggregationTest.java#L76
##########
docs/en/concepts-and-designs/mal.md:
##########
@@ -164,7 +164,7 @@ These operations can be used to aggregate overall label dimensions or preserve d
Example expression:
```
-instance_trace_count.sum(by: ['az'])
+instance_trace_count.sum(['az'])
Review Comment:
The expression should be `apisix_nginx_http_current_connections.sum(by = ['state','host_name']).service(['host_name'] , Layer.APISIX)`, if use `by`
see: https://github.com/apache/skywalking/blob/dd6b7a1fc0f8581e25c86cf6c904848f0c574e92/oap-server/analyzer/meter-analyzer/src/test/java/org/apache/skywalking/oap/meter/analyzer/dsl/AggregationTest.java#L76
##########
oap-server/server-starter/src/main/resources/otel-rules/apisix.yaml:
##########
@@ -0,0 +1,68 @@
+# Licensed to the Apache Software Foundation (ASF) under one or more
+# contributor license agreements. See the NOTICE file distributed with
+# this work for additional information regarding copyright ownership.
+# The ASF licenses this file to You under the Apache License, Version 2.0
+# (the "License"); you may not use this file except in compliance with
+# the License. You may obtain a copy of the License at
+#
+# http://www.apache.org/licenses/LICENSE-2.0
+#
+# Unless required by applicable law or agreed to in writing, software
+# distributed under the License is distributed on an "AS IS" BASIS,
+# WITHOUT WARRANTIES OR CONDITIONS OF ANY KIND, either express or implied.
+# See the License for the specific language governing permissions and
+# limitations under the License.
+
+# This will parse a textual representation of a duration. The formats
+# accepted are based on the ISO-8601 duration format {@code PnDTnHnMn.nS}
+# with days considered to be exactly 24 hours.
+# <p>
+# Examples:
+# <pre>
+# "PT20.345S" -- parses as "20.345 seconds"
+# "PT15M" -- parses as "15 minutes" (where a minute is 60 seconds)
+# "PT10H" -- parses as "10 hours" (where an hour is 3600 seconds)
+# "P2D" -- parses as "2 days" (where a day is 24 hours or 86400 seconds)
+# "P2DT3H4M" -- parses as "2 days, 3 hours and 4 minutes"
+# "P-6H3M" -- parses as "-6 hours and +3 minutes"
+# "-P6H3M" -- parses as "-6 hours and -3 minutes"
+# "-P-6H+3M" -- parses as "+6 hours and -3 minutes"
+# </pre>
+filter: "{ tags -> tags.job_name == 'apisix-monitoring' }" # The OpenTelemetry job name
+expPrefix: tag({tags -> tags.host_name = 'apisix::' + tags.service_instance_id})
+expSuffix:
+metricPrefix: meter_apisix
+metricsRules:
+ # apisix
+ - name: sv_http_connections
+ exp: apisix_nginx_http_current_connections.sum(['state','host_name']).service(['host_name'] , Layer.APISIX)
+ - name: shared_dict_capacity_bytes
+ exp: apisix_shared_dict_capacity_bytes.sum(['name','host_name']).service(['host_name'] , Layer.APISIX)
+ - name: shared_dict_free_space_bytes
+ exp: apisix_shared_dict_free_space_bytes.sum(['name','host_name']).service(['host_name'] , Layer.APISIX)
+ - name: sv_etcd_indexes
+ exp: apisix_etcd_modify_indexes.sum(['key','host_name']).service(['host_name'] , Layer.APISIX)
+ - name: sv_bandwidth
+ exp: apisix_bandwidth.tagEqual('route','').tagEqual('service','').tagEqual('consumer','').tagEqual('node','').sum(['type','host_name']).rate('PT1M').service(['host_name'] , Layer.APISIX)
+ - name: sv_http_status
+ exp: apisix_http_status.tagEqual('route','').tagEqual('matched_uri','').tagEqual('matched_host','').tagEqual('service','').tagEqual('consumer','').tagEqual('node','').sum(['code','host_name']).rate('PT1M').service(['host_name'] , Layer.APISIX)
Review Comment:
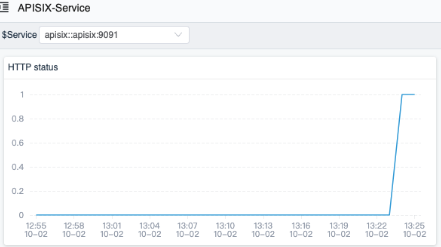
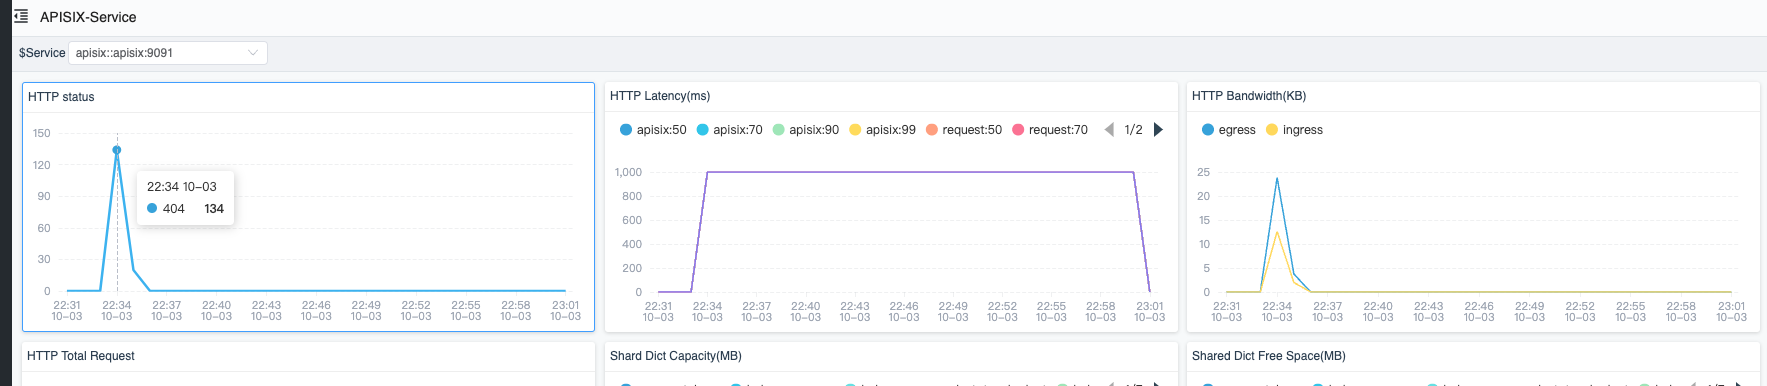
I see the `http_status` from the UI is 0-1,is that correct?
##########
oap-server/server-starter/src/main/resources/otel-rules/apisix.yaml:
##########
@@ -0,0 +1,68 @@
+# Licensed to the Apache Software Foundation (ASF) under one or more
+# contributor license agreements. See the NOTICE file distributed with
+# this work for additional information regarding copyright ownership.
+# The ASF licenses this file to You under the Apache License, Version 2.0
+# (the "License"); you may not use this file except in compliance with
+# the License. You may obtain a copy of the License at
+#
+# http://www.apache.org/licenses/LICENSE-2.0
+#
+# Unless required by applicable law or agreed to in writing, software
+# distributed under the License is distributed on an "AS IS" BASIS,
+# WITHOUT WARRANTIES OR CONDITIONS OF ANY KIND, either express or implied.
+# See the License for the specific language governing permissions and
+# limitations under the License.
+
+# This will parse a textual representation of a duration. The formats
+# accepted are based on the ISO-8601 duration format {@code PnDTnHnMn.nS}
+# with days considered to be exactly 24 hours.
+# <p>
+# Examples:
+# <pre>
+# "PT20.345S" -- parses as "20.345 seconds"
+# "PT15M" -- parses as "15 minutes" (where a minute is 60 seconds)
+# "PT10H" -- parses as "10 hours" (where an hour is 3600 seconds)
+# "P2D" -- parses as "2 days" (where a day is 24 hours or 86400 seconds)
+# "P2DT3H4M" -- parses as "2 days, 3 hours and 4 minutes"
+# "P-6H3M" -- parses as "-6 hours and +3 minutes"
+# "-P6H3M" -- parses as "-6 hours and -3 minutes"
+# "-P-6H+3M" -- parses as "+6 hours and -3 minutes"
+# </pre>
+filter: "{ tags -> tags.job_name == 'apisix-monitoring' }" # The OpenTelemetry job name
+expPrefix: tag({tags -> tags.host_name = 'apisix::' + tags.service_instance_id})
+expSuffix:
+metricPrefix: meter_apisix
+metricsRules:
+ # apisix
+ - name: sv_http_connections
+ exp: apisix_nginx_http_current_connections.sum(['state','host_name']).service(['host_name'] , Layer.APISIX)
+ - name: shared_dict_capacity_bytes
+ exp: apisix_shared_dict_capacity_bytes.sum(['name','host_name']).service(['host_name'] , Layer.APISIX)
+ - name: shared_dict_free_space_bytes
+ exp: apisix_shared_dict_free_space_bytes.sum(['name','host_name']).service(['host_name'] , Layer.APISIX)
+ - name: sv_etcd_indexes
+ exp: apisix_etcd_modify_indexes.sum(['key','host_name']).service(['host_name'] , Layer.APISIX)
+ - name: sv_bandwidth
+ exp: apisix_bandwidth.tagEqual('route','').tagEqual('service','').tagEqual('consumer','').tagEqual('node','').sum(['type','host_name']).rate('PT1M').service(['host_name'] , Layer.APISIX)
+ - name: sv_http_status
+ exp: apisix_http_status.tagEqual('route','').tagEqual('matched_uri','').tagEqual('matched_host','').tagEqual('service','').tagEqual('consumer','').tagEqual('node','').sum(['code','host_name']).rate('PT1M').service(['host_name'] , Layer.APISIX)
Review Comment:
may be need more explanations about what this metric meaning?
--
This is an automated message from the Apache Git Service.
To respond to the message, please log on to GitHub and use the
URL above to go to the specific comment.
To unsubscribe, e-mail: notifications-unsubscribe@skywalking.apache.org
For queries about this service, please contact Infrastructure at:
users@infra.apache.org
[GitHub] [skywalking] pg-yang commented on a diff in pull request #9725: Add APISIX metrics monitoring
Posted by GitBox <gi...@apache.org>.
pg-yang commented on code in PR #9725:
URL: https://github.com/apache/skywalking/pull/9725#discussion_r985514767
##########
oap-server/server-starter/src/main/resources/otel-rules/apisix.yaml:
##########
@@ -0,0 +1,68 @@
+# Licensed to the Apache Software Foundation (ASF) under one or more
+# contributor license agreements. See the NOTICE file distributed with
+# this work for additional information regarding copyright ownership.
+# The ASF licenses this file to You under the Apache License, Version 2.0
+# (the "License"); you may not use this file except in compliance with
+# the License. You may obtain a copy of the License at
+#
+# http://www.apache.org/licenses/LICENSE-2.0
+#
+# Unless required by applicable law or agreed to in writing, software
+# distributed under the License is distributed on an "AS IS" BASIS,
+# WITHOUT WARRANTIES OR CONDITIONS OF ANY KIND, either express or implied.
+# See the License for the specific language governing permissions and
+# limitations under the License.
+
+# This will parse a textual representation of a duration. The formats
+# accepted are based on the ISO-8601 duration format {@code PnDTnHnMn.nS}
+# with days considered to be exactly 24 hours.
+# <p>
+# Examples:
+# <pre>
+# "PT20.345S" -- parses as "20.345 seconds"
+# "PT15M" -- parses as "15 minutes" (where a minute is 60 seconds)
+# "PT10H" -- parses as "10 hours" (where an hour is 3600 seconds)
+# "P2D" -- parses as "2 days" (where a day is 24 hours or 86400 seconds)
+# "P2DT3H4M" -- parses as "2 days, 3 hours and 4 minutes"
+# "P-6H3M" -- parses as "-6 hours and +3 minutes"
+# "-P6H3M" -- parses as "-6 hours and -3 minutes"
+# "-P-6H+3M" -- parses as "+6 hours and -3 minutes"
+# </pre>
+filter: "{ tags -> tags.job_name == 'apisix-monitoring' }" # The OpenTelemetry job name
+expPrefix: tag({tags -> tags.host_name = 'apisix::' + tags.service_instance_id})
+expSuffix:
+metricPrefix: meter_apisix
+metricsRules:
+ # apisix
+ - name: sv_http_connections
+ exp: apisix_nginx_http_current_connections.sum(['state','host_name']).service(['host_name'] , Layer.APISIX)
+ - name: shared_dict_capacity_bytes
+ exp: apisix_shared_dict_capacity_bytes.sum(['name','host_name']).service(['host_name'] , Layer.APISIX)
+ - name: shared_dict_free_space_bytes
+ exp: apisix_shared_dict_free_space_bytes.sum(['name','host_name']).service(['host_name'] , Layer.APISIX)
+ - name: sv_etcd_indexes
+ exp: apisix_etcd_modify_indexes.sum(['key','host_name']).service(['host_name'] , Layer.APISIX)
+ - name: sv_bandwidth
+ exp: apisix_bandwidth.tagEqual('route','').tagEqual('service','').tagEqual('consumer','').tagEqual('node','').sum(['type','host_name']).rate('PT1M').service(['host_name'] , Layer.APISIX)
+ - name: sv_http_status
+ exp: apisix_http_status.tagEqual('route','').tagEqual('matched_uri','').tagEqual('matched_host','').tagEqual('service','').tagEqual('consumer','').tagEqual('node','').sum(['code','host_name']).rate('PT1M').service(['host_name'] , Layer.APISIX)
Review Comment:
https://github.com/apache/skywalking/blob/dd6b7a1fc0f8581e25c86cf6c904848f0c574e92/oap-server/server-starter/src/main/resources/ui-initialized-templates/postgresql/postgresql-service.json#L575-L592
Yes ,I refer to this config , I would rename title to `HTTP status Trend (per second)` .
##########
oap-server/server-starter/src/main/resources/otel-rules/apisix.yaml:
##########
@@ -0,0 +1,68 @@
+# Licensed to the Apache Software Foundation (ASF) under one or more
+# contributor license agreements. See the NOTICE file distributed with
+# this work for additional information regarding copyright ownership.
+# The ASF licenses this file to You under the Apache License, Version 2.0
+# (the "License"); you may not use this file except in compliance with
+# the License. You may obtain a copy of the License at
+#
+# http://www.apache.org/licenses/LICENSE-2.0
+#
+# Unless required by applicable law or agreed to in writing, software
+# distributed under the License is distributed on an "AS IS" BASIS,
+# WITHOUT WARRANTIES OR CONDITIONS OF ANY KIND, either express or implied.
+# See the License for the specific language governing permissions and
+# limitations under the License.
+
+# This will parse a textual representation of a duration. The formats
+# accepted are based on the ISO-8601 duration format {@code PnDTnHnMn.nS}
+# with days considered to be exactly 24 hours.
+# <p>
+# Examples:
+# <pre>
+# "PT20.345S" -- parses as "20.345 seconds"
+# "PT15M" -- parses as "15 minutes" (where a minute is 60 seconds)
+# "PT10H" -- parses as "10 hours" (where an hour is 3600 seconds)
+# "P2D" -- parses as "2 days" (where a day is 24 hours or 86400 seconds)
+# "P2DT3H4M" -- parses as "2 days, 3 hours and 4 minutes"
+# "P-6H3M" -- parses as "-6 hours and +3 minutes"
+# "-P6H3M" -- parses as "-6 hours and -3 minutes"
+# "-P-6H+3M" -- parses as "+6 hours and -3 minutes"
+# </pre>
+filter: "{ tags -> tags.job_name == 'apisix-monitoring' }" # The OpenTelemetry job name
+expPrefix: tag({tags -> tags.host_name = 'apisix::' + tags.service_instance_id})
+expSuffix:
+metricPrefix: meter_apisix
+metricsRules:
+ # apisix
+ - name: sv_http_connections
+ exp: apisix_nginx_http_current_connections.sum(['state','host_name']).service(['host_name'] , Layer.APISIX)
+ - name: shared_dict_capacity_bytes
+ exp: apisix_shared_dict_capacity_bytes.sum(['name','host_name']).service(['host_name'] , Layer.APISIX)
+ - name: shared_dict_free_space_bytes
+ exp: apisix_shared_dict_free_space_bytes.sum(['name','host_name']).service(['host_name'] , Layer.APISIX)
+ - name: sv_etcd_indexes
+ exp: apisix_etcd_modify_indexes.sum(['key','host_name']).service(['host_name'] , Layer.APISIX)
+ - name: sv_bandwidth
+ exp: apisix_bandwidth.tagEqual('route','').tagEqual('service','').tagEqual('consumer','').tagEqual('node','').sum(['type','host_name']).rate('PT1M').service(['host_name'] , Layer.APISIX)
+ - name: sv_http_status
+ exp: apisix_http_status.tagEqual('route','').tagEqual('matched_uri','').tagEqual('matched_host','').tagEqual('service','').tagEqual('consumer','').tagEqual('node','').sum(['code','host_name']).rate('PT1M').service(['host_name'] , Layer.APISIX)
Review Comment:
--
This is an automated message from the Apache Git Service.
To respond to the message, please log on to GitHub and use the
URL above to go to the specific comment.
To unsubscribe, e-mail: notifications-unsubscribe@skywalking.apache.org
For queries about this service, please contact Infrastructure at:
users@infra.apache.org
[GitHub] [skywalking] pg-yang commented on a diff in pull request #9725: Add APISIX metrics monitoring
Posted by GitBox <gi...@apache.org>.
pg-yang commented on code in PR #9725:
URL: https://github.com/apache/skywalking/pull/9725#discussion_r985240998


##########
oap-server/server-starter/src/main/resources/otel-rules/apisix.yaml:
##########
@@ -0,0 +1,68 @@
+# Licensed to the Apache Software Foundation (ASF) under one or more
+# contributor license agreements.  See the NOTICE file distributed with
+# this work for additional information regarding copyright ownership.
+# The ASF licenses this file to You under the Apache License, Version 2.0
+# (the "License"); you may not use this file except in compliance with
+# the License.  You may obtain a copy of the License at
+#
+#     http://www.apache.org/licenses/LICENSE-2.0
+#
+# Unless required by applicable law or agreed to in writing, software
+# distributed under the License is distributed on an "AS IS" BASIS,
+# WITHOUT WARRANTIES OR CONDITIONS OF ANY KIND, either express or implied.
+# See the License for the specific language governing permissions and
+# limitations under the License.
+
+# This will parse a textual representation of a duration. The formats
+# accepted are based on the ISO-8601 duration format {@code PnDTnHnMn.nS}
+# with days considered to be exactly 24 hours.
+# <p>
+# Examples:
+# <pre>
+#    "PT20.345S" -- parses as "20.345 seconds"
+#    "PT15M"     -- parses as "15 minutes" (where a minute is 60 seconds)
+#    "PT10H"     -- parses as "10 hours" (where an hour is 3600 seconds)
+#    "P2D"       -- parses as "2 days" (where a day is 24 hours or 86400 seconds)
+#    "P2DT3H4M"  -- parses as "2 days, 3 hours and 4 minutes"
+#    "P-6H3M"    -- parses as "-6 hours and +3 minutes"
+#    "-P6H3M"    -- parses as "-6 hours and -3 minutes"
+#    "-P-6H+3M"  -- parses as "+6 hours and -3 minutes"
+# </pre>
+filter: "{ tags -> tags.job_name == 'apisix-monitoring' }" # The OpenTelemetry job name
+expPrefix:  tag({tags -> tags.host_name = 'apisix::' + tags.service_instance_id})
+expSuffix:
+metricPrefix: meter_apisix
+metricsRules:
+  # apisix
+  - name: sv_http_connections
+    exp: apisix_nginx_http_current_connections.sum(['state','host_name']).service(['host_name'] , Layer.APISIX)
+  - name: shared_dict_capacity_bytes
+    exp: apisix_shared_dict_capacity_bytes.sum(['name','host_name']).service(['host_name'] , Layer.APISIX)
+  - name: shared_dict_free_space_bytes
+    exp: apisix_shared_dict_free_space_bytes.sum(['name','host_name']).service(['host_name'] , Layer.APISIX)
+  - name: sv_etcd_indexes
+    exp: apisix_etcd_modify_indexes.sum(['key','host_name']).service(['host_name'] , Layer.APISIX)
+  - name: sv_bandwidth
+    exp: apisix_bandwidth.tagEqual('route','').tagEqual('service','').tagEqual('consumer','').tagEqual('node','').sum(['type','host_name']).rate('PT1M').service(['host_name'] , Layer.APISIX)

Review Comment:
   done


--
This is an automated message from the Apache Git Service.
To respond to the message, please log on to GitHub and use the
URL above to go to the specific comment.

To unsubscribe, e-mail: notifications-unsubscribe@skywalking.apache.org

For queries about this service, please contact Infrastructure at:
users@infra.apache.org
[GitHub] [skywalking] wu-sheng commented on a diff in pull request #9725: Add APISIX metrics monitoring
Posted by GitBox <gi...@apache.org>.
wu-sheng commented on code in PR #9725:
URL: https://github.com/apache/skywalking/pull/9725#discussion_r985233291


##########
docs/en/setup/backend/backend-apisix-monitoring.md:
##########
@@ -0,0 +1,40 @@
+# APISIX monitoring
+## APISIX  performance from `apisix prometheus plugin`
+SkyWalking leverages OpenTelemetry Collector to transfer the metrics to
+[OpenTelemetry receiver](opentelemetry-receiver.md) and into the [Meter System](./../../concepts-and-designs/meter.md).
+
+### Data flow
+1. [APXSIX prometheus plugin](https://apisix.apache.org/docs/apisix/plugins/prometheus/) collect metrics data from APSIX.
+2. OpenTelemetry Collector fetches metrics from [APXSIX prometheus plugin](https://apisix.apache.org/docs/apisix/plugins/prometheus/) via Prometheus Receiver and pushes metrics to SkyWalking OAP Server via the OpenCensus gRPC Exporter or OpenTelemetry gRPC exporter.
+3. The SkyWalking OAP Server parses the expression with [MAL](../../concepts-and-designs/mal.md) to filter/calculate/aggregate and store the results.
+
+### Set up
+1. Enable APISIX [APXSIX prometheus plugin](https://apisix.apache.org/docs/apisix/plugins/prometheus/) .

Review Comment:
   ```suggestion
   1. Enable APISIX [APXSIX Prometheus plugin](https://apisix.apache.org/docs/apisix/plugins/prometheus/) .
   ```


--
This is an automated message from the Apache Git Service.
To respond to the message, please log on to GitHub and use the
URL above to go to the specific comment.

To unsubscribe, e-mail: notifications-unsubscribe@skywalking.apache.org

For queries about this service, please contact Infrastructure at:
users@infra.apache.org
[GitHub] [skywalking] pg-yang commented on pull request #9725: Add APISIX metrics monitoring
Posted by GitBox <gi...@apache.org>.
pg-yang commented on PR #9725:
URL: https://github.com/apache/skywalking/pull/9725#issuecomment-1264561873
--
This is an automated message from the Apache Git Service.
To respond to the message, please log on to GitHub and use the
URL above to go to the specific comment.
To unsubscribe, e-mail: notifications-unsubscribe@skywalking.apache.org
For queries about this service, please contact Infrastructure at:
users@infra.apache.org
[GitHub] [skywalking] kezhenxu94 commented on a diff in pull request #9725: Add APISIX metrics monitoring
Posted by GitBox <gi...@apache.org>.
kezhenxu94 commented on code in PR #9725:
URL: https://github.com/apache/skywalking/pull/9725#discussion_r985253998


##########
docs/en/concepts-and-designs/mal.md:
##########
@@ -155,16 +155,16 @@ resulting in a new sample family having fewer samples (sometimes having just a s
  - max (select maximum over dimensions)
  - avg (calculate the average over dimensions)

-These operations can be used to aggregate overall label dimensions or preserve distinct dimensions by inputting `by` parameter.
+These operations can be used to aggregate overall label dimensions or preserve distinct dimensions by inputting `by` parameter( the keyword `by` could be omitted)

 ```
-<aggr-op>(by: <tag1, tag2, ...>)
+<aggr-op>(by=<tag1, tag2, ...>)

Review Comment:
   ```suggestion
   <aggr-op>(by=[<tag1>, <tag2>, ...])
   ```


##########
test/e2e-v2/cases/apisix/expected/endpoint.yml:
##########
@@ -0,0 +1,19 @@
+# Licensed to the Apache Software Foundation (ASF) under one or more
+# contributor license agreements.  See the NOTICE file distributed with
+# this work for additional information regarding copyright ownership.
+# The ASF licenses this file to You under the Apache License, Version 2.0
+# (the "License"); you may not use this file except in compliance with
+# the License.  You may obtain a copy of the License at
+#
+#     http://www.apache.org/licenses/LICENSE-2.0
+#
+# Unless required by applicable law or agreed to in writing, software
+# distributed under the License is distributed on an "AS IS" BASIS,
+# WITHOUT WARRANTIES OR CONDITIONS OF ANY KIND, either express or implied.
+# See the License for the specific language governing permissions and
+# limitations under the License.
+
+{{- contains . }}
+- id: YXBpc2l4OjphcGlzaXgtc2VyZXI6OTA5MQ==.1_cm91dGVzIzE=

Review Comment:
   Let's use 👇 for better readability

   ```suggestion
   - id: {{ b64enc "apisix::apisix-serer:9091" }}.1_{{ b64enc "routes#1" }}
   ```


##########
test/e2e-v2/cases/apisix/otel-collector/otel-collector-config.yaml:
##########
@@ -0,0 +1,41 @@
+# Licensed to the Apache Software Foundation (ASF) under one or more
+# contributor license agreements.  See the NOTICE file distributed with
+# this work for additional information regarding copyright ownership.
+# The ASF licenses this file to You under the Apache License, Version 2.0
+# (the "License"); you may not use this file except in compliance with
+# the License.  You may obtain a copy of the License at
+#
+#     http://www.apache.org/licenses/LICENSE-2.0
+#
+# Unless required by applicable law or agreed to in writing, software
+# distributed under the License is distributed on an "AS IS" BASIS,
+# WITHOUT WARRANTIES OR CONDITIONS OF ANY KIND, either express or implied.
+# See the License for the specific language governing permissions and
+# limitations under the License.
+
+receivers:
+  prometheus:
+    config:
+      scrape_configs:
+        - job_name: 'apisix-monitoring'
+          scrape_interval: 1s
+          metrics_path: "/apisix/prometheus/metrics"
+          static_configs:
+            - targets: ['apisix-serer:9091']
+processors:
+  batch:
+
+exporters:
+  otlp:
+    endpoint: oap:11800
+    tls:
+      insecure: true
+service:
+  pipelines:
+    metrics:
+      receivers:
+        - prometheus
+      processors:
+        - batch
+      exporters:
+        - otlp

Review Comment:
   Let's add a logging exporter with debug level so when it failed we can have some logs to diagnose


--
This is an automated message from the Apache Git Service.
To respond to the message, please log on to GitHub and use the
URL above to go to the specific comment.

To unsubscribe, e-mail: notifications-unsubscribe@skywalking.apache.org

For queries about this service, please contact Infrastructure at:
users@infra.apache.org
[GitHub] [skywalking] pg-yang commented on pull request #9725: Add APISIX metrics monitoring
Posted by GitBox <gi...@apache.org>.
pg-yang commented on PR #9725:
URL: https://github.com/apache/skywalking/pull/9725#issuecomment-1265142862
```
# TYPE apisix_bandwidth counter
apisix_bandwidth{type="egress",route="routes#1",service="1",consumer="",node="172.18.0.3"} 27379040
apisix_bandwidth{type="ingress",route="routes#1",service="1",consumer="",node="172.18.0.3"} 12066880
```
Metrics with empty route/node means don't match any router/node
Above metrics (in service level ) only display metrics which mismatch route/node , also means these metrics would be empty if apisix always could find an appropriate upstream/node . We could put these metrics as error metrics , such as 404, 502(gateway level)
Sorry
--
This is an automated message from the Apache Git Service.
To respond to the message, please log on to GitHub and use the
URL above to go to the specific comment.
To unsubscribe, e-mail: notifications-unsubscribe@skywalking.apache.org
For queries about this service, please contact Infrastructure at:
users@infra.apache.org
[GitHub] [skywalking] pg-yang commented on pull request #9725: Add APISIX metrics monitoring
Posted by GitBox <gi...@apache.org>.
pg-yang commented on PR #9725:
URL: https://github.com/apache/skywalking/pull/9725#issuecomment-1265635426
> * Is there any real case about no `node`? That seems a bug rather than a metric.
Not bug , APISIX prometheus doc show the describe such as `route_id of the matched Route with request. Defaults to an empty string if the Routes don't match.` .
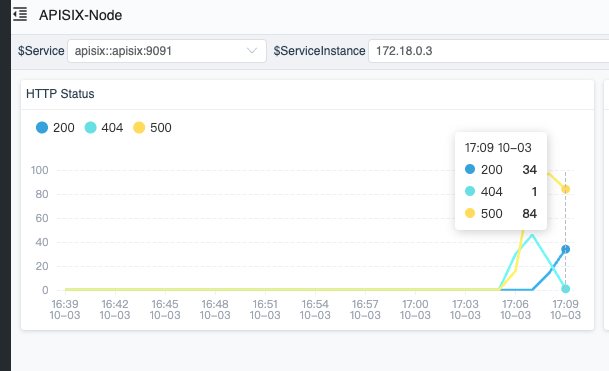
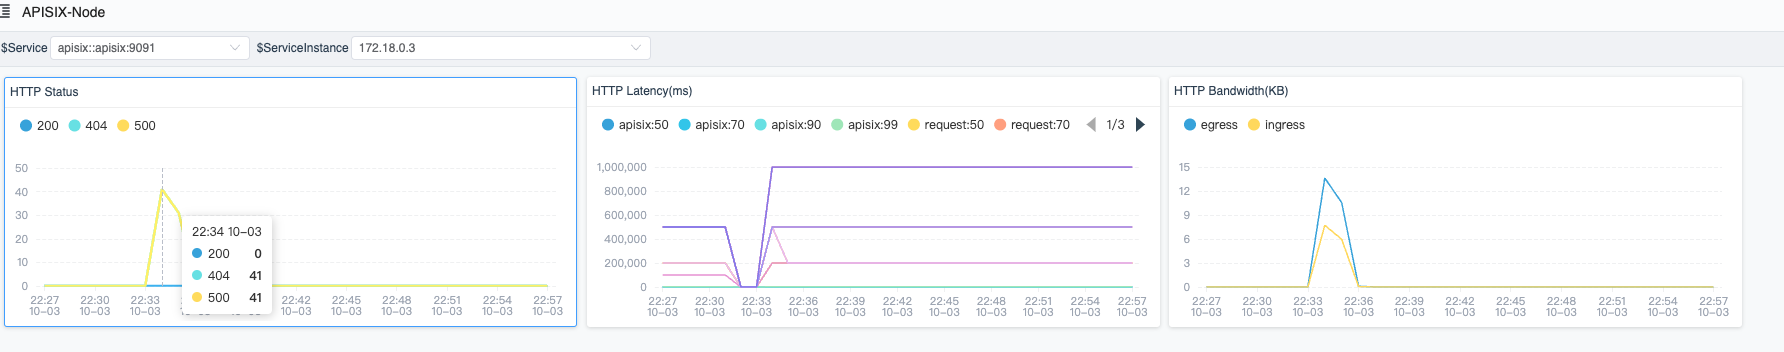
Currently only 404 in gateway level could produce empty node/route , my local test data :
```
apisix_bandwidth{type="egress",route="",service="",consumer="",node=""} 364000
apisix_bandwidth{type="egress",route="routes#1",service="1",consumer="",node="172.18.0.3"} 682000
apisix_bandwidth{type="egress",route="routes#3",service="3",consumer="",node=""} 764000
apisix_bandwidth{type="ingress",route="",service="",consumer="",node=""} 192000
apisix_bandwidth{type="ingress",route="routes#1",service="1",consumer="",node="172.18.0.3"} 386000
apisix_bandwidth{type="ingress",route="routes#3",service="3",consumer="",node=""} 192000
# HELP apisix_http_status HTTP status codes per service in APISIX
# TYPE apisix_http_status counter
apisix_http_status{code="404",route="",matched_uri="",matched_host="",service="",consumer="",node=""} 2000
apisix_http_status{code="404",route="routes#1",matched_uri="/service-a/*",matched_host="",service="1",consumer="",node="172.18.0.3"} 2000
apisix_http_status{code="500",route="routes#1",matched_uri="/service-a/*",matched_host="",service="1",consumer="",node="172.18.0.3"} 2000
apisix_http_status{code="503",route="routes#3",matched_uri="/service-c/*",matched_host="",service="3",consumer="",node=""} 2000
```
> You could aggregate all not-null route and node metrics as the global one.
I would aggregate all metrics as global metrics , don't filter any tag .
> Showing the no route as the no route rule metrics
In no rule case, latency should be nano-sec rather than traditional ms. 1ms is too slow for a request w/o route rule, right?
I would add a new metrics for displaying http status which request couldn't match any route , name like `HTTP status (route mismatched)` . I think displaying latency , bandwidth for invalid request is meaningless , `HTTP status (route mismatched)` is enough to notice user
--
This is an automated message from the Apache Git Service.
To respond to the message, please log on to GitHub and use the
URL above to go to the specific comment.
To unsubscribe, e-mail: notifications-unsubscribe@skywalking.apache.org
For queries about this service, please contact Infrastructure at:
users@infra.apache.org
[GitHub] [skywalking] wu-sheng commented on pull request #9725: Add APISIX metrics monitoring
Posted by GitBox <gi...@apache.org>.
wu-sheng commented on PR #9725:
URL: https://github.com/apache/skywalking/pull/9725#issuecomment-1264653282

   Others are good to me, wait for https://github.com/apache/skywalking/pull/9725#discussion_r985197392 conclusion.


--
This is an automated message from the Apache Git Service.
To respond to the message, please log on to GitHub and use the
URL above to go to the specific comment.

To unsubscribe, e-mail: notifications-unsubscribe@skywalking.apache.org

For queries about this service, please contact Infrastructure at:
users@infra.apache.org
[GitHub] [skywalking] kezhenxu94 commented on a diff in pull request #9725: Add APISIX metrics monitoring
Posted by GitBox <gi...@apache.org>.
kezhenxu94 commented on code in PR #9725:
URL: https://github.com/apache/skywalking/pull/9725#discussion_r985196182


##########
docs/en/concepts-and-designs/mal.md:
##########
@@ -164,7 +164,7 @@ These operations can be used to aggregate overall label dimensions or preserve d
 Example expression:

 ```
-instance_trace_count.sum(by: ['az'])
+instance_trace_count.sum(['az'])

Review Comment:
   This is the language spec of Groovy. The parameter name of sum function is by, which can be omitted or can be added explicitly


--
This is an automated message from the Apache Git Service.
To respond to the message, please log on to GitHub and use the
URL above to go to the specific comment.

To unsubscribe, e-mail: notifications-unsubscribe@skywalking.apache.org

For queries about this service, please contact Infrastructure at:
users@infra.apache.org
[GitHub] [skywalking] pg-yang commented on a diff in pull request #9725: Add APISIX metrics monitoring
Posted by GitBox <gi...@apache.org>.
pg-yang commented on code in PR #9725:
URL: https://github.com/apache/skywalking/pull/9725#discussion_r985234762


##########
oap-server/server-starter/src/main/resources/otel-rules/apisix.yaml:
##########
@@ -0,0 +1,68 @@
+# Licensed to the Apache Software Foundation (ASF) under one or more
+# contributor license agreements.  See the NOTICE file distributed with
+# this work for additional information regarding copyright ownership.
+# The ASF licenses this file to You under the Apache License, Version 2.0
+# (the "License"); you may not use this file except in compliance with
+# the License.  You may obtain a copy of the License at
+#
+#     http://www.apache.org/licenses/LICENSE-2.0
+#
+# Unless required by applicable law or agreed to in writing, software
+# distributed under the License is distributed on an "AS IS" BASIS,
+# WITHOUT WARRANTIES OR CONDITIONS OF ANY KIND, either express or implied.
+# See the License for the specific language governing permissions and
+# limitations under the License.
+
+# This will parse a textual representation of a duration. The formats
+# accepted are based on the ISO-8601 duration format {@code PnDTnHnMn.nS}
+# with days considered to be exactly 24 hours.
+# <p>
+# Examples:
+# <pre>
+#    "PT20.345S" -- parses as "20.345 seconds"
+#    "PT15M"     -- parses as "15 minutes" (where a minute is 60 seconds)
+#    "PT10H"     -- parses as "10 hours" (where an hour is 3600 seconds)
+#    "P2D"       -- parses as "2 days" (where a day is 24 hours or 86400 seconds)
+#    "P2DT3H4M"  -- parses as "2 days, 3 hours and 4 minutes"
+#    "P-6H3M"    -- parses as "-6 hours and +3 minutes"
+#    "-P6H3M"    -- parses as "-6 hours and -3 minutes"
+#    "-P-6H+3M"  -- parses as "+6 hours and -3 minutes"
+# </pre>
+filter: "{ tags -> tags.job_name == 'apisix-monitoring' }" # The OpenTelemetry job name
+expPrefix:  tag({tags -> tags.host_name = 'apisix::' + tags.service_instance_id})
+expSuffix:
+metricPrefix: meter_apisix
+metricsRules:
+  # apisix
+  - name: sv_http_connections
+    exp: apisix_nginx_http_current_connections.sum(['state','host_name']).service(['host_name'] , Layer.APISIX)
+  - name: shared_dict_capacity_bytes
+    exp: apisix_shared_dict_capacity_bytes.sum(['name','host_name']).service(['host_name'] , Layer.APISIX)
+  - name: shared_dict_free_space_bytes
+    exp: apisix_shared_dict_free_space_bytes.sum(['name','host_name']).service(['host_name'] , Layer.APISIX)
+  - name: sv_etcd_indexes
+    exp: apisix_etcd_modify_indexes.sum(['key','host_name']).service(['host_name'] , Layer.APISIX)
+  - name: sv_bandwidth
+    exp: apisix_bandwidth.tagEqual('route','').tagEqual('service','').tagEqual('consumer','').tagEqual('node','').sum(['type','host_name']).rate('PT1M').service(['host_name'] , Layer.APISIX)

Review Comment:
   ```
   # HELP apisix_bandwidth Total bandwidth in bytes consumed per service in APISIX
   # TYPE apisix_bandwidth counter
   apisix_bandwidth{type="egress",route="",service="",consumer="",node=""} 678
   apisix_bandwidth{type="egress",route="routes#1",service="1",consumer="",node="127.0.0.1"} 678
   apisix_bandwidth{type="ingress",route="",service="",consumer="",node=""} 627
   apisix_bandwidth{type="ingress",route="routes#1",service="1",consumer="",node="127.0.0.1"} 252
   ```
   Means  the  metrics faces  to global  rather than special node/route .
   And  `tagEqual('consumer','')` should be removed . I would update soon


--
This is an automated message from the Apache Git Service.
To respond to the message, please log on to GitHub and use the
URL above to go to the specific comment.

To unsubscribe, e-mail: notifications-unsubscribe@skywalking.apache.org

For queries about this service, please contact Infrastructure at:
users@infra.apache.org
[GitHub] [skywalking] wu-sheng commented on a diff in pull request #9725: Add APISIX metrics monitoring
Posted by GitBox <gi...@apache.org>.
wu-sheng commented on code in PR #9725:
URL: https://github.com/apache/skywalking/pull/9725#discussion_r985233230


##########
docs/en/setup/backend/backend-apisix-monitoring.md:
##########
@@ -0,0 +1,40 @@
+# APISIX monitoring
+## APISIX  performance from `apisix prometheus plugin`
+SkyWalking leverages OpenTelemetry Collector to transfer the metrics to
+[OpenTelemetry receiver](opentelemetry-receiver.md) and into the [Meter System](./../../concepts-and-designs/meter.md).
+
+### Data flow
+1. [APXSIX prometheus plugin](https://apisix.apache.org/docs/apisix/plugins/prometheus/) collect metrics data from APSIX.
+2. OpenTelemetry Collector fetches metrics from [APXSIX prometheus plugin](https://apisix.apache.org/docs/apisix/plugins/prometheus/) via Prometheus Receiver and pushes metrics to SkyWalking OAP Server via the OpenCensus gRPC Exporter or OpenTelemetry gRPC exporter.

Review Comment:
   ```suggestion
   2. OpenTelemetry Collector fetches metrics from [APXSIX Prometheus plugin](https://apisix.apache.org/docs/apisix/plugins/prometheus/) via Prometheus Receiver and pushes metrics to SkyWalking OAP Server via the OpenCensus gRPC Exporter or OpenTelemetry gRPC exporter.
   ```


--
This is an automated message from the Apache Git Service.
To respond to the message, please log on to GitHub and use the
URL above to go to the specific comment.

To unsubscribe, e-mail: notifications-unsubscribe@skywalking.apache.org

For queries about this service, please contact Infrastructure at:
users@infra.apache.org
[GitHub] [skywalking] wu-sheng commented on a diff in pull request #9725: Add APISIX metrics monitoring
Posted by GitBox <gi...@apache.org>.
wu-sheng commented on code in PR #9725:
URL: https://github.com/apache/skywalking/pull/9725#discussion_r985233165


##########
docs/en/setup/backend/backend-apisix-monitoring.md:
##########
@@ -0,0 +1,40 @@
+# APISIX monitoring
+## APISIX  performance from `apisix prometheus plugin`
+SkyWalking leverages OpenTelemetry Collector to transfer the metrics to
+[OpenTelemetry receiver](opentelemetry-receiver.md) and into the [Meter System](./../../concepts-and-designs/meter.md).
+
+### Data flow
+1. [APXSIX prometheus plugin](https://apisix.apache.org/docs/apisix/plugins/prometheus/) collect metrics data from APSIX.

Review Comment:
   ```suggestion
   1. [APXSIX Prometheus plugin](https://apisix.apache.org/docs/apisix/plugins/prometheus/) collects metrics data from APSIX.
   ```


--
This is an automated message from the Apache Git Service.
To respond to the message, please log on to GitHub and use the
URL above to go to the specific comment.

To unsubscribe, e-mail: notifications-unsubscribe@skywalking.apache.org

For queries about this service, please contact Infrastructure at:
users@infra.apache.org
[GitHub] [skywalking] wu-sheng commented on a diff in pull request #9725: Add APISIX metrics monitoring
Posted by GitBox <gi...@apache.org>.
wu-sheng commented on code in PR #9725:
URL: https://github.com/apache/skywalking/pull/9725#discussion_r985241993


##########
oap-server/server-starter/src/main/resources/otel-rules/apisix.yaml:
##########
@@ -0,0 +1,72 @@
+# Licensed to the Apache Software Foundation (ASF) under one or more
+# contributor license agreements.  See the NOTICE file distributed with
+# this work for additional information regarding copyright ownership.
+# The ASF licenses this file to You under the Apache License, Version 2.0
+# (the "License"); you may not use this file except in compliance with
+# the License.  You may obtain a copy of the License at
+#
+#     http://www.apache.org/licenses/LICENSE-2.0
+#
+# Unless required by applicable law or agreed to in writing, software
+# distributed under the License is distributed on an "AS IS" BASIS,
+# WITHOUT WARRANTIES OR CONDITIONS OF ANY KIND, either express or implied.
+# See the License for the specific language governing permissions and
+# limitations under the License.
+
+# This will parse a textual representation of a duration. The formats
+# accepted are based on the ISO-8601 duration format {@code PnDTnHnMn.nS}
+# with days considered to be exactly 24 hours.
+# <p>
+# Examples:
+# <pre>
+#    "PT20.345S" -- parses as "20.345 seconds"
+#    "PT15M"     -- parses as "15 minutes" (where a minute is 60 seconds)
+#    "PT10H"     -- parses as "10 hours" (where an hour is 3600 seconds)
+#    "P2D"       -- parses as "2 days" (where a day is 24 hours or 86400 seconds)
+#    "P2DT3H4M"  -- parses as "2 days, 3 hours and 4 minutes"
+#    "P-6H3M"    -- parses as "-6 hours and +3 minutes"
+#    "-P6H3M"    -- parses as "-6 hours and -3 minutes"
+#    "-P-6H+3M"  -- parses as "+6 hours and -3 minutes"
+# </pre>
+filter: "{ tags -> tags.job_name == 'apisix-monitoring' }" # The OpenTelemetry job name
+expPrefix:  tag({tags -> tags.host_name = 'apisix::' + tags.service_instance_id})
+expSuffix:
+metricPrefix: meter_apisix
+metricsRules:
+  # Service
+  - name: sv_http_connections
+    exp: apisix_nginx_http_current_connections.sum(['state','host_name']).service(['host_name'] , Layer.APISIX)
+  - name: shared_dict_capacity_bytes
+    exp: apisix_shared_dict_capacity_bytes.sum(['name','host_name']).service(['host_name'] , Layer.APISIX)
+  - name: shared_dict_free_space_bytes
+    exp: apisix_shared_dict_free_space_bytes.sum(['name','host_name']).service(['host_name'] , Layer.APISIX)
+  - name: sv_etcd_indexes
+    exp: apisix_etcd_modify_indexes.sum(['key','host_name']).service(['host_name'] , Layer.APISIX)
+  - name: http_requests_total
+    exp: apisix_http_requests_total.service(['host_name'] , Layer.APISIX)
+    # The metrics which has empty node,route labels represents it faces to global rather than specific node/route

Review Comment:
   ```suggestion
       # The metrics with empty node and route labels represent global metrics rather than for a specific node/route.
   ```


--
This is an automated message from the Apache Git Service.
To respond to the message, please log on to GitHub and use the
URL above to go to the specific comment.

To unsubscribe, e-mail: notifications-unsubscribe@skywalking.apache.org

For queries about this service, please contact Infrastructure at:
users@infra.apache.org
[GitHub] [skywalking] wu-sheng commented on a diff in pull request #9725: Add APISIX metrics monitoring
Posted by GitBox <gi...@apache.org>.
wu-sheng commented on code in PR #9725:
URL: https://github.com/apache/skywalking/pull/9725#discussion_r985234206


##########
oap-server/server-starter/src/main/resources/otel-rules/apisix.yaml:
##########
@@ -0,0 +1,68 @@
+# Licensed to the Apache Software Foundation (ASF) under one or more
+# contributor license agreements.  See the NOTICE file distributed with
+# this work for additional information regarding copyright ownership.
+# The ASF licenses this file to You under the Apache License, Version 2.0
+# (the "License"); you may not use this file except in compliance with
+# the License.  You may obtain a copy of the License at
+#
+#     http://www.apache.org/licenses/LICENSE-2.0
+#
+# Unless required by applicable law or agreed to in writing, software
+# distributed under the License is distributed on an "AS IS" BASIS,
+# WITHOUT WARRANTIES OR CONDITIONS OF ANY KIND, either express or implied.
+# See the License for the specific language governing permissions and
+# limitations under the License.
+
+# This will parse a textual representation of a duration. The formats
+# accepted are based on the ISO-8601 duration format {@code PnDTnHnMn.nS}
+# with days considered to be exactly 24 hours.
+# <p>
+# Examples:
+# <pre>
+#    "PT20.345S" -- parses as "20.345 seconds"
+#    "PT15M"     -- parses as "15 minutes" (where a minute is 60 seconds)
+#    "PT10H"     -- parses as "10 hours" (where an hour is 3600 seconds)
+#    "P2D"       -- parses as "2 days" (where a day is 24 hours or 86400 seconds)
+#    "P2DT3H4M"  -- parses as "2 days, 3 hours and 4 minutes"
+#    "P-6H3M"    -- parses as "-6 hours and +3 minutes"
+#    "-P6H3M"    -- parses as "-6 hours and -3 minutes"
+#    "-P-6H+3M"  -- parses as "+6 hours and -3 minutes"
+# </pre>
+filter: "{ tags -> tags.job_name == 'apisix-monitoring' }" # The OpenTelemetry job name
+expPrefix:  tag({tags -> tags.host_name = 'apisix::' + tags.service_instance_id})
+expSuffix:
+metricPrefix: meter_apisix
+metricsRules:
+  # apisix
+  - name: sv_http_connections
+    exp: apisix_nginx_http_current_connections.sum(['state','host_name']).service(['host_name'] , Layer.APISIX)
+  - name: shared_dict_capacity_bytes
+    exp: apisix_shared_dict_capacity_bytes.sum(['name','host_name']).service(['host_name'] , Layer.APISIX)
+  - name: shared_dict_free_space_bytes
+    exp: apisix_shared_dict_free_space_bytes.sum(['name','host_name']).service(['host_name'] , Layer.APISIX)
+  - name: sv_etcd_indexes
+    exp: apisix_etcd_modify_indexes.sum(['key','host_name']).service(['host_name'] , Layer.APISIX)
+  - name: sv_bandwidth
+    exp: apisix_bandwidth.tagEqual('route','').tagEqual('service','').tagEqual('consumer','').tagEqual('node','').sum(['type','host_name']).rate('PT1M').service(['host_name'] , Layer.APISIX)

Review Comment:
   What do these `tagEqual` empty string mean?


--
This is an automated message from the Apache Git Service.
To respond to the message, please log on to GitHub and use the
URL above to go to the specific comment.

To unsubscribe, e-mail: notifications-unsubscribe@skywalking.apache.org

For queries about this service, please contact Infrastructure at:
users@infra.apache.org
[GitHub] [skywalking] pg-yang commented on a diff in pull request #9725: Add APISIX metrics monitoring
Posted by GitBox <gi...@apache.org>.
pg-yang commented on code in PR #9725:
URL: https://github.com/apache/skywalking/pull/9725#discussion_r985318374


##########
oap-server/server-starter/src/main/resources/otel-rules/apisix.yaml:
##########
@@ -0,0 +1,68 @@
+# Licensed to the Apache Software Foundation (ASF) under one or more
+# contributor license agreements.  See the NOTICE file distributed with
+# this work for additional information regarding copyright ownership.
+# The ASF licenses this file to You under the Apache License, Version 2.0
+# (the "License"); you may not use this file except in compliance with
+# the License.  You may obtain a copy of the License at
+#
+#     http://www.apache.org/licenses/LICENSE-2.0
+#
+# Unless required by applicable law or agreed to in writing, software
+# distributed under the License is distributed on an "AS IS" BASIS,
+# WITHOUT WARRANTIES OR CONDITIONS OF ANY KIND, either express or implied.
+# See the License for the specific language governing permissions and
+# limitations under the License.
+
+# This will parse a textual representation of a duration. The formats
+# accepted are based on the ISO-8601 duration format {@code PnDTnHnMn.nS}
+# with days considered to be exactly 24 hours.
+# <p>
+# Examples:
+# <pre>
+#    "PT20.345S" -- parses as "20.345 seconds"
+#    "PT15M"     -- parses as "15 minutes" (where a minute is 60 seconds)
+#    "PT10H"     -- parses as "10 hours" (where an hour is 3600 seconds)
+#    "P2D"       -- parses as "2 days" (where a day is 24 hours or 86400 seconds)
+#    "P2DT3H4M"  -- parses as "2 days, 3 hours and 4 minutes"
+#    "P-6H3M"    -- parses as "-6 hours and +3 minutes"
+#    "-P6H3M"    -- parses as "-6 hours and -3 minutes"
+#    "-P-6H+3M"  -- parses as "+6 hours and -3 minutes"
+# </pre>
+filter: "{ tags -> tags.job_name == 'apisix-monitoring' }" # The OpenTelemetry job name
+expPrefix:  tag({tags -> tags.host_name = 'apisix::' + tags.service_instance_id})
+expSuffix:
+metricPrefix: meter_apisix
+metricsRules:
+  # apisix
+  - name: sv_http_connections
+    exp: apisix_nginx_http_current_connections.sum(['state','host_name']).service(['host_name'] , Layer.APISIX)
+  - name: shared_dict_capacity_bytes
+    exp: apisix_shared_dict_capacity_bytes.sum(['name','host_name']).service(['host_name'] , Layer.APISIX)
+  - name: shared_dict_free_space_bytes
+    exp: apisix_shared_dict_free_space_bytes.sum(['name','host_name']).service(['host_name'] , Layer.APISIX)
+  - name: sv_etcd_indexes
+    exp: apisix_etcd_modify_indexes.sum(['key','host_name']).service(['host_name'] , Layer.APISIX)
+  - name: sv_bandwidth
+    exp: apisix_bandwidth.tagEqual('route','').tagEqual('service','').tagEqual('consumer','').tagEqual('node','').sum(['type','host_name']).rate('PT1M').service(['host_name'] , Layer.APISIX)
+  - name: sv_http_status
+    exp: apisix_http_status.tagEqual('route','').tagEqual('matched_uri','').tagEqual('matched_host','').tagEqual('service','').tagEqual('consumer','').tagEqual('node','').sum(['code','host_name']).rate('PT1M').service(['host_name'] , Layer.APISIX)

Review Comment:
   > Does `apisix_http_status` include all response codes? Or just some >= 300?

   All code


--
This is an automated message from the Apache Git Service.
To respond to the message, please log on to GitHub and use the
URL above to go to the specific comment.

To unsubscribe, e-mail: notifications-unsubscribe@skywalking.apache.org

For queries about this service, please contact Infrastructure at:
users@infra.apache.org
[GitHub] [skywalking] wu-sheng commented on a diff in pull request #9725: Add APISIX metrics monitoring
Posted by GitBox <gi...@apache.org>.
wu-sheng commented on code in PR #9725:
URL: https://github.com/apache/skywalking/pull/9725#discussion_r985248966


##########
docs/en/concepts-and-designs/mal.md:
##########
@@ -164,7 +164,7 @@ These operations can be used to aggregate overall label dimensions or preserve d
 Example expression:

 ```
-instance_trace_count.sum(by: ['az'])
+instance_trace_count.sum(['az'])

Review Comment:
   @kezhenxu94 @hanahmily Need another confirmation.


##########
oap-server/server-starter/src/main/resources/otel-rules/apisix.yaml:
##########
@@ -0,0 +1,68 @@
+# Licensed to the Apache Software Foundation (ASF) under one or more
+# contributor license agreements.  See the NOTICE file distributed with
+# this work for additional information regarding copyright ownership.
+# The ASF licenses this file to You under the Apache License, Version 2.0
+# (the "License"); you may not use this file except in compliance with
+# the License.  You may obtain a copy of the License at
+#
+#     http://www.apache.org/licenses/LICENSE-2.0
+#
+# Unless required by applicable law or agreed to in writing, software
+# distributed under the License is distributed on an "AS IS" BASIS,
+# WITHOUT WARRANTIES OR CONDITIONS OF ANY KIND, either express or implied.
+# See the License for the specific language governing permissions and
+# limitations under the License.
+
+# This will parse a textual representation of a duration. The formats
+# accepted are based on the ISO-8601 duration format {@code PnDTnHnMn.nS}
+# with days considered to be exactly 24 hours.
+# <p>
+# Examples:
+# <pre>
+#    "PT20.345S" -- parses as "20.345 seconds"
+#    "PT15M"     -- parses as "15 minutes" (where a minute is 60 seconds)
+#    "PT10H"     -- parses as "10 hours" (where an hour is 3600 seconds)
+#    "P2D"       -- parses as "2 days" (where a day is 24 hours or 86400 seconds)
+#    "P2DT3H4M"  -- parses as "2 days, 3 hours and 4 minutes"
+#    "P-6H3M"    -- parses as "-6 hours and +3 minutes"
+#    "-P6H3M"    -- parses as "-6 hours and -3 minutes"
+#    "-P-6H+3M"  -- parses as "+6 hours and -3 minutes"
+# </pre>
+filter: "{ tags -> tags.job_name == 'apisix-monitoring' }" # The OpenTelemetry job name
+expPrefix:  tag({tags -> tags.host_name = 'apisix::' + tags.service_instance_id})
+expSuffix:
+metricPrefix: meter_apisix
+metricsRules:
+  # apisix
+  - name: sv_http_connections
+    exp: apisix_nginx_http_current_connections.sum(['state','host_name']).service(['host_name'] , Layer.APISIX)
+  - name: shared_dict_capacity_bytes
+    exp: apisix_shared_dict_capacity_bytes.sum(['name','host_name']).service(['host_name'] , Layer.APISIX)
+  - name: shared_dict_free_space_bytes
+    exp: apisix_shared_dict_free_space_bytes.sum(['name','host_name']).service(['host_name'] , Layer.APISIX)
+  - name: sv_etcd_indexes
+    exp: apisix_etcd_modify_indexes.sum(['key','host_name']).service(['host_name'] , Layer.APISIX)
+  - name: sv_bandwidth
+    exp: apisix_bandwidth.tagEqual('route','').tagEqual('service','').tagEqual('consumer','').tagEqual('node','').sum(['type','host_name']).rate('PT1M').service(['host_name'] , Layer.APISIX)
+  - name: sv_http_status
+    exp: apisix_http_status.tagEqual('route','').tagEqual('matched_uri','').tagEqual('matched_host','').tagEqual('service','').tagEqual('consumer','').tagEqual('node','').sum(['code','host_name']).rate('PT1M').service(['host_name'] , Layer.APISIX)

Review Comment:
   Is this HTTP status or APISIX Server status?


--
This is an automated message from the Apache Git Service.
To respond to the message, please log on to GitHub and use the
URL above to go to the specific comment.

To unsubscribe, e-mail: notifications-unsubscribe@skywalking.apache.org

For queries about this service, please contact Infrastructure at:
users@infra.apache.org
[GitHub] [skywalking] wu-sheng commented on a diff in pull request #9725: Add APISIX metrics monitoring
Posted by GitBox <gi...@apache.org>.
wu-sheng commented on code in PR #9725:
URL: https://github.com/apache/skywalking/pull/9725#discussion_r985188339


##########
docs/en/concepts-and-designs/mal.md:
##########
@@ -164,7 +164,7 @@ These operations can be used to aggregate overall label dimensions or preserve d
 Example expression:

 ```
-instance_trace_count.sum(by: ['az'])
+instance_trace_count.sum(['az'])

Review Comment:
   @hanahmily @wankai123 Do you remember when we had by as keyword? I remember it doesn't there from beginning.


--
This is an automated message from the Apache Git Service.
To respond to the message, please log on to GitHub and use the
URL above to go to the specific comment.

To unsubscribe, e-mail: notifications-unsubscribe@skywalking.apache.org

For queries about this service, please contact Infrastructure at:
users@infra.apache.org
[GitHub] [skywalking] sonatype-lift[bot] commented on pull request #9725: Add APISIX metrics monitoring
Posted by GitBox <gi...@apache.org>.
sonatype-lift[bot] commented on PR #9725:
URL: https://github.com/apache/skywalking/pull/9725#issuecomment-1264566590

   :warning: **6 God Classes** were detected by Lift in this project. [Visit the Lift web console](https://lift.sonatype.com/results/github.com/apache/skywalking/01GEBMWYKXS4AMPMTJ5J7GQTR6?tab=technical-debt&utm_source=github.com&utm_campaign=lift-comment&utm_content=apache\%20skywalking) for more details.


--
This is an automated message from the Apache Git Service.
To respond to the message, please log on to GitHub and use the
URL above to go to the specific comment.

To unsubscribe, e-mail: notifications-unsubscribe@skywalking.apache.org

For queries about this service, please contact Infrastructure at:
users@infra.apache.org
[GitHub] [skywalking] pg-yang commented on pull request #9725: Add APISIX metrics monitoring
Posted by GitBox <gi...@apache.org>.
pg-yang commented on PR #9725:
URL: https://github.com/apache/skywalking/pull/9725#issuecomment-1264563570

   Yes,   UI module ,` changes.md`  have updated to contain recent commits in UI


--
This is an automated message from the Apache Git Service.
To respond to the message, please log on to GitHub and use the
URL above to go to the specific comment.

To unsubscribe, e-mail: notifications-unsubscribe@skywalking.apache.org

For queries about this service, please contact Infrastructure at:
users@infra.apache.org
[GitHub] [skywalking] wu-sheng commented on pull request #9725: Add APISIX metrics monitoring
Posted by GitBox <gi...@apache.org>.
wu-sheng commented on PR #9725:
URL: https://github.com/apache/skywalking/pull/9725#issuecomment-1265168132

   In no `rule` case, latency should be `nano-sec` rather than traditional `ms`. `1ms` is too slow for a request w/o route rule, right?


--
This is an automated message from the Apache Git Service.
To respond to the message, please log on to GitHub and use the
URL above to go to the specific comment.

To unsubscribe, e-mail: notifications-unsubscribe@skywalking.apache.org

For queries about this service, please contact Infrastructure at:
users@infra.apache.org
[GitHub] [skywalking] wu-sheng commented on pull request #9725: Add APISIX metrics monitoring
Posted by GitBox <gi...@apache.org>.
wu-sheng commented on PR #9725:
URL: https://github.com/apache/skywalking/pull/9725#issuecomment-1265658427

   > Not bug , APISIX prometheus doc show the describe such as route_id of the matched Route with request. Defaults to an empty string if the Routes don't match. .

   Then this should be `Not matched route trend`.

   > I would aggregate all metrics as global metrics , don't filter any tag .

   You should filter to separate valid request(having matched route) and invalid request

   >I think displaying latency , bandwidth for invalid request is meaningless , HTTP status (route mismatched) is enough to notice user

   Actually, they are meaning full. They could show whether there is a serious DDoS(or similar) attack. Bandwidth is a serious cost even with low request load, as well as latency because high latency would mean the CPU of APISIX would be cost and used for the meaningless requests.

   > And changing latency unit from ms to nano-sec is not a good choice . because OpenTelemetryMetricHandler have already convert nano-sec to ms .

   But I guess it is a double, we are still safe to convert it back. We keep precision as integer, too quick response would always be **0**.


--
This is an automated message from the Apache Git Service.
To respond to the message, please log on to GitHub and use the
URL above to go to the specific comment.

To unsubscribe, e-mail: notifications-unsubscribe@skywalking.apache.org

For queries about this service, please contact Infrastructure at:
users@infra.apache.org
[GitHub] [skywalking] pg-yang commented on a diff in pull request #9725: Add APISIX metrics monitoring
Posted by GitBox <gi...@apache.org>.
pg-yang commented on code in PR #9725:
URL: https://github.com/apache/skywalking/pull/9725#discussion_r985274062


##########
oap-server/server-starter/src/main/resources/otel-rules/apisix.yaml:
##########
@@ -0,0 +1,68 @@
+# Licensed to the Apache Software Foundation (ASF) under one or more
+# contributor license agreements.  See the NOTICE file distributed with
+# this work for additional information regarding copyright ownership.
+# The ASF licenses this file to You under the Apache License, Version 2.0
+# (the "License"); you may not use this file except in compliance with
+# the License.  You may obtain a copy of the License at
+#
+#     http://www.apache.org/licenses/LICENSE-2.0
+#
+# Unless required by applicable law or agreed to in writing, software
+# distributed under the License is distributed on an "AS IS" BASIS,
+# WITHOUT WARRANTIES OR CONDITIONS OF ANY KIND, either express or implied.
+# See the License for the specific language governing permissions and
+# limitations under the License.
+
+# This will parse a textual representation of a duration. The formats
+# accepted are based on the ISO-8601 duration format {@code PnDTnHnMn.nS}
+# with days considered to be exactly 24 hours.
+# <p>
+# Examples:
+# <pre>
+#    "PT20.345S" -- parses as "20.345 seconds"
+#    "PT15M"     -- parses as "15 minutes" (where a minute is 60 seconds)
+#    "PT10H"     -- parses as "10 hours" (where an hour is 3600 seconds)
+#    "P2D"       -- parses as "2 days" (where a day is 24 hours or 86400 seconds)
+#    "P2DT3H4M"  -- parses as "2 days, 3 hours and 4 minutes"
+#    "P-6H3M"    -- parses as "-6 hours and +3 minutes"
+#    "-P6H3M"    -- parses as "-6 hours and -3 minutes"
+#    "-P-6H+3M"  -- parses as "+6 hours and -3 minutes"
+# </pre>
+filter: "{ tags -> tags.job_name == 'apisix-monitoring' }" # The OpenTelemetry job name
+expPrefix:  tag({tags -> tags.host_name = 'apisix::' + tags.service_instance_id})
+expSuffix:
+metricPrefix: meter_apisix
+metricsRules:
+  # apisix
+  - name: sv_http_connections
+    exp: apisix_nginx_http_current_connections.sum(['state','host_name']).service(['host_name'] , Layer.APISIX)
+  - name: shared_dict_capacity_bytes
+    exp: apisix_shared_dict_capacity_bytes.sum(['name','host_name']).service(['host_name'] , Layer.APISIX)
+  - name: shared_dict_free_space_bytes
+    exp: apisix_shared_dict_free_space_bytes.sum(['name','host_name']).service(['host_name'] , Layer.APISIX)
+  - name: sv_etcd_indexes
+    exp: apisix_etcd_modify_indexes.sum(['key','host_name']).service(['host_name'] , Layer.APISIX)
+  - name: sv_bandwidth
+    exp: apisix_bandwidth.tagEqual('route','').tagEqual('service','').tagEqual('consumer','').tagEqual('node','').sum(['type','host_name']).rate('PT1M').service(['host_name'] , Layer.APISIX)
+  - name: sv_http_status
+    exp: apisix_http_status.tagEqual('route','').tagEqual('matched_uri','').tagEqual('matched_host','').tagEqual('service','').tagEqual('consumer','').tagEqual('node','').sum(['code','host_name']).rate('PT1M').service(['host_name'] , Layer.APISIX)

Review Comment:
   > I think `404 per second` not meaning the percentage of the `404`

   You are right  , I  misunderstood the rate   . In my case , `rate= (http_status_times_upper-http_status_times_lower) / time_diff_in_second ` for every kind  http  status . How  about  choosing `times` as unit ?

   > Let's go back to the original, why 404 matters?

   404 dose not matter  , There are two problem
   1. choose an appropriate unit
   2. the screenshot only display 0/1  , it's  strange

   Anyway , I  would  test more  times , and  add more case to  screenshot


--
This is an automated message from the Apache Git Service.
To respond to the message, please log on to GitHub and use the
URL above to go to the specific comment.

To unsubscribe, e-mail: notifications-unsubscribe@skywalking.apache.org

For queries about this service, please contact Infrastructure at:
users@infra.apache.org
[GitHub] [skywalking] pg-yang commented on pull request #9725: Add APISIX metrics monitoring
Posted by GitBox <gi...@apache.org>.
pg-yang commented on PR #9725:
URL: https://github.com/apache/skywalking/pull/9725#issuecomment-1265674419

   ACK , Let's  distinguish valid and invalid  request  for http status , latency , bandwidth  in service level .

   > But I guess it is a double, we are still safe to convert it back. We keep precision as integer, too quick response would always be 0.

   My fault , [OpenTelemetryMetricHandler.java](https://github.com/apache/skywalking/blob/5ae4c125f8cbeb7c53fed4269ca110eeac9aa661/oap-server/server-receiver-plugin/otel-receiver-plugin/src/main/java/org/apache/skywalking/oap/server/receiver/otel/otlp/OpenTelemetryMetricHandler.java) didn't change value .

   And latency unit is ms , it's defined by apisix prometheus plugin , so we couldn't convert it   nano-sec

   ```
   # HELP apisix_http_latency HTTP request latency in milliseconds per service in APISIX
   # TYPE apisix_http_latency histogram
   apisix_http_latency_bucket{type="apisix",route="",service="",consumer="",node="",le="1"} 2000

   ```


--
This is an automated message from the Apache Git Service.
To respond to the message, please log on to GitHub and use the
URL above to go to the specific comment.

To unsubscribe, e-mail: notifications-unsubscribe@skywalking.apache.org

For queries about this service, please contact Infrastructure at:
users@infra.apache.org
[GitHub] [skywalking] wu-sheng commented on a diff in pull request #9725: Add APISIX metrics monitoring
Posted by GitBox <gi...@apache.org>.
wu-sheng commented on code in PR #9725:
URL: https://github.com/apache/skywalking/pull/9725#discussion_r985234966


##########
oap-server/server-starter/src/main/resources/otel-rules/apisix.yaml:
##########
@@ -0,0 +1,68 @@
+# Licensed to the Apache Software Foundation (ASF) under one or more
+# contributor license agreements.  See the NOTICE file distributed with
+# this work for additional information regarding copyright ownership.
+# The ASF licenses this file to You under the Apache License, Version 2.0
+# (the "License"); you may not use this file except in compliance with
+# the License.  You may obtain a copy of the License at
+#
+#     http://www.apache.org/licenses/LICENSE-2.0
+#
+# Unless required by applicable law or agreed to in writing, software
+# distributed under the License is distributed on an "AS IS" BASIS,
+# WITHOUT WARRANTIES OR CONDITIONS OF ANY KIND, either express or implied.
+# See the License for the specific language governing permissions and
+# limitations under the License.
+
+# This will parse a textual representation of a duration. The formats
+# accepted are based on the ISO-8601 duration format {@code PnDTnHnMn.nS}
+# with days considered to be exactly 24 hours.
+# <p>
+# Examples:
+# <pre>
+#    "PT20.345S" -- parses as "20.345 seconds"
+#    "PT15M"     -- parses as "15 minutes" (where a minute is 60 seconds)
+#    "PT10H"     -- parses as "10 hours" (where an hour is 3600 seconds)
+#    "P2D"       -- parses as "2 days" (where a day is 24 hours or 86400 seconds)
+#    "P2DT3H4M"  -- parses as "2 days, 3 hours and 4 minutes"
+#    "P-6H3M"    -- parses as "-6 hours and +3 minutes"
+#    "-P6H3M"    -- parses as "-6 hours and -3 minutes"
+#    "-P-6H+3M"  -- parses as "+6 hours and -3 minutes"
+# </pre>
+filter: "{ tags -> tags.job_name == 'apisix-monitoring' }" # The OpenTelemetry job name
+expPrefix:  tag({tags -> tags.host_name = 'apisix::' + tags.service_instance_id})
+expSuffix:
+metricPrefix: meter_apisix
+metricsRules:
+  # apisix
+  - name: sv_http_connections
+    exp: apisix_nginx_http_current_connections.sum(['state','host_name']).service(['host_name'] , Layer.APISIX)
+  - name: shared_dict_capacity_bytes
+    exp: apisix_shared_dict_capacity_bytes.sum(['name','host_name']).service(['host_name'] , Layer.APISIX)
+  - name: shared_dict_free_space_bytes
+    exp: apisix_shared_dict_free_space_bytes.sum(['name','host_name']).service(['host_name'] , Layer.APISIX)
+  - name: sv_etcd_indexes
+    exp: apisix_etcd_modify_indexes.sum(['key','host_name']).service(['host_name'] , Layer.APISIX)
+  - name: sv_bandwidth
+    exp: apisix_bandwidth.tagEqual('route','').tagEqual('service','').tagEqual('consumer','').tagEqual('node','').sum(['type','host_name']).rate('PT1M').service(['host_name'] , Layer.APISIX)

Review Comment:
   I see, could you put some explanation on the YAML? We need to make this clear for ppl reading this in the future.


--
This is an automated message from the Apache Git Service.
To respond to the message, please log on to GitHub and use the
URL above to go to the specific comment.

To unsubscribe, e-mail: notifications-unsubscribe@skywalking.apache.org

For queries about this service, please contact Infrastructure at:
users@infra.apache.org
[GitHub] [skywalking] pg-yang commented on a diff in pull request #9725: Add APISIX metrics monitoring
Posted by GitBox <gi...@apache.org>.
pg-yang commented on code in PR #9725:
URL: https://github.com/apache/skywalking/pull/9725#discussion_r985256847
##########
oap-server/server-starter/src/main/resources/otel-rules/apisix.yaml:
##########
@@ -0,0 +1,68 @@
+# Licensed to the Apache Software Foundation (ASF) under one or more
+# contributor license agreements. See the NOTICE file distributed with
+# this work for additional information regarding copyright ownership.
+# The ASF licenses this file to You under the Apache License, Version 2.0
+# (the "License"); you may not use this file except in compliance with
+# the License. You may obtain a copy of the License at
+#
+# http://www.apache.org/licenses/LICENSE-2.0
+#
+# Unless required by applicable law or agreed to in writing, software
+# distributed under the License is distributed on an "AS IS" BASIS,
+# WITHOUT WARRANTIES OR CONDITIONS OF ANY KIND, either express or implied.
+# See the License for the specific language governing permissions and
+# limitations under the License.
+
+# This will parse a textual representation of a duration. The formats
+# accepted are based on the ISO-8601 duration format {@code PnDTnHnMn.nS}
+# with days considered to be exactly 24 hours.
+# <p>
+# Examples:
+# <pre>
+# "PT20.345S" -- parses as "20.345 seconds"
+# "PT15M" -- parses as "15 minutes" (where a minute is 60 seconds)
+# "PT10H" -- parses as "10 hours" (where an hour is 3600 seconds)
+# "P2D" -- parses as "2 days" (where a day is 24 hours or 86400 seconds)
+# "P2DT3H4M" -- parses as "2 days, 3 hours and 4 minutes"
+# "P-6H3M" -- parses as "-6 hours and +3 minutes"
+# "-P6H3M" -- parses as "-6 hours and -3 minutes"
+# "-P-6H+3M" -- parses as "+6 hours and -3 minutes"
+# </pre>
+filter: "{ tags -> tags.job_name == 'apisix-monitoring' }" # The OpenTelemetry job name
+expPrefix: tag({tags -> tags.host_name = 'apisix::' + tags.service_instance_id})
+expSuffix:
+metricPrefix: meter_apisix
+metricsRules:
+ # apisix
+ - name: sv_http_connections
+ exp: apisix_nginx_http_current_connections.sum(['state','host_name']).service(['host_name'] , Layer.APISIX)
+ - name: shared_dict_capacity_bytes
+ exp: apisix_shared_dict_capacity_bytes.sum(['name','host_name']).service(['host_name'] , Layer.APISIX)
+ - name: shared_dict_free_space_bytes
+ exp: apisix_shared_dict_free_space_bytes.sum(['name','host_name']).service(['host_name'] , Layer.APISIX)
+ - name: sv_etcd_indexes
+ exp: apisix_etcd_modify_indexes.sum(['key','host_name']).service(['host_name'] , Layer.APISIX)
+ - name: sv_bandwidth
+ exp: apisix_bandwidth.tagEqual('route','').tagEqual('service','').tagEqual('consumer','').tagEqual('node','').sum(['type','host_name']).rate('PT1M').service(['host_name'] , Layer.APISIX)
+ - name: sv_http_status
+ exp: apisix_http_status.tagEqual('route','').tagEqual('matched_uri','').tagEqual('matched_host','').tagEqual('service','').tagEqual('consumer','').tagEqual('node','').sum(['code','host_name']).rate('PT1M').service(['host_name'] , Layer.APISIX)
Review Comment:
> Is this HTTP status or APISIX Server status?
Yes , TYPE is counter , I want get the rate
```
apisix_http_requests_total 27
# HELP apisix_http_status HTTP status codes per service in APISIX
# TYPE apisix_http_status counter
apisix_http_status{code="404",route="",matched_uri="",matched_host="",service="",consumer="",node=""} 3
apisix_http_status{code="404",route="routes#1",matched_uri="/self/*",matched_host="",service="1",consumer="",node="127.0.0.1"} 3
```
##########
oap-server/server-starter/src/main/resources/otel-rules/apisix.yaml:
##########
@@ -0,0 +1,68 @@
+# Licensed to the Apache Software Foundation (ASF) under one or more
+# contributor license agreements. See the NOTICE file distributed with
+# this work for additional information regarding copyright ownership.
+# The ASF licenses this file to You under the Apache License, Version 2.0
+# (the "License"); you may not use this file except in compliance with
+# the License. You may obtain a copy of the License at
+#
+# http://www.apache.org/licenses/LICENSE-2.0
+#
+# Unless required by applicable law or agreed to in writing, software
+# distributed under the License is distributed on an "AS IS" BASIS,
+# WITHOUT WARRANTIES OR CONDITIONS OF ANY KIND, either express or implied.
+# See the License for the specific language governing permissions and
+# limitations under the License.
+
+# This will parse a textual representation of a duration. The formats
+# accepted are based on the ISO-8601 duration format {@code PnDTnHnMn.nS}
+# with days considered to be exactly 24 hours.
+# <p>
+# Examples:
+# <pre>
+# "PT20.345S" -- parses as "20.345 seconds"
+# "PT15M" -- parses as "15 minutes" (where a minute is 60 seconds)
+# "PT10H" -- parses as "10 hours" (where an hour is 3600 seconds)
+# "P2D" -- parses as "2 days" (where a day is 24 hours or 86400 seconds)
+# "P2DT3H4M" -- parses as "2 days, 3 hours and 4 minutes"
+# "P-6H3M" -- parses as "-6 hours and +3 minutes"
+# "-P6H3M" -- parses as "-6 hours and -3 minutes"
+# "-P-6H+3M" -- parses as "+6 hours and -3 minutes"
+# </pre>
+filter: "{ tags -> tags.job_name == 'apisix-monitoring' }" # The OpenTelemetry job name
+expPrefix: tag({tags -> tags.host_name = 'apisix::' + tags.service_instance_id})
+expSuffix:
+metricPrefix: meter_apisix
+metricsRules:
+ # apisix
+ - name: sv_http_connections
+ exp: apisix_nginx_http_current_connections.sum(['state','host_name']).service(['host_name'] , Layer.APISIX)
+ - name: shared_dict_capacity_bytes
+ exp: apisix_shared_dict_capacity_bytes.sum(['name','host_name']).service(['host_name'] , Layer.APISIX)
+ - name: shared_dict_free_space_bytes
+ exp: apisix_shared_dict_free_space_bytes.sum(['name','host_name']).service(['host_name'] , Layer.APISIX)
+ - name: sv_etcd_indexes
+ exp: apisix_etcd_modify_indexes.sum(['key','host_name']).service(['host_name'] , Layer.APISIX)
+ - name: sv_bandwidth
+ exp: apisix_bandwidth.tagEqual('route','').tagEqual('service','').tagEqual('consumer','').tagEqual('node','').sum(['type','host_name']).rate('PT1M').service(['host_name'] , Layer.APISIX)
+ - name: sv_http_status
+ exp: apisix_http_status.tagEqual('route','').tagEqual('matched_uri','').tagEqual('matched_host','').tagEqual('service','').tagEqual('consumer','').tagEqual('node','').sum(['code','host_name']).rate('PT1M').service(['host_name'] , Layer.APISIX)
Review Comment:
> Is this HTTP status or APISIX Server status?
Yes , TYPE is counter , I want get the rate of increase
```
apisix_http_requests_total 27
# HELP apisix_http_status HTTP status codes per service in APISIX
# TYPE apisix_http_status counter
apisix_http_status{code="404",route="",matched_uri="",matched_host="",service="",consumer="",node=""} 3
apisix_http_status{code="404",route="routes#1",matched_uri="/self/*",matched_host="",service="1",consumer="",node="127.0.0.1"} 3
```
##########
oap-server/server-starter/src/main/resources/otel-rules/apisix.yaml:
##########
@@ -0,0 +1,68 @@
+# Licensed to the Apache Software Foundation (ASF) under one or more
+# contributor license agreements. See the NOTICE file distributed with
+# this work for additional information regarding copyright ownership.
+# The ASF licenses this file to You under the Apache License, Version 2.0
+# (the "License"); you may not use this file except in compliance with
+# the License. You may obtain a copy of the License at
+#
+# http://www.apache.org/licenses/LICENSE-2.0
+#
+# Unless required by applicable law or agreed to in writing, software
+# distributed under the License is distributed on an "AS IS" BASIS,
+# WITHOUT WARRANTIES OR CONDITIONS OF ANY KIND, either express or implied.
+# See the License for the specific language governing permissions and
+# limitations under the License.
+
+# This will parse a textual representation of a duration. The formats
+# accepted are based on the ISO-8601 duration format {@code PnDTnHnMn.nS}
+# with days considered to be exactly 24 hours.
+# <p>
+# Examples:
+# <pre>
+# "PT20.345S" -- parses as "20.345 seconds"
+# "PT15M" -- parses as "15 minutes" (where a minute is 60 seconds)
+# "PT10H" -- parses as "10 hours" (where an hour is 3600 seconds)
+# "P2D" -- parses as "2 days" (where a day is 24 hours or 86400 seconds)
+# "P2DT3H4M" -- parses as "2 days, 3 hours and 4 minutes"
+# "P-6H3M" -- parses as "-6 hours and +3 minutes"
+# "-P6H3M" -- parses as "-6 hours and -3 minutes"
+# "-P-6H+3M" -- parses as "+6 hours and -3 minutes"
+# </pre>
+filter: "{ tags -> tags.job_name == 'apisix-monitoring' }" # The OpenTelemetry job name
+expPrefix: tag({tags -> tags.host_name = 'apisix::' + tags.service_instance_id})
+expSuffix:
+metricPrefix: meter_apisix
+metricsRules:
+ # apisix
+ - name: sv_http_connections
+ exp: apisix_nginx_http_current_connections.sum(['state','host_name']).service(['host_name'] , Layer.APISIX)
+ - name: shared_dict_capacity_bytes
+ exp: apisix_shared_dict_capacity_bytes.sum(['name','host_name']).service(['host_name'] , Layer.APISIX)
+ - name: shared_dict_free_space_bytes
+ exp: apisix_shared_dict_free_space_bytes.sum(['name','host_name']).service(['host_name'] , Layer.APISIX)
+ - name: sv_etcd_indexes
+ exp: apisix_etcd_modify_indexes.sum(['key','host_name']).service(['host_name'] , Layer.APISIX)
+ - name: sv_bandwidth
+ exp: apisix_bandwidth.tagEqual('route','').tagEqual('service','').tagEqual('consumer','').tagEqual('node','').sum(['type','host_name']).rate('PT1M').service(['host_name'] , Layer.APISIX)
+ - name: sv_http_status
+ exp: apisix_http_status.tagEqual('route','').tagEqual('matched_uri','').tagEqual('matched_host','').tagEqual('service','').tagEqual('consumer','').tagEqual('node','').sum(['code','host_name']).rate('PT1M').service(['host_name'] , Layer.APISIX)
Review Comment:
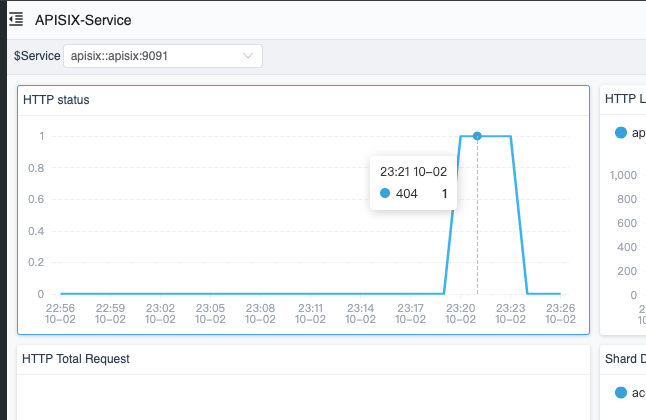
##########
oap-server/server-starter/src/main/resources/otel-rules/apisix.yaml:
##########
@@ -0,0 +1,68 @@
+# Licensed to the Apache Software Foundation (ASF) under one or more
+# contributor license agreements. See the NOTICE file distributed with
+# this work for additional information regarding copyright ownership.
+# The ASF licenses this file to You under the Apache License, Version 2.0
+# (the "License"); you may not use this file except in compliance with
+# the License. You may obtain a copy of the License at
+#
+# http://www.apache.org/licenses/LICENSE-2.0
+#
+# Unless required by applicable law or agreed to in writing, software
+# distributed under the License is distributed on an "AS IS" BASIS,
+# WITHOUT WARRANTIES OR CONDITIONS OF ANY KIND, either express or implied.
+# See the License for the specific language governing permissions and
+# limitations under the License.
+
+# This will parse a textual representation of a duration. The formats
+# accepted are based on the ISO-8601 duration format {@code PnDTnHnMn.nS}
+# with days considered to be exactly 24 hours.
+# <p>
+# Examples:
+# <pre>
+# "PT20.345S" -- parses as "20.345 seconds"
+# "PT15M" -- parses as "15 minutes" (where a minute is 60 seconds)
+# "PT10H" -- parses as "10 hours" (where an hour is 3600 seconds)
+# "P2D" -- parses as "2 days" (where a day is 24 hours or 86400 seconds)
+# "P2DT3H4M" -- parses as "2 days, 3 hours and 4 minutes"
+# "P-6H3M" -- parses as "-6 hours and +3 minutes"
+# "-P6H3M" -- parses as "-6 hours and -3 minutes"
+# "-P-6H+3M" -- parses as "+6 hours and -3 minutes"
+# </pre>
+filter: "{ tags -> tags.job_name == 'apisix-monitoring' }" # The OpenTelemetry job name
+expPrefix: tag({tags -> tags.host_name = 'apisix::' + tags.service_instance_id})
+expSuffix:
+metricPrefix: meter_apisix
+metricsRules:
+ # apisix
+ - name: sv_http_connections
+ exp: apisix_nginx_http_current_connections.sum(['state','host_name']).service(['host_name'] , Layer.APISIX)
+ - name: shared_dict_capacity_bytes
+ exp: apisix_shared_dict_capacity_bytes.sum(['name','host_name']).service(['host_name'] , Layer.APISIX)
+ - name: shared_dict_free_space_bytes
+ exp: apisix_shared_dict_free_space_bytes.sum(['name','host_name']).service(['host_name'] , Layer.APISIX)
+ - name: sv_etcd_indexes
+ exp: apisix_etcd_modify_indexes.sum(['key','host_name']).service(['host_name'] , Layer.APISIX)
+ - name: sv_bandwidth
+ exp: apisix_bandwidth.tagEqual('route','').tagEqual('service','').tagEqual('consumer','').tagEqual('node','').sum(['type','host_name']).rate('PT1M').service(['host_name'] , Layer.APISIX)
+ - name: sv_http_status
+ exp: apisix_http_status.tagEqual('route','').tagEqual('matched_uri','').tagEqual('matched_host','').tagEqual('service','').tagEqual('consumer','').tagEqual('node','').sum(['code','host_name']).rate('PT1M').service(['host_name'] , Layer.APISIX)
Review Comment:
> Is this HTTP status or APISIX Server status?
Yes , TYPE is counter , I want get the rate of increase ,and my local case always return 404.
```
apisix_http_requests_total 27
# HELP apisix_http_status HTTP status codes per service in APISIX
# TYPE apisix_http_status counter
apisix_http_status{code="404",route="",matched_uri="",matched_host="",service="",consumer="",node=""} 3
apisix_http_status{code="404",route="routes#1",matched_uri="/self/*",matched_host="",service="1",consumer="",node="127.0.0.1"} 3
```
##########
oap-server/server-starter/src/main/resources/otel-rules/apisix.yaml:
##########
@@ -0,0 +1,68 @@
+# Licensed to the Apache Software Foundation (ASF) under one or more
+# contributor license agreements. See the NOTICE file distributed with
+# this work for additional information regarding copyright ownership.
+# The ASF licenses this file to You under the Apache License, Version 2.0
+# (the "License"); you may not use this file except in compliance with
+# the License. You may obtain a copy of the License at
+#
+# http://www.apache.org/licenses/LICENSE-2.0
+#
+# Unless required by applicable law or agreed to in writing, software
+# distributed under the License is distributed on an "AS IS" BASIS,
+# WITHOUT WARRANTIES OR CONDITIONS OF ANY KIND, either express or implied.
+# See the License for the specific language governing permissions and
+# limitations under the License.
+
+# This will parse a textual representation of a duration. The formats
+# accepted are based on the ISO-8601 duration format {@code PnDTnHnMn.nS}
+# with days considered to be exactly 24 hours.
+# <p>
+# Examples:
+# <pre>
+# "PT20.345S" -- parses as "20.345 seconds"
+# "PT15M" -- parses as "15 minutes" (where a minute is 60 seconds)
+# "PT10H" -- parses as "10 hours" (where an hour is 3600 seconds)
+# "P2D" -- parses as "2 days" (where a day is 24 hours or 86400 seconds)
+# "P2DT3H4M" -- parses as "2 days, 3 hours and 4 minutes"
+# "P-6H3M" -- parses as "-6 hours and +3 minutes"
+# "-P6H3M" -- parses as "-6 hours and -3 minutes"
+# "-P-6H+3M" -- parses as "+6 hours and -3 minutes"
+# </pre>
+filter: "{ tags -> tags.job_name == 'apisix-monitoring' }" # The OpenTelemetry job name
+expPrefix: tag({tags -> tags.host_name = 'apisix::' + tags.service_instance_id})
+expSuffix:
+metricPrefix: meter_apisix
+metricsRules:
+ # apisix
+ - name: sv_http_connections
+ exp: apisix_nginx_http_current_connections.sum(['state','host_name']).service(['host_name'] , Layer.APISIX)
+ - name: shared_dict_capacity_bytes
+ exp: apisix_shared_dict_capacity_bytes.sum(['name','host_name']).service(['host_name'] , Layer.APISIX)
+ - name: shared_dict_free_space_bytes
+ exp: apisix_shared_dict_free_space_bytes.sum(['name','host_name']).service(['host_name'] , Layer.APISIX)
+ - name: sv_etcd_indexes
+ exp: apisix_etcd_modify_indexes.sum(['key','host_name']).service(['host_name'] , Layer.APISIX)
+ - name: sv_bandwidth
+ exp: apisix_bandwidth.tagEqual('route','').tagEqual('service','').tagEqual('consumer','').tagEqual('node','').sum(['type','host_name']).rate('PT1M').service(['host_name'] , Layer.APISIX)
+ - name: sv_http_status
+ exp: apisix_http_status.tagEqual('route','').tagEqual('matched_uri','').tagEqual('matched_host','').tagEqual('service','').tagEqual('consumer','').tagEqual('node','').sum(['code','host_name']).rate('PT1M').service(['host_name'] , Layer.APISIX)
Review Comment:
> Is this HTTP status or APISIX Server status?
HTTP status , TYPE is counter , I want get the rate of increase ,and my local case always return 404.
```
apisix_http_requests_total 27
# HELP apisix_http_status HTTP status codes per service in APISIX
# TYPE apisix_http_status counter
apisix_http_status{code="404",route="",matched_uri="",matched_host="",service="",consumer="",node=""} 3
apisix_http_status{code="404",route="routes#1",matched_uri="/self/*",matched_host="",service="1",consumer="",node="127.0.0.1"} 3
```
##########
oap-server/server-starter/src/main/resources/otel-rules/apisix.yaml:
##########
@@ -0,0 +1,68 @@
+# Licensed to the Apache Software Foundation (ASF) under one or more
+# contributor license agreements. See the NOTICE file distributed with
+# this work for additional information regarding copyright ownership.
+# The ASF licenses this file to You under the Apache License, Version 2.0
+# (the "License"); you may not use this file except in compliance with
+# the License. You may obtain a copy of the License at
+#
+# http://www.apache.org/licenses/LICENSE-2.0
+#
+# Unless required by applicable law or agreed to in writing, software
+# distributed under the License is distributed on an "AS IS" BASIS,
+# WITHOUT WARRANTIES OR CONDITIONS OF ANY KIND, either express or implied.
+# See the License for the specific language governing permissions and
+# limitations under the License.
+
+# This will parse a textual representation of a duration. The formats
+# accepted are based on the ISO-8601 duration format {@code PnDTnHnMn.nS}
+# with days considered to be exactly 24 hours.
+# <p>
+# Examples:
+# <pre>
+# "PT20.345S" -- parses as "20.345 seconds"
+# "PT15M" -- parses as "15 minutes" (where a minute is 60 seconds)
+# "PT10H" -- parses as "10 hours" (where an hour is 3600 seconds)
+# "P2D" -- parses as "2 days" (where a day is 24 hours or 86400 seconds)
+# "P2DT3H4M" -- parses as "2 days, 3 hours and 4 minutes"
+# "P-6H3M" -- parses as "-6 hours and +3 minutes"
+# "-P6H3M" -- parses as "-6 hours and -3 minutes"
+# "-P-6H+3M" -- parses as "+6 hours and -3 minutes"
+# </pre>
+filter: "{ tags -> tags.job_name == 'apisix-monitoring' }" # The OpenTelemetry job name
+expPrefix: tag({tags -> tags.host_name = 'apisix::' + tags.service_instance_id})
+expSuffix:
+metricPrefix: meter_apisix
+metricsRules:
+ # apisix
+ - name: sv_http_connections
+ exp: apisix_nginx_http_current_connections.sum(['state','host_name']).service(['host_name'] , Layer.APISIX)
+ - name: shared_dict_capacity_bytes
+ exp: apisix_shared_dict_capacity_bytes.sum(['name','host_name']).service(['host_name'] , Layer.APISIX)
+ - name: shared_dict_free_space_bytes
+ exp: apisix_shared_dict_free_space_bytes.sum(['name','host_name']).service(['host_name'] , Layer.APISIX)
+ - name: sv_etcd_indexes
+ exp: apisix_etcd_modify_indexes.sum(['key','host_name']).service(['host_name'] , Layer.APISIX)
+ - name: sv_bandwidth
+ exp: apisix_bandwidth.tagEqual('route','').tagEqual('service','').tagEqual('consumer','').tagEqual('node','').sum(['type','host_name']).rate('PT1M').service(['host_name'] , Layer.APISIX)
+ - name: sv_http_status
+ exp: apisix_http_status.tagEqual('route','').tagEqual('matched_uri','').tagEqual('matched_host','').tagEqual('service','').tagEqual('consumer','').tagEqual('node','').sum(['code','host_name']).rate('PT1M').service(['host_name'] , Layer.APISIX)
Review Comment:
change title to `HTTP status (Rate)` . and Y-axis distinguish such as `20%` ,`100%`
##########
oap-server/server-starter/src/main/resources/otel-rules/apisix.yaml:
##########
@@ -0,0 +1,68 @@
+# Licensed to the Apache Software Foundation (ASF) under one or more
+# contributor license agreements. See the NOTICE file distributed with
+# this work for additional information regarding copyright ownership.
+# The ASF licenses this file to You under the Apache License, Version 2.0
+# (the "License"); you may not use this file except in compliance with
+# the License. You may obtain a copy of the License at
+#
+# http://www.apache.org/licenses/LICENSE-2.0
+#
+# Unless required by applicable law or agreed to in writing, software
+# distributed under the License is distributed on an "AS IS" BASIS,
+# WITHOUT WARRANTIES OR CONDITIONS OF ANY KIND, either express or implied.
+# See the License for the specific language governing permissions and
+# limitations under the License.
+
+# This will parse a textual representation of a duration. The formats
+# accepted are based on the ISO-8601 duration format {@code PnDTnHnMn.nS}
+# with days considered to be exactly 24 hours.
+# <p>
+# Examples:
+# <pre>
+# "PT20.345S" -- parses as "20.345 seconds"
+# "PT15M" -- parses as "15 minutes" (where a minute is 60 seconds)
+# "PT10H" -- parses as "10 hours" (where an hour is 3600 seconds)
+# "P2D" -- parses as "2 days" (where a day is 24 hours or 86400 seconds)
+# "P2DT3H4M" -- parses as "2 days, 3 hours and 4 minutes"
+# "P-6H3M" -- parses as "-6 hours and +3 minutes"
+# "-P6H3M" -- parses as "-6 hours and -3 minutes"
+# "-P-6H+3M" -- parses as "+6 hours and -3 minutes"
+# </pre>
+filter: "{ tags -> tags.job_name == 'apisix-monitoring' }" # The OpenTelemetry job name
+expPrefix: tag({tags -> tags.host_name = 'apisix::' + tags.service_instance_id})
+expSuffix:
+metricPrefix: meter_apisix
+metricsRules:
+ # apisix
+ - name: sv_http_connections
+ exp: apisix_nginx_http_current_connections.sum(['state','host_name']).service(['host_name'] , Layer.APISIX)
+ - name: shared_dict_capacity_bytes
+ exp: apisix_shared_dict_capacity_bytes.sum(['name','host_name']).service(['host_name'] , Layer.APISIX)
+ - name: shared_dict_free_space_bytes
+ exp: apisix_shared_dict_free_space_bytes.sum(['name','host_name']).service(['host_name'] , Layer.APISIX)
+ - name: sv_etcd_indexes
+ exp: apisix_etcd_modify_indexes.sum(['key','host_name']).service(['host_name'] , Layer.APISIX)
+ - name: sv_bandwidth
+ exp: apisix_bandwidth.tagEqual('route','').tagEqual('service','').tagEqual('consumer','').tagEqual('node','').sum(['type','host_name']).rate('PT1M').service(['host_name'] , Layer.APISIX)
+ - name: sv_http_status
+ exp: apisix_http_status.tagEqual('route','').tagEqual('matched_uri','').tagEqual('matched_host','').tagEqual('service','').tagEqual('consumer','').tagEqual('node','').sum(['code','host_name']).rate('PT1M').service(['host_name'] , Layer.APISIX)
Review Comment:
change title to `HTTP status (Increase Rate)` . and Y-axis distinguish such as `20%` ,`100%`
##########
oap-server/server-starter/src/main/resources/otel-rules/apisix.yaml:
##########
@@ -0,0 +1,68 @@
+# Licensed to the Apache Software Foundation (ASF) under one or more
+# contributor license agreements. See the NOTICE file distributed with
+# this work for additional information regarding copyright ownership.
+# The ASF licenses this file to You under the Apache License, Version 2.0
+# (the "License"); you may not use this file except in compliance with
+# the License. You may obtain a copy of the License at
+#
+# http://www.apache.org/licenses/LICENSE-2.0
+#
+# Unless required by applicable law or agreed to in writing, software
+# distributed under the License is distributed on an "AS IS" BASIS,
+# WITHOUT WARRANTIES OR CONDITIONS OF ANY KIND, either express or implied.
+# See the License for the specific language governing permissions and
+# limitations under the License.
+
+# This will parse a textual representation of a duration. The formats
+# accepted are based on the ISO-8601 duration format {@code PnDTnHnMn.nS}
+# with days considered to be exactly 24 hours.
+# <p>
+# Examples:
+# <pre>
+# "PT20.345S" -- parses as "20.345 seconds"
+# "PT15M" -- parses as "15 minutes" (where a minute is 60 seconds)
+# "PT10H" -- parses as "10 hours" (where an hour is 3600 seconds)
+# "P2D" -- parses as "2 days" (where a day is 24 hours or 86400 seconds)
+# "P2DT3H4M" -- parses as "2 days, 3 hours and 4 minutes"
+# "P-6H3M" -- parses as "-6 hours and +3 minutes"
+# "-P6H3M" -- parses as "-6 hours and -3 minutes"
+# "-P-6H+3M" -- parses as "+6 hours and -3 minutes"
+# </pre>
+filter: "{ tags -> tags.job_name == 'apisix-monitoring' }" # The OpenTelemetry job name
+expPrefix: tag({tags -> tags.host_name = 'apisix::' + tags.service_instance_id})
+expSuffix:
+metricPrefix: meter_apisix
+metricsRules:
+ # apisix
+ - name: sv_http_connections
+ exp: apisix_nginx_http_current_connections.sum(['state','host_name']).service(['host_name'] , Layer.APISIX)
+ - name: shared_dict_capacity_bytes
+ exp: apisix_shared_dict_capacity_bytes.sum(['name','host_name']).service(['host_name'] , Layer.APISIX)
+ - name: shared_dict_free_space_bytes
+ exp: apisix_shared_dict_free_space_bytes.sum(['name','host_name']).service(['host_name'] , Layer.APISIX)
+ - name: sv_etcd_indexes
+ exp: apisix_etcd_modify_indexes.sum(['key','host_name']).service(['host_name'] , Layer.APISIX)
+ - name: sv_bandwidth
+ exp: apisix_bandwidth.tagEqual('route','').tagEqual('service','').tagEqual('consumer','').tagEqual('node','').sum(['type','host_name']).rate('PT1M').service(['host_name'] , Layer.APISIX)
+ - name: sv_http_status
+ exp: apisix_http_status.tagEqual('route','').tagEqual('matched_uri','').tagEqual('matched_host','').tagEqual('service','').tagEqual('consumer','').tagEqual('node','').sum(['code','host_name']).rate('PT1M').service(['host_name'] , Layer.APISIX)
Review Comment:
change title to `HTTP status (Rate)` . and Y-axis distinguish such as `20%` ,`100%`
--
This is an automated message from the Apache Git Service.
To respond to the message, please log on to GitHub and use the
URL above to go to the specific comment.
To unsubscribe, e-mail: notifications-unsubscribe@skywalking.apache.org
For queries about this service, please contact Infrastructure at:
users@infra.apache.org
[GitHub] [skywalking] pg-yang commented on a diff in pull request #9725: Add APISIX metrics monitoring
Posted by GitBox <gi...@apache.org>.
pg-yang commented on code in PR #9725:
URL: https://github.com/apache/skywalking/pull/9725#discussion_r985253175


##########
docs/en/concepts-and-designs/mal.md:
##########
@@ -164,7 +164,7 @@ These operations can be used to aggregate overall label dimensions or preserve d
 Example expression:

 ```
-instance_trace_count.sum(by: ['az'])
+instance_trace_count.sum(['az'])

Review Comment:
   ACK , I  would update  the example


##########
oap-server/server-starter/src/main/resources/otel-rules/apisix.yaml:
##########
@@ -0,0 +1,68 @@
+# Licensed to the Apache Software Foundation (ASF) under one or more
+# contributor license agreements.  See the NOTICE file distributed with
+# this work for additional information regarding copyright ownership.
+# The ASF licenses this file to You under the Apache License, Version 2.0
+# (the "License"); you may not use this file except in compliance with
+# the License.  You may obtain a copy of the License at
+#
+#     http://www.apache.org/licenses/LICENSE-2.0
+#
+# Unless required by applicable law or agreed to in writing, software
+# distributed under the License is distributed on an "AS IS" BASIS,
+# WITHOUT WARRANTIES OR CONDITIONS OF ANY KIND, either express or implied.
+# See the License for the specific language governing permissions and
+# limitations under the License.
+
+# This will parse a textual representation of a duration. The formats
+# accepted are based on the ISO-8601 duration format {@code PnDTnHnMn.nS}
+# with days considered to be exactly 24 hours.
+# <p>
+# Examples:
+# <pre>
+#    "PT20.345S" -- parses as "20.345 seconds"
+#    "PT15M"     -- parses as "15 minutes" (where a minute is 60 seconds)
+#    "PT10H"     -- parses as "10 hours" (where an hour is 3600 seconds)
+#    "P2D"       -- parses as "2 days" (where a day is 24 hours or 86400 seconds)
+#    "P2DT3H4M"  -- parses as "2 days, 3 hours and 4 minutes"
+#    "P-6H3M"    -- parses as "-6 hours and +3 minutes"
+#    "-P6H3M"    -- parses as "-6 hours and -3 minutes"
+#    "-P-6H+3M"  -- parses as "+6 hours and -3 minutes"
+# </pre>
+filter: "{ tags -> tags.job_name == 'apisix-monitoring' }" # The OpenTelemetry job name
+expPrefix:  tag({tags -> tags.host_name = 'apisix::' + tags.service_instance_id})
+expSuffix:
+metricPrefix: meter_apisix
+metricsRules:
+  # apisix
+  - name: sv_http_connections
+    exp: apisix_nginx_http_current_connections.sum(['state','host_name']).service(['host_name'] , Layer.APISIX)
+  - name: shared_dict_capacity_bytes
+    exp: apisix_shared_dict_capacity_bytes.sum(['name','host_name']).service(['host_name'] , Layer.APISIX)
+  - name: shared_dict_free_space_bytes
+    exp: apisix_shared_dict_free_space_bytes.sum(['name','host_name']).service(['host_name'] , Layer.APISIX)
+  - name: sv_etcd_indexes
+    exp: apisix_etcd_modify_indexes.sum(['key','host_name']).service(['host_name'] , Layer.APISIX)
+  - name: sv_bandwidth
+    exp: apisix_bandwidth.tagEqual('route','').tagEqual('service','').tagEqual('consumer','').tagEqual('node','').sum(['type','host_name']).rate('PT1M').service(['host_name'] , Layer.APISIX)
+  - name: sv_http_status
+    exp: apisix_http_status.tagEqual('route','').tagEqual('matched_uri','').tagEqual('matched_host','').tagEqual('service','').tagEqual('consumer','').tagEqual('node','').sum(['code','host_name']).rate('PT1M').service(['host_name'] , Layer.APISIX)

Review Comment:
   It  seems a serious problem , I  would confirm it .


--
This is an automated message from the Apache Git Service.
To respond to the message, please log on to GitHub and use the
URL above to go to the specific comment.

To unsubscribe, e-mail: notifications-unsubscribe@skywalking.apache.org

For queries about this service, please contact Infrastructure at:
users@infra.apache.org
[GitHub] [skywalking] wu-sheng commented on a diff in pull request #9725: Add APISIX metrics monitoring
Posted by GitBox <gi...@apache.org>.
wu-sheng commented on code in PR #9725:
URL: https://github.com/apache/skywalking/pull/9725#discussion_r985323529


##########
oap-server/server-starter/src/main/resources/otel-rules/apisix.yaml:
##########
@@ -0,0 +1,68 @@
+# Licensed to the Apache Software Foundation (ASF) under one or more
+# contributor license agreements.  See the NOTICE file distributed with
+# this work for additional information regarding copyright ownership.
+# The ASF licenses this file to You under the Apache License, Version 2.0
+# (the "License"); you may not use this file except in compliance with
+# the License.  You may obtain a copy of the License at
+#
+#     http://www.apache.org/licenses/LICENSE-2.0
+#
+# Unless required by applicable law or agreed to in writing, software
+# distributed under the License is distributed on an "AS IS" BASIS,
+# WITHOUT WARRANTIES OR CONDITIONS OF ANY KIND, either express or implied.
+# See the License for the specific language governing permissions and
+# limitations under the License.
+
+# This will parse a textual representation of a duration. The formats
+# accepted are based on the ISO-8601 duration format {@code PnDTnHnMn.nS}
+# with days considered to be exactly 24 hours.
+# <p>
+# Examples:
+# <pre>
+#    "PT20.345S" -- parses as "20.345 seconds"
+#    "PT15M"     -- parses as "15 minutes" (where a minute is 60 seconds)
+#    "PT10H"     -- parses as "10 hours" (where an hour is 3600 seconds)
+#    "P2D"       -- parses as "2 days" (where a day is 24 hours or 86400 seconds)
+#    "P2DT3H4M"  -- parses as "2 days, 3 hours and 4 minutes"
+#    "P-6H3M"    -- parses as "-6 hours and +3 minutes"
+#    "-P6H3M"    -- parses as "-6 hours and -3 minutes"
+#    "-P-6H+3M"  -- parses as "+6 hours and -3 minutes"
+# </pre>
+filter: "{ tags -> tags.job_name == 'apisix-monitoring' }" # The OpenTelemetry job name
+expPrefix:  tag({tags -> tags.host_name = 'apisix::' + tags.service_instance_id})
+expSuffix:
+metricPrefix: meter_apisix
+metricsRules:
+  # apisix
+  - name: sv_http_connections
+    exp: apisix_nginx_http_current_connections.sum(['state','host_name']).service(['host_name'] , Layer.APISIX)
+  - name: shared_dict_capacity_bytes
+    exp: apisix_shared_dict_capacity_bytes.sum(['name','host_name']).service(['host_name'] , Layer.APISIX)
+  - name: shared_dict_free_space_bytes
+    exp: apisix_shared_dict_free_space_bytes.sum(['name','host_name']).service(['host_name'] , Layer.APISIX)
+  - name: sv_etcd_indexes
+    exp: apisix_etcd_modify_indexes.sum(['key','host_name']).service(['host_name'] , Layer.APISIX)
+  - name: sv_bandwidth
+    exp: apisix_bandwidth.tagEqual('route','').tagEqual('service','').tagEqual('consumer','').tagEqual('node','').sum(['type','host_name']).rate('PT1M').service(['host_name'] , Layer.APISIX)
+  - name: sv_http_status
+    exp: apisix_http_status.tagEqual('route','').tagEqual('matched_uri','').tagEqual('matched_host','').tagEqual('service','').tagEqual('consumer','').tagEqual('node','').sum(['code','host_name']).rate('PT1M').service(['host_name'] , Layer.APISIX)

Review Comment:
   `http_status_times_upper` What does the `upper` suffix mean? `http_status_times` means `counts per HTTP status code`, right?


##########
oap-server/server-starter/src/main/resources/otel-rules/apisix.yaml:
##########
@@ -0,0 +1,68 @@
+# Licensed to the Apache Software Foundation (ASF) under one or more
+# contributor license agreements.  See the NOTICE file distributed with
+# this work for additional information regarding copyright ownership.
+# The ASF licenses this file to You under the Apache License, Version 2.0
+# (the "License"); you may not use this file except in compliance with
+# the License.  You may obtain a copy of the License at
+#
+#     http://www.apache.org/licenses/LICENSE-2.0
+#
+# Unless required by applicable law or agreed to in writing, software
+# distributed under the License is distributed on an "AS IS" BASIS,
+# WITHOUT WARRANTIES OR CONDITIONS OF ANY KIND, either express or implied.
+# See the License for the specific language governing permissions and
+# limitations under the License.
+
+# This will parse a textual representation of a duration. The formats
+# accepted are based on the ISO-8601 duration format {@code PnDTnHnMn.nS}
+# with days considered to be exactly 24 hours.
+# <p>
+# Examples:
+# <pre>
+#    "PT20.345S" -- parses as "20.345 seconds"
+#    "PT15M"     -- parses as "15 minutes" (where a minute is 60 seconds)
+#    "PT10H"     -- parses as "10 hours" (where an hour is 3600 seconds)
+#    "P2D"       -- parses as "2 days" (where a day is 24 hours or 86400 seconds)
+#    "P2DT3H4M"  -- parses as "2 days, 3 hours and 4 minutes"
+#    "P-6H3M"    -- parses as "-6 hours and +3 minutes"
+#    "-P6H3M"    -- parses as "-6 hours and -3 minutes"
+#    "-P-6H+3M"  -- parses as "+6 hours and -3 minutes"
+# </pre>
+filter: "{ tags -> tags.job_name == 'apisix-monitoring' }" # The OpenTelemetry job name
+expPrefix:  tag({tags -> tags.host_name = 'apisix::' + tags.service_instance_id})
+expSuffix:
+metricPrefix: meter_apisix
+metricsRules:
+  # apisix
+  - name: sv_http_connections
+    exp: apisix_nginx_http_current_connections.sum(['state','host_name']).service(['host_name'] , Layer.APISIX)
+  - name: shared_dict_capacity_bytes
+    exp: apisix_shared_dict_capacity_bytes.sum(['name','host_name']).service(['host_name'] , Layer.APISIX)
+  - name: shared_dict_free_space_bytes
+    exp: apisix_shared_dict_free_space_bytes.sum(['name','host_name']).service(['host_name'] , Layer.APISIX)
+  - name: sv_etcd_indexes
+    exp: apisix_etcd_modify_indexes.sum(['key','host_name']).service(['host_name'] , Layer.APISIX)
+  - name: sv_bandwidth
+    exp: apisix_bandwidth.tagEqual('route','').tagEqual('service','').tagEqual('consumer','').tagEqual('node','').sum(['type','host_name']).rate('PT1M').service(['host_name'] , Layer.APISIX)
+  - name: sv_http_status
+    exp: apisix_http_status.tagEqual('route','').tagEqual('matched_uri','').tagEqual('matched_host','').tagEqual('service','').tagEqual('consumer','').tagEqual('node','').sum(['code','host_name']).rate('PT1M').service(['host_name'] , Layer.APISIX)

Review Comment:
   By reading your MAL, this metric should be `HTTP response code trend`. But the graph seems hard to understand, please recheck.


--
This is an automated message from the Apache Git Service.
To respond to the message, please log on to GitHub and use the
URL above to go to the specific comment.

To unsubscribe, e-mail: notifications-unsubscribe@skywalking.apache.org

For queries about this service, please contact Infrastructure at:
users@infra.apache.org