You are viewing a plain text version of this content. The canonical link for it is here.
Posted to commits@echarts.apache.org by GitBox <gi...@apache.org> on 2022/07/01 18:39:04 UTC
[GitHub] [echarts] achaitanyasai commented on issue #15976: line chart dynamic data time axis endLabel
achaitanyasai commented on issue #15976:
URL: https://github.com/apache/echarts/issues/15976#issuecomment-1172618066
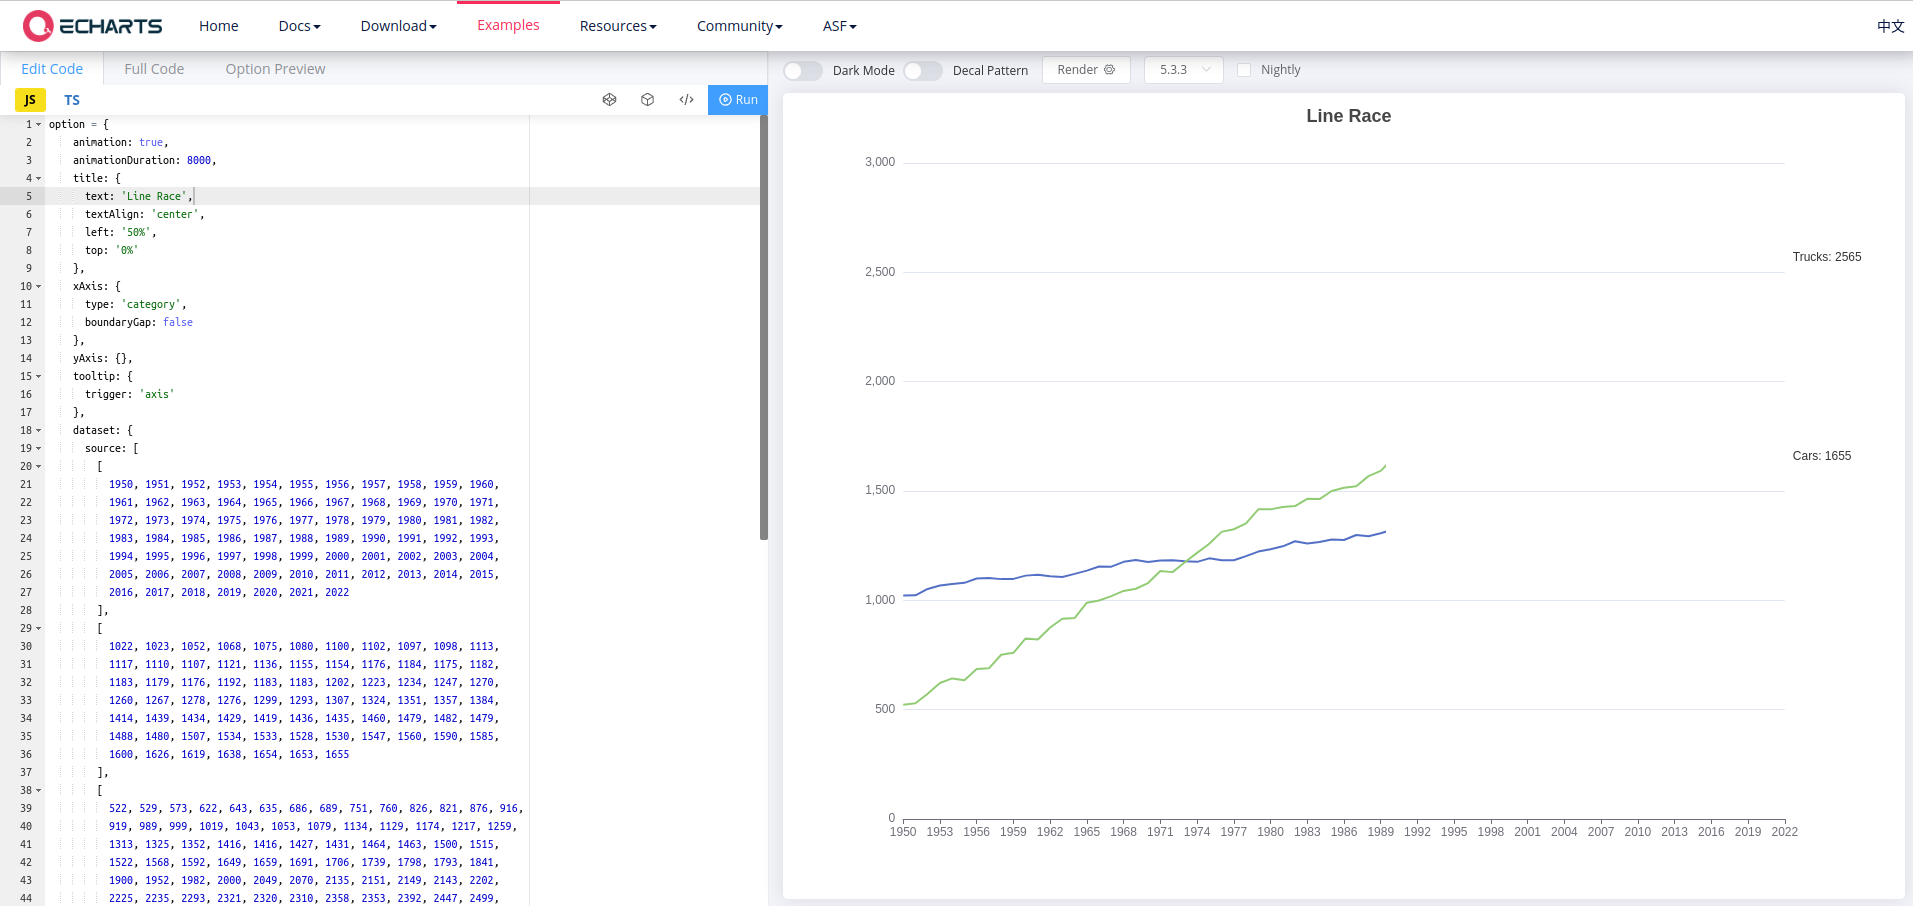
@Ovilia, I have tried the line race chart with the below options. I have noticed that the endLabel is not getting animated, which can be seen in the attached screenshot. Is this expected?
<details><summary>Options</summary>
<pre>option = {
animation: true,
animationDuration: 3000,
title: {
text: 'Line Race',
textAlign: 'center',
left: '50%',
top: '0%'
},
xAxis: {
type: 'category',
boundaryGap: false
},
yAxis: {},
tooltip: {
trigger: 'axis'
},
dataset: {
source: [
[
1950, 1951, 1952, 1953, 1954, 1955, 1956, 1957, 1958, 1959, 1960,
1961, 1962, 1963, 1964, 1965, 1966, 1967, 1968, 1969, 1970, 1971,
1972, 1973, 1974, 1975, 1976, 1977, 1978, 1979, 1980, 1981, 1982,
1983, 1984, 1985, 1986, 1987, 1988, 1989, 1990, 1991, 1992, 1993,
1994, 1995, 1996, 1997, 1998, 1999, 2000, 2001, 2002, 2003, 2004,
2005, 2006, 2007, 2008, 2009, 2010, 2011, 2012, 2013, 2014, 2015,
2016, 2017, 2018, 2019, 2020, 2021, 2022
],
[
1022, 1023, 1052, 1068, 1075, 1080, 1100, 1102, 1097, 1098, 1113,
1117, 1110, 1107, 1121, 1136, 1155, 1154, 1176, 1184, 1175, 1182,
1183, 1179, 1176, 1192, 1183, 1183, 1202, 1223, 1234, 1247, 1270,
1260, 1267, 1278, 1276, 1299, 1293, 1307, 1324, 1351, 1357, 1384,
1414, 1439, 1434, 1429, 1419, 1436, 1435, 1460, 1479, 1482, 1479,
1488, 1480, 1507, 1534, 1533, 1528, 1530, 1547, 1560, 1590, 1585,
1600, 1626, 1619, 1638, 1654, 1653, 1655
],
[
522, 529, 573, 622, 643, 635, 686, 689, 751, 760, 826, 821, 876, 916,
919, 989, 999, 1019, 1043, 1053, 1079, 1134, 1129, 1174, 1217, 1259,
1313, 1325, 1352, 1416, 1416, 1427, 1431, 1464, 1463, 1500, 1515,
1522, 1568, 1592, 1649, 1659, 1691, 1706, 1739, 1798, 1793, 1841,
1900, 1952, 1982, 2000, 2049, 2070, 2135, 2151, 2149, 2143, 2202,
2225, 2235, 2293, 2321, 2320, 2310, 2358, 2353, 2392, 2447, 2499,
2516, 2523, 2565
]
]
},
series: [
{
type: 'line',
seriesLayoutBy: 'row',
showSymbol: false,
name: 'sales',
endLabel: {
show: true,
valueAnimation: true,
formatter: function (params) {
console.log(params);
return 'Cars: ' + params.value[1];
}
},
labelLayout: {
moveOverlap: 'shiftY'
},
emphasis: {
focus: 'series'
}
},
{
type: 'line',
seriesLayoutBy: 'row',
showSymbol: false,
name: 'revenue',
endLabel: {
show: true,
valueAnimation: true,
formatter: function (params) {
return 'Trucks: ' + params.value[2];
}
},
labelLayout: {
moveOverlap: 'shiftY'
},
emphasis: {
focus: 'series'
}
}
]
};
myChart.setOption(option);
</pre>
</details>
<details><summary>Screenshot containing no endLabel animation</summary>
</details>
However, if there is some data delay (see options below, which contains dummy delay), then the endLabel is getting animated.
<details><summary>Options with dummy data delay</summary>
<pre>
$.get(
ROOT_PATH + '/data/asset/data/life-expectancy-table.json',
function (_rawData) {
run();
}
);
function run() {
option = {
animation: true,
animationDuration: 8000,
title: {
text: 'Line Race',
textAlign: 'center',
left: '50%',
top: '0%'
},
xAxis: {
type: 'category',
boundaryGap: false
},
yAxis: {},
tooltip: {
trigger: 'axis'
},
dataset: {
source: [
[
1950, 1951, 1952, 1953, 1954, 1955, 1956, 1957, 1958, 1959, 1960,
1961, 1962, 1963, 1964, 1965, 1966, 1967, 1968, 1969, 1970, 1971,
1972, 1973, 1974, 1975, 1976, 1977, 1978, 1979, 1980, 1981, 1982,
1983, 1984, 1985, 1986, 1987, 1988, 1989, 1990, 1991, 1992, 1993,
1994, 1995, 1996, 1997, 1998, 1999, 2000, 2001, 2002, 2003, 2004,
2005, 2006, 2007, 2008, 2009, 2010, 2011, 2012, 2013, 2014, 2015,
2016, 2017, 2018, 2019, 2020, 2021, 2022
],
[
1022, 1023, 1052, 1068, 1075, 1080, 1100, 1102, 1097, 1098, 1113,
1117, 1110, 1107, 1121, 1136, 1155, 1154, 1176, 1184, 1175, 1182,
1183, 1179, 1176, 1192, 1183, 1183, 1202, 1223, 1234, 1247, 1270,
1260, 1267, 1278, 1276, 1299, 1293, 1307, 1324, 1351, 1357, 1384,
1414, 1439, 1434, 1429, 1419, 1436, 1435, 1460, 1479, 1482, 1479,
1488, 1480, 1507, 1534, 1533, 1528, 1530, 1547, 1560, 1590, 1585,
1600, 1626, 1619, 1638, 1654, 1653, 1655
],
[
522, 529, 573, 622, 643, 635, 686, 689, 751, 760, 826, 821, 876, 916,
919, 989, 999, 1019, 1043, 1053, 1079, 1134, 1129, 1174, 1217, 1259,
1313, 1325, 1352, 1416, 1416, 1427, 1431, 1464, 1463, 1500, 1515,
1522, 1568, 1592, 1649, 1659, 1691, 1706, 1739, 1798, 1793, 1841,
1900, 1952, 1982, 2000, 2049, 2070, 2135, 2151, 2149, 2143, 2202,
2225, 2235, 2293, 2321, 2320, 2310, 2358, 2353, 2392, 2447, 2499,
2516, 2523, 2565
]
]
},
series: [
{
type: 'line',
seriesLayoutBy: 'row',
showSymbol: false,
name: 'sales',
endLabel: {
show: true,
valueAnimation: true,
formatter: function (params) {
console.log(params);
return 'Cars: ' + params.value[1];
}
},
labelLayout: {
moveOverlap: 'shiftY'
},
emphasis: {
focus: 'series'
}
},
{
type: 'line',
seriesLayoutBy: 'row',
showSymbol: false,
name: 'revenue',
endLabel: {
show: true,
valueAnimation: true,
formatter: function (params) {
return 'Trucks: ' + params.value[2];
}
},
labelLayout: {
moveOverlap: 'shiftY'
},
emphasis: {
focus: 'series'
}
}
]
};
myChart.setOption(option);
}
</pre>
</details>
<details><summary>Screenshot containing endLabel animation</summary>

</details>
--
This is an automated message from the Apache Git Service.
To respond to the message, please log on to GitHub and use the
URL above to go to the specific comment.
To unsubscribe, e-mail: commits-unsubscribe@echarts.apache.org
For queries about this service, please contact Infrastructure at:
users@infra.apache.org
---------------------------------------------------------------------
To unsubscribe, e-mail: commits-unsubscribe@echarts.apache.org
For additional commands, e-mail: commits-help@echarts.apache.org