You are viewing a plain text version of this content. The canonical link for it is here.
Posted to notifications@superset.apache.org by GitBox <gi...@apache.org> on 2022/07/30 11:41:45 UTC
[GitHub] [superset] oskarabc commented on issue #5168: am unable to find stacked bars feature in the upgraded superset. I can't find chart options as it was before I am finding it difficult to use breakdowns.
oskarabc commented on issue #5168:
URL: https://github.com/apache/superset/issues/5168#issuecomment-1200142733
@tingzhouu Invoking a group by statement wouldn't work in this case I believe as it would just group and not show separate values for each value of a visual total. In my reading OP is after just manipulating visuals, rather than underlying data.
As it took me 20 minutes to find this first time around, here are steps and a screenshot: First pick the time-series bar chart from the Data menu (or tab) in the side bar under Visualisation Type. Then navigate to the Customize menu (or tab) and look for the "Stack Series" option nested under Chart Options.
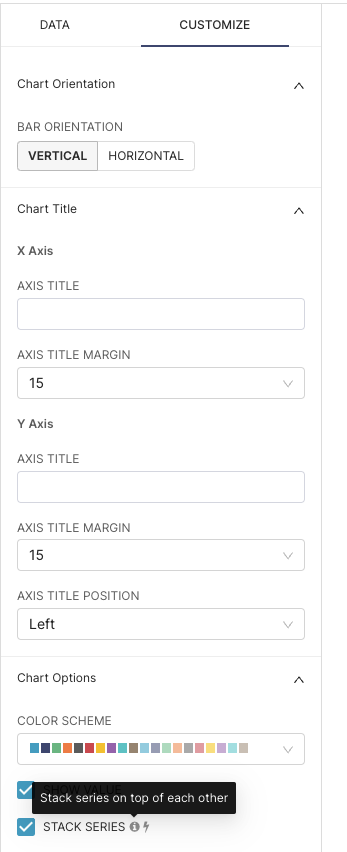
At the time of writing I'm using version 2.0.0.
--
This is an automated message from the Apache Git Service.
To respond to the message, please log on to GitHub and use the
URL above to go to the specific comment.
To unsubscribe, e-mail: notifications-unsubscribe@superset.apache.org
For queries about this service, please contact Infrastructure at:
users@infra.apache.org
---------------------------------------------------------------------
To unsubscribe, e-mail: notifications-unsubscribe@superset.apache.org
For additional commands, e-mail: notifications-help@superset.apache.org