You are viewing a plain text version of this content. The canonical link for it is here.
Posted to commits@echarts.apache.org by GitBox <gi...@apache.org> on 2021/10/28 10:48:34 UTC
[GitHub] [echarts] jaykumar-parmar opened a new issue #15974: Breaking change v[ 4.x -> 5.x ] : rangeStart & rangeEnd property missing in echartsInstance.getOption().xAxis
jaykumar-parmar opened a new issue #15974:
URL: https://github.com/apache/echarts/issues/15974
### Version
5.2.1
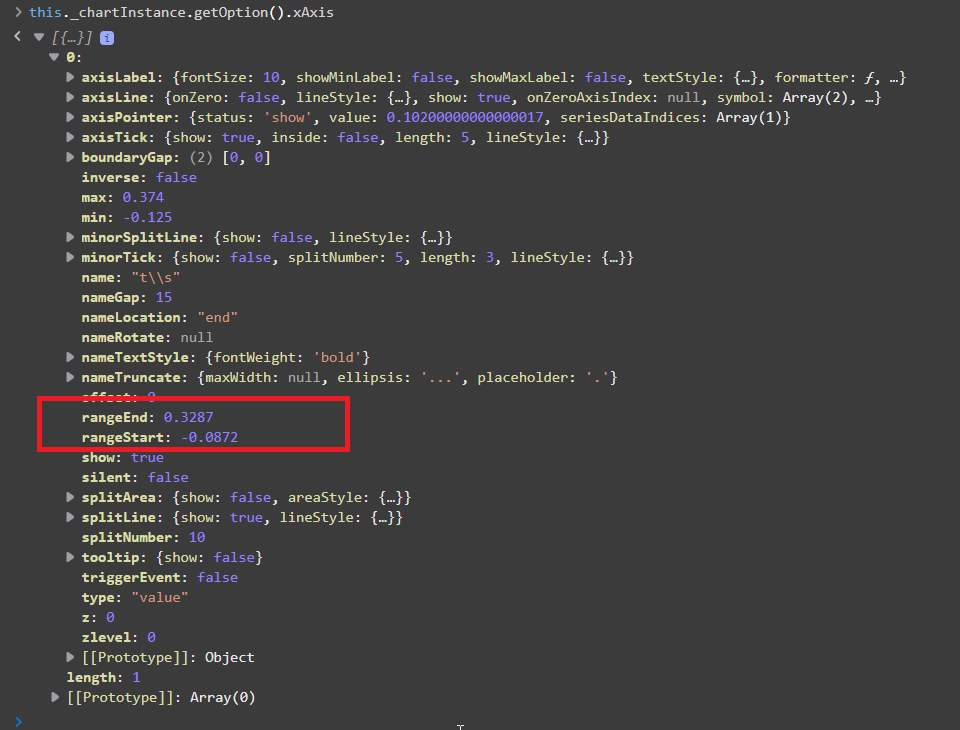
### Steps to reproduce
rangeStart & rangeEnd property missing in echartsInstance.getOption().xAxis.
It was available in v4.x but it's missing in v5.x.
Screenshot from v4.x
Is there any alternative ?
### What is expected?
### What is actually happening?
<!-- This issue is generated by echarts-issue-helper. DO NOT REMOVE -->
<!-- This issue is in English. DO NOT REMOVE -->
--
This is an automated message from the Apache Git Service.
To respond to the message, please log on to GitHub and use the
URL above to go to the specific comment.
To unsubscribe, e-mail: commits-unsubscribe@echarts.apache.org
For queries about this service, please contact Infrastructure at:
users@infra.apache.org
---------------------------------------------------------------------
To unsubscribe, e-mail: commits-unsubscribe@echarts.apache.org
For additional commands, e-mail: commits-help@echarts.apache.org
[GitHub] [echarts] echarts-bot[bot] commented on issue #15974: Breaking change v[ 4.x -> 5.x ] : rangeStart & rangeEnd property missing in echartsInstance.getOption().xAxis
Posted by GitBox <gi...@apache.org>.
echarts-bot[bot] commented on issue #15974:
URL: https://github.com/apache/echarts/issues/15974#issuecomment-953729336


   Hi! We've received your issue and please be patient to get responded. 🎉
   The average response time is expected to be within one day for weekdays.

   In the meanwhile, please make sure that it contains **a minimum reproducible demo** and necessary **images** to illustrate. Otherwise, our committers will ask you to do so.

   *A minimum reproducible demo* should contain as little data and components as possible but can still illustrate your problem. This is the best way for us to reproduce it and solve the problem faster.

   You may also check out the [API](https://echarts.apache.org/api.html) and [chart option](https://echarts.apache.org/option.html) to get the answer.

   If you don't get helped for a long time (over a week) or have an urgent question to ask, you may also send an email to dev@echarts.apache.org. Please attach the issue link if it's a technical question.

   If you are interested in the project, you may also subscribe to our [mailing list](https://echarts.apache.org/maillist.html).

   Have a nice day! 🍵


--
This is an automated message from the Apache Git Service.
To respond to the message, please log on to GitHub and use the
URL above to go to the specific comment.

To unsubscribe, e-mail: commits-unsubscribe@echarts.apache.org

For queries about this service, please contact Infrastructure at:
users@infra.apache.org


---------------------------------------------------------------------
To unsubscribe, e-mail: commits-unsubscribe@echarts.apache.org
For additional commands, e-mail: commits-help@echarts.apache.org