You are viewing a plain text version of this content. The canonical link for it is here.
Posted to dev@echarts.apache.org by GitBox <gi...@apache.org> on 2018/08/23 02:44:30 UTC
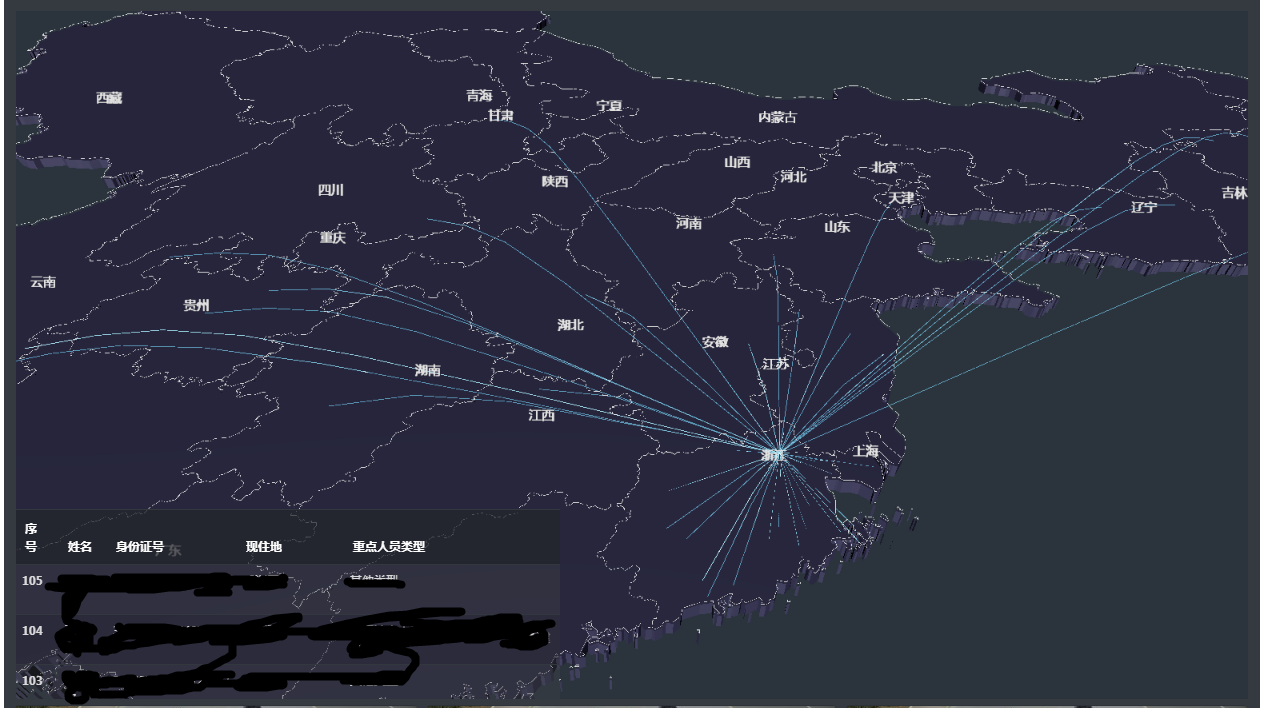
[GitHub] callmeYe opened a new issue #8925: line3D中画的线为折线
callmeYe opened a new issue #8925: line3D中画的线为折线
URL: https://github.com/apache/incubator-echarts/issues/8925
<!--
为了方便我们能够复现和修复 bug,请遵从下面的规范描述您的问题。
-->
### One-line summary [问题简述]
使用line3D绘制流向图,绘制出来的线是不平滑的折线,不知道有什么办法可以更改线的平滑程度。
### Version & Environment [版本及环境]
+ ECharts version [ECharts 版本]: ECharts 4.1.0
+ Browser version [浏览器类型和版本]: Chrome 68.0.3440.84
+ OS Version [操作系统类型和版本]: WIN7 SP1
### Expected behaviour [期望结果]
希望绘制出来的线可以是圆滑的曲线。
### ECharts option [ECharts配置项]
<!-- Copy and paste your 'echarts option' here. -->
<!-- [下方贴你的option,注意不要删掉下方 ```javascript 和 尾部的 ``` 字样。最好是我们能够直接运行的 option。如何得到能运行的 option 参见上方的 guidelines for contributing] -->
```javascript
option = {
geo3D: {
map: 'china',
shading: 'realistic',
silent: true,
environment: '#343a40',
realisticMaterial: {
roughness: 0.8,
metalness: 0
},
postEffect: {
enable: true
},
groundPlane: {
show: false
},
light: {
main: {
intensity: 1,
alpha: 30
},
ambient: {
intensity: 0
}
},
viewControl: {
//distance: 70,
alpha: 40,
distance:30,
beta:40,
center:[15,-5,10],
minDistance:10,
panMouseButton: 'left',
rotateMouseButton: 'right'
},
itemStyle: {
color: '#444359',
borderWidth:0.5,
borderColor:'#d9d9d9'
},
label: {
show: true,
textStyle: {
color: '#fff', //地图初始化区域字体颜色
fontFamily:'微软雅黑',
fontSize: 16,
opacity: 1,
backgroundColor: 'rgba(0,23,11,0)'
},
},
emphasis: { //当鼠标放上去 地区区域是否显示名称
label: {
show: true,
textStyle: {
color: '#fff',
fontSize: 16,
backgroundColor: 'rgba(0,23,11,0)'
}
}
},
regionHeight: 0.5
},
series: [{
type: 'lines3D',
coordinateSystem: 'geo3D',
effect: {
show: true,
trailWidth: 1,
trailOpacity: 0.5,
trailLength: 0.2
},
blendMode: 'lighter',
//lineStyle: {
// color:'#61A5CA',
// width: 0.2,
// opacity: 0.05
//},
//
blendMode: 'lighter',
lineStyle: {
color:'#61A5CA',
width: 0.9,
opacity: 0.5
},
data: []
}]
};
}
```
### Other comments [其他信息]
<!-- For example: Screenshot or Online demo -->
<!-- [例如,截图或线上实例 (JSFiddle/JSBin/Codepen)] -->
完整代码为:
function formatData(){
var routes = [];
for(var i=0;i<zdryFlightData.length;i++){
var posObj = bm2zbData[zdryFlightData[i]["xzdqh"]];
if(!posObj){
console.log(zdryFlightData[i]["xzdqh"]);
continue;
}
var flightRoad = [[posObj['lon'],posObj['lat']],[120.049831,30.567583]];
routes.push(flightRoad);
}
return routes;
}
function drawZdryFlightChart(){
var option = myChart.getOption();
if(!option){
option = {
geo3D: {
map: 'china',
shading: 'realistic',
silent: true,
environment: '#343a40',
realisticMaterial: {
roughness: 0.8,
metalness: 0
},
postEffect: {
enable: true
},
groundPlane: {
show: false
},
light: {
main: {
intensity: 1,
alpha: 30
},
ambient: {
intensity: 0
}
},
viewControl: {
//distance: 70,
alpha: 40,
distance:30,
beta:40,
center:[15,-5,10],
minDistance:10,
panMouseButton: 'left',
rotateMouseButton: 'right'
},
itemStyle: {
color: '#444359',
borderWidth:0.5,
borderColor:'#d9d9d9'
},
label: {
show: true,
textStyle: {
color: '#fff', //地图初始化区域字体颜色
fontFamily:'微软雅黑',
fontSize: 16,
opacity: 1,
backgroundColor: 'rgba(0,23,11,0)'
},
},
emphasis: { //当鼠标放上去 地区区域是否显示名称
label: {
show: true,
textStyle: {
color: '#fff',
fontSize: 16,
backgroundColor: 'rgba(0,23,11,0)'
}
}
},
regionHeight: 0.5
},
series: [{
type: 'lines3D',
coordinateSystem: 'geo3D',
effect: {
show: true,
trailWidth: 1,
trailOpacity: 0.5,
trailLength: 0.2
},
blendMode: 'lighter',
//lineStyle: {
// color:'#61A5CA',
// width: 0.2,
// opacity: 0.05
//},
//
blendMode: 'lighter',
lineStyle: {
color:'#61A5CA',
width: 0.9,
opacity: 0.5
},
data: []
}]
};
}
option.series[0].data = formatData();
myChart.setOption(option,true);
myChart.hideLoading();
}
----------------------------------------------------------------
This is an automated message from the Apache Git Service.
To respond to the message, please log on GitHub and use the
URL above to go to the specific comment.
For queries about this service, please contact Infrastructure at:
users@infra.apache.org
With regards,
Apache Git Services
---------------------------------------------------------------------
To unsubscribe, e-mail: dev-unsubscribe@echarts.apache.org
For additional commands, e-mail: dev-help@echarts.apache.org