You are viewing a plain text version of this content. The canonical link for it is here.
Posted to commits@echarts.apache.org by GitBox <gi...@apache.org> on 2021/04/23 02:49:15 UTC
[GitHub] [echarts] Alexander-txj opened a new issue #14763: After using the toolbox, the graphics are wrong
Alexander-txj opened a new issue #14763:
URL: https://github.com/apache/echarts/issues/14763
### Version
5.1.0
### Reproduction link
[https://codepen.io/alexander-txj/pen/yLgGbeB](https://codepen.io/alexander-txj/pen/yLgGbeB)
### Steps to reproduce
1.Open the link is the graphic I normally need
2.Open the comment, it is an error graphic
### What is expected?
Just upgraded to version 5.0, hope to fix it as soon as possible, which has a great impact on us
### What is actually happening?
The graphics are severely deformed
<!-- This issue is generated by echarts-issue-helper. DO NOT REMOVE -->
<!-- This issue is in English. DO NOT REMOVE -->
--
This is an automated message from the Apache Git Service.
To respond to the message, please log on to GitHub and use the
URL above to go to the specific comment.
For queries about this service, please contact Infrastructure at:
users@infra.apache.org
---------------------------------------------------------------------
To unsubscribe, e-mail: commits-unsubscribe@echarts.apache.org
For additional commands, e-mail: commits-help@echarts.apache.org
[GitHub] [echarts] echarts-bot[bot] commented on issue #14763: After using the toolbox, the graphics are wrong
Posted by GitBox <gi...@apache.org>.
echarts-bot[bot] commented on issue #14763:
URL: https://github.com/apache/echarts/issues/14763#issuecomment-825348145


   Hi! We've received your issue and please be patient to get responded. 🎉
   The average response time is expected to be within one day for weekdays.

   In the meanwhile, please make sure that **you have posted enough image to demo your request**. You may also check out the [API](http://echarts.apache.org/api.html) and [chart option](http://echarts.apache.org/option.html) to get the answer.

   If you don't get helped for a long time (over a week) or have an urgent question to ask, you may also send an email to dev@echarts.apache.org. Please attach the issue link if it's a technical question.

   If you are interested in the project, you may also subscribe our [mailing list](https://echarts.apache.org/en/maillist.html).

   Have a nice day! 🍵


--
This is an automated message from the Apache Git Service.
To respond to the message, please log on to GitHub and use the
URL above to go to the specific comment.

For queries about this service, please contact Infrastructure at:
users@infra.apache.org


---------------------------------------------------------------------
To unsubscribe, e-mail: commits-unsubscribe@echarts.apache.org
For additional commands, e-mail: commits-help@echarts.apache.org
[GitHub] [echarts] Ovilia commented on issue #14763: After using the toolbox, the graphics are wrong
Posted by GitBox <gi...@apache.org>.
Ovilia commented on issue #14763:
URL: https://github.com/apache/echarts/issues/14763#issuecomment-825355462


   It seems to be a bug. But @Alexander-txj could you simplify your code to give a minimum option for us better to debug?


--
This is an automated message from the Apache Git Service.
To respond to the message, please log on to GitHub and use the
URL above to go to the specific comment.

For queries about this service, please contact Infrastructure at:
users@infra.apache.org


---------------------------------------------------------------------
To unsubscribe, e-mail: commits-unsubscribe@echarts.apache.org
For additional commands, e-mail: commits-help@echarts.apache.org
[GitHub] [echarts] Alexander-txj commented on issue #14763: After using the toolbox, the graphics are wrong
Posted by GitBox <gi...@apache.org>.
Alexander-txj commented on issue #14763:
URL: https://github.com/apache/echarts/issues/14763#issuecomment-825357426
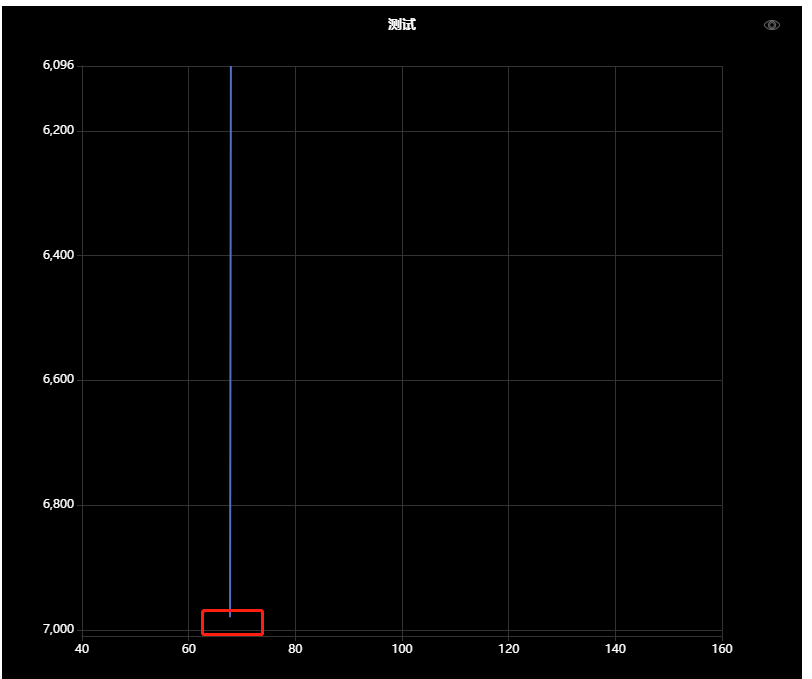
I don't know if other graphics have any effect. But the main effect of the line chart is that if my data is [10,20,30,50,80,100], but max is only set to 90, then the last paragraph [80,90] will not be connected
I will restore you later, a simplified demo
------------------ 原始邮件 ------------------
发件人: "Wenli ***@***.***>;
发送时间: 2021年4月23日(星期五) 中午11:12
收件人: ***@***.***>;
抄送: ***@***.***>; ***@***.***>;
主题: Re: [apache/echarts] After using the toolbox, the graphics are wrong (#14763)
It seems to be a bug. But @Alexander-txj could you simplify your code to give a minimum option for us better to debug?
—
You are receiving this because you were mentioned.
Reply to this email directly, view it on GitHub, or unsubscribe.
--
This is an automated message from the Apache Git Service.
To respond to the message, please log on to GitHub and use the
URL above to go to the specific comment.
For queries about this service, please contact Infrastructure at:
users@infra.apache.org
---------------------------------------------------------------------
To unsubscribe, e-mail: commits-unsubscribe@echarts.apache.org
For additional commands, e-mail: commits-help@echarts.apache.org
[GitHub] [echarts] Alexander-txj edited a comment on issue #14763: After using the toolbox, the graphics are wrong
Posted by GitBox <gi...@apache.org>.
Alexander-txj edited a comment on issue #14763:
URL: https://github.com/apache/echarts/issues/14763#issuecomment-825362721
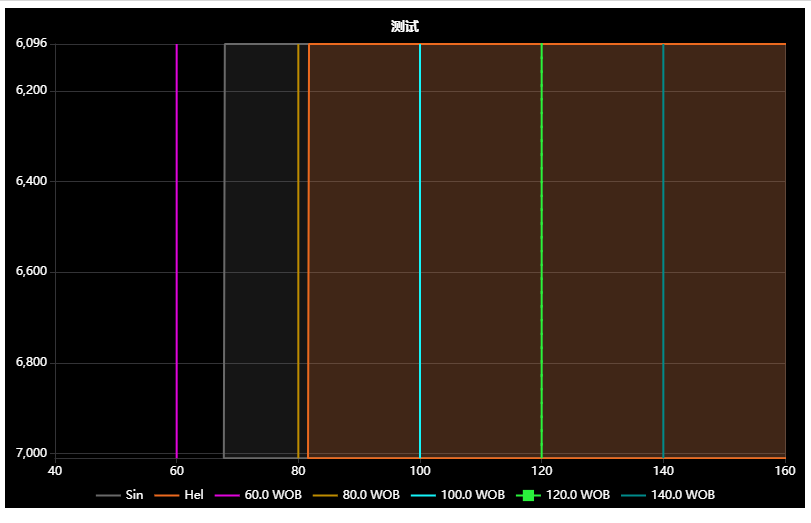
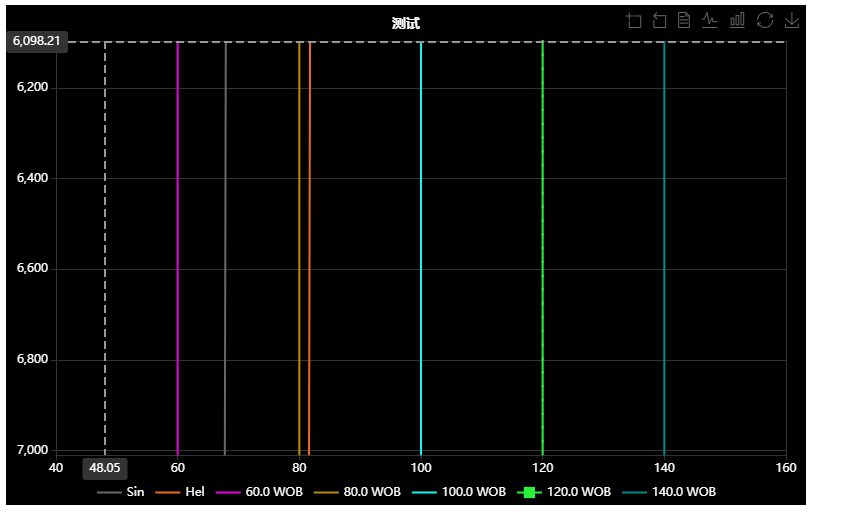
@Ovilia https://codepen.io/alexander-txj/pen/yLgGbeB
I need to draw such an area chart. But after using the toolbox, the area chart becomes invalid. If you use a custom toolbox, there will be cases where the line exceeding the maximum value is not connected

--
This is an automated message from the Apache Git Service.
To respond to the message, please log on to GitHub and use the
URL above to go to the specific comment.
For queries about this service, please contact Infrastructure at:
users@infra.apache.org
---------------------------------------------------------------------
To unsubscribe, e-mail: commits-unsubscribe@echarts.apache.org
For additional commands, e-mail: commits-help@echarts.apache.org
[GitHub] [echarts] Alexander-txj commented on issue #14763: After using the toolbox, the graphics are wrong
Posted by GitBox <gi...@apache.org>.
Alexander-txj commented on issue #14763:
URL: https://github.com/apache/echarts/issues/14763#issuecomment-825362721
@Ovilia https://codepen.io/alexander-txj/pen/yLgGbeB
I need to draw such an area chart. But after using the toolbox, the area chart becomes invalid. If you use a custom toolbox, there will be cases where the lines that exceed the maximum value are not linked


--
This is an automated message from the Apache Git Service.
To respond to the message, please log on to GitHub and use the
URL above to go to the specific comment.
For queries about this service, please contact Infrastructure at:
users@infra.apache.org
---------------------------------------------------------------------
To unsubscribe, e-mail: commits-unsubscribe@echarts.apache.org
For additional commands, e-mail: commits-help@echarts.apache.org