You are viewing a plain text version of this content. The canonical link for it is here.
Posted to dev@zookeeper.apache.org by "lanzhiwang (Jira)" <ji...@apache.org> on 2022/01/24 09:31:00 UTC
[jira] [Created] (ZOOKEEPER-4449) zookeeper monitoring metrics error
lanzhiwang created ZOOKEEPER-4449:
-------------------------------------
Summary: zookeeper monitoring metrics error
Key: ZOOKEEPER-4449
URL: https://issues.apache.org/jira/browse/ZOOKEEPER-4449
Project: ZooKeeper
Issue Type: Bug
Affects Versions: 3.5.8
Reporter: lanzhiwang
Fix For: 3.5.8
Deploy kafka and zookeeper in k8s, and use the following configuration to output monitoring metrics
```bash
-javaagent:/opt/kafka/libs/jmx_prometheus_javaagent-0.12.0.jar=9404:/opt/kafka/custom-config/metrics-config.yml
```
The metrics configuration is as follows:
```bash
$ cat /opt/kafka/custom-config/metrics-config.yml
{
"lowercaseOutputName":true,
"rules":[
{
"name":"zookeeper_$2",
"pattern":"org.apache.ZooKeeperService<name0=ReplicatedServer_id(\\d+)><>(\\w+)",
"type":"GAUGE"
},
{
"labels":{
"replicaId":"$2"
},
"name":"zookeeper_$3",
"pattern":"org.apache.ZooKeeperService<name0=ReplicatedServer_id(\\d+), name1=replica.(\\d+)><>(\\w+)",
"type":"GAUGE"
},
{
"labels":{
"memberType":"$3",
"replicaId":"$2"
},
"name":"zookeeper_$4",
"pattern":"org.apache.ZooKeeperService<name0=ReplicatedServer_id(\\d+), name1=replica.(\\d+), name2=(\\w+)><>(Packets.*)",
"type":"COUNTER"
},
{
"labels":{
"memberType":"$3",
"replicaId":"$2"
},
"name":"zookeeper_$4",
"pattern":"org.apache.ZooKeeperService<name0=ReplicatedServer_id(\\d+), name1=replica.(\\d+), name2=(\\w+)><>(\\w+)",
"type":"GAUGE"
},
{
"labels":{
"memberType":"$3",
"replica":"$2"
},
"name":"zookeeper_$5",
"pattern":"org.apache.ZooKeeperService<name0=(.+).name1=(.+).name2=(.+).name3=(.+)><>(PacketsReceived)",
"type":"COUNTER"
},
{
"labels":{
"memberType":"$3",
"replica":"$2"
},
"name":"zookeeper_$5",
"pattern":"org.apache.ZooKeeperService<name0=(.+).name1=(.+).name2=(.+).name3=(.+)><>(PacketsSent)",
"type":"COUNTER"
},
{
"labels":{
"memberType":"$3",
"replicaId":"$2"
},
"name":"zookeeper_$4_$5",
"pattern":"org.apache.ZooKeeperService<name0=ReplicatedServer_id(\\d+), name1=replica.(\\d+), name2=(\\w+), name3=(\\w+)><>(\\w+)",
"type":"GAUGE"
},
{
"name":"zookeeper_$2",
"pattern":"org.apache.ZooKeeperService<name0=StandaloneServer_port(\\d+)><>(\\w+)",
"type":"GAUGE"
},
{
"name":"zookeeper_$2",
"pattern":"org.apache.ZooKeeperService<name0=StandaloneServer_port(\\d+), name1=InMemoryDataTree><>(\\w+)",
"type":"GAUGE"
}
]
}
```
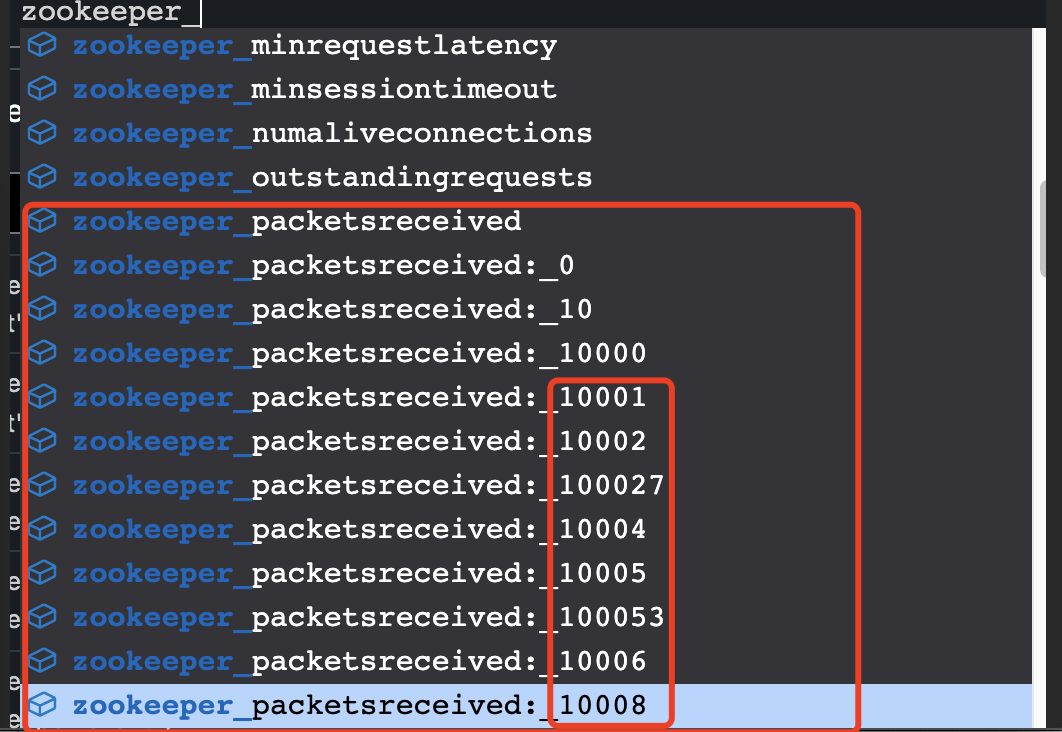
At this time, there are some very strange monitoring metrics in promethues
The jmx exporter version used is 0.12.0
What is the problem at this time, have you encountered it?
--
This message was sent by Atlassian Jira
(v8.20.1#820001)