You are viewing a plain text version of this content. The canonical link for it is here.
Posted to commits@echarts.apache.org by GitBox <gi...@apache.org> on 2022/04/12 08:37:12 UTC
[GitHub] [echarts] yglpyn8888 opened a new issue, #16876: [Feature] Echarts如何展示这种订单流图(orderflow chart/ volume matrix)?
yglpyn8888 opened a new issue, #16876:
URL: https://github.com/apache/echarts/issues/16876
### What problem does this feature solve?
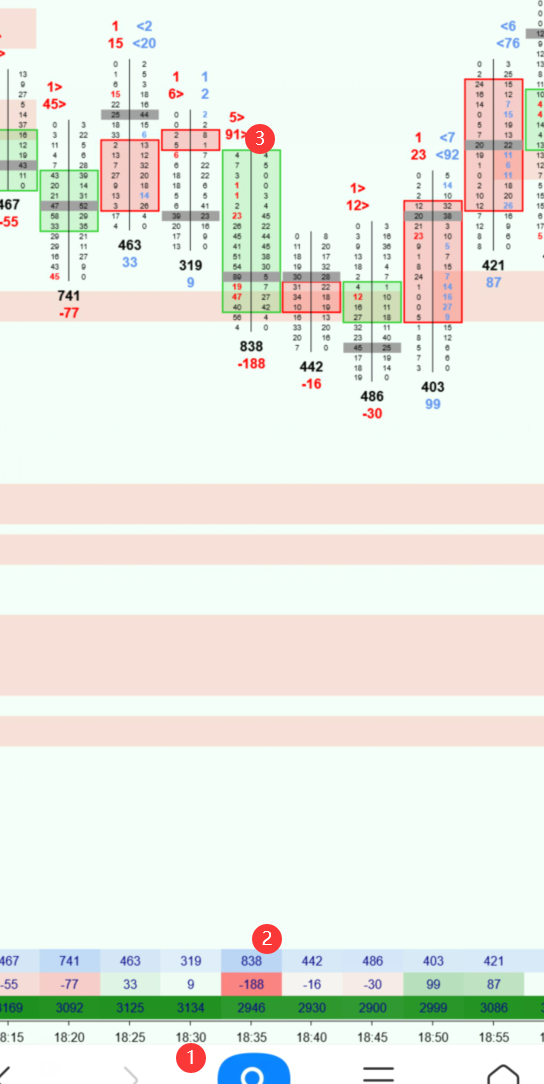
how to show this kind of chart by echarts?
如图, 位置1 是时间线的X轴 位置2是表格,这个我能用热力图做出这个效果
位置3 是我询问的 订单流图(orderflow chart/ volume matrix)
它的特点是在每个X轴的刻度,都会有左右两列, 每一列里有数字,所以 对于每个X轴刻度,会有一个矩阵的数据(矩阵大小为(2,n)),如何合适的展现这种矩阵数据?
目前echarts并没有专门的图表类型用于展示这种形式数据,有什么方法用其他图表类型近似的展示成这样也行?谢谢
### What does the proposed API look like?
无
--
This is an automated message from the Apache Git Service.
To respond to the message, please log on to GitHub and use the
URL above to go to the specific comment.
To unsubscribe, e-mail: commits-unsubscribe@echarts.apache.org.apache.org
For queries about this service, please contact Infrastructure at:
users@infra.apache.org
---------------------------------------------------------------------
To unsubscribe, e-mail: commits-unsubscribe@echarts.apache.org
For additional commands, e-mail: commits-help@echarts.apache.org
Re: [I] [Feature] How does Echarts show this orderflow chart/ volume matrix? [echarts]
Posted by "github-actions[bot] (via GitHub)" <gi...@apache.org>.
github-actions[bot] commented on issue #16876:
URL: https://github.com/apache/echarts/issues/16876#issuecomment-2067281605

   This issue has been automatically closed because it did not have recent activity. If this remains to be a problem with the latest version of Apache ECharts, please open a new issue and link this to it. Thanks!


--
This is an automated message from the Apache Git Service.
To respond to the message, please log on to GitHub and use the
URL above to go to the specific comment.

To unsubscribe, e-mail: commits-unsubscribe@echarts.apache.org

For queries about this service, please contact Infrastructure at:
users@infra.apache.org


---------------------------------------------------------------------
To unsubscribe, e-mail: commits-unsubscribe@echarts.apache.org
For additional commands, e-mail: commits-help@echarts.apache.org
[GitHub] [echarts] echarts-bot[bot] commented on issue #16876: [Feature] Echarts如何展示这种订单流图(orderflow chart/ volume matrix)?
Posted by GitBox <gi...@apache.org>.
echarts-bot[bot] commented on issue #16876:
URL: https://github.com/apache/echarts/issues/16876#issuecomment-1096365333
@yglpyn8888 It seems you are not using English, I've helped translate the content automatically. To make your issue understood by more people and get helped, we'd like to suggest using English next time. 🤗
<details><summary><b>TRANSLATED</b></summary><br>
**TITLE**
[Feature] How does Echarts show this orderflow chart/ volume matrix?
**BODY**
### What problem does this feature solve?

how to show this kind of chart by echarts?
As shown in the figure, Position 1 is the X axis of the timeline Position 2 is the table, and this I can use the heat map to make this effect
Position 3 is the orderflow chart/volume matrix I asked
It is characterized by the fact that in each X-axis scale, there will be two columns left and right, and there will be numbers in each column, so for each X-axis scale, there will be a matrix data (matrix size is (2, n)), how to properly display this matrix data?
At present, echarts does not have a special chart type for displaying this form of data, what is the way to use other chart types to approximate the display like this? Thank you
### What does the proposed API look like?
not
</details>
--
This is an automated message from the Apache Git Service.
To respond to the message, please log on to GitHub and use the
URL above to go to the specific comment.
To unsubscribe, e-mail: commits-unsubscribe@echarts.apache.org
For queries about this service, please contact Infrastructure at:
users@infra.apache.org
---------------------------------------------------------------------
To unsubscribe, e-mail: commits-unsubscribe@echarts.apache.org
For additional commands, e-mail: commits-help@echarts.apache.org
Re: [I] [Feature] How does Echarts show this orderflow chart/ volume matrix? [echarts]
Posted by "github-actions[bot] (via GitHub)" <gi...@apache.org>.
github-actions[bot] commented on issue #16876:
URL: https://github.com/apache/echarts/issues/16876#issuecomment-2052531075

   This issue has been automatically marked as stale because it did not have recent activity. It will be closed in 7 days if no further activity occurs. If you wish not to mark it as stale, please leave a comment in this issue.


--
This is an automated message from the Apache Git Service.
To respond to the message, please log on to GitHub and use the
URL above to go to the specific comment.

To unsubscribe, e-mail: commits-unsubscribe@echarts.apache.org

For queries about this service, please contact Infrastructure at:
users@infra.apache.org


---------------------------------------------------------------------
To unsubscribe, e-mail: commits-unsubscribe@echarts.apache.org
For additional commands, e-mail: commits-help@echarts.apache.org
Re: [I] [Feature] How does Echarts show this orderflow chart/ volume matrix? [echarts]
Posted by "github-actions[bot] (via GitHub)" <gi...@apache.org>.
github-actions[bot] closed issue #16876: [Feature] How does Echarts show this orderflow chart/ volume matrix?
URL: https://github.com/apache/echarts/issues/16876


--
This is an automated message from the Apache Git Service.
To respond to the message, please log on to GitHub and use the
URL above to go to the specific comment.

To unsubscribe, e-mail: commits-unsubscribe@echarts.apache.org

For queries about this service, please contact Infrastructure at:
users@infra.apache.org


---------------------------------------------------------------------
To unsubscribe, e-mail: commits-unsubscribe@echarts.apache.org
For additional commands, e-mail: commits-help@echarts.apache.org