You are viewing a plain text version of this content. The canonical link for it is here.
Posted to commits@mxnet.apache.org by GitBox <gi...@apache.org> on 2018/03/22 09:30:01 UTC
[GitHub] feevos commented on issue #10006: How to visualise filters of MXNet model?
feevos commented on issue #10006: How to visualise filters of MXNet model?
URL: https://github.com/apache/incubator-mxnet/issues/10006#issuecomment-375232470
Hi this solution applies to the gluon framework. I am not sure if you want to visualize the weights or the output of the convolution for some input (the latter is what I usually do).
Assuming you have a model, in the ```forward``` call you can return more than the last layer and visualize them:
```Python
%pylab inline
import mxnet as mx
from mxnet import gluon, nd
class tNet(gluon.nn.HybridBlock):
def __init__(self,**kwards):
gluon.nn.HybridBlock.__init__(self,**kwards)
with self.name_scope():
self.layer1 = gluon.nn.Conv2D(12,kernel_size=3,padding=1)
self.layer2 = gluon.nn.Conv2D(12,kernel_size=3,padding=1)
def hybrid_forward(self,F,_input):
out1 = self.layer1(_input)
out2 = self.layer2(out1)
return out1, out2
```
```Python
mynet = tNet()
mynet.initialize(mx.init.Xavier())
xx = nd.random_uniform(shape=[4,12,128,128])
out1, out2 = mynet(xx)
imshow(out1[0,0].asnumpy())
```
this produces the following image:
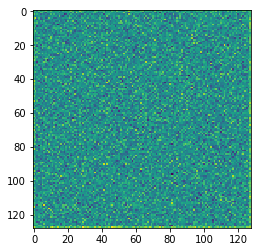
Now say you want to visualize the weights only of a layer, without the convolution. For example you can obtain the weights of self.layer2 or self.layer1 like this:
```Python
layer2_weight = mynet.layer2.weight.data() # This is an NDArray object
```
```Python
mynet.layer2.weight.data().shape
# prints (12,12,3,3) for this particular example.
```
so you can create histograms etc. Hope this helps.
----------------------------------------------------------------
This is an automated message from the Apache Git Service.
To respond to the message, please log on GitHub and use the
URL above to go to the specific comment.
For queries about this service, please contact Infrastructure at:
users@infra.apache.org
With regards,
Apache Git Services