You are viewing a plain text version of this content. The canonical link for it is here.
Posted to commits@echarts.apache.org by GitBox <gi...@apache.org> on 2022/06/22 08:08:06 UTC
[GitHub] [echarts] niko-m commented on issue #17122: [Bug] DataZoom's miniature misrepresents data in a managed plot (the plot drawn over the slider doesn't match the main plot's data)
niko-m commented on issue #17122:
URL: https://github.com/apache/echarts/issues/17122#issuecomment-1162786692
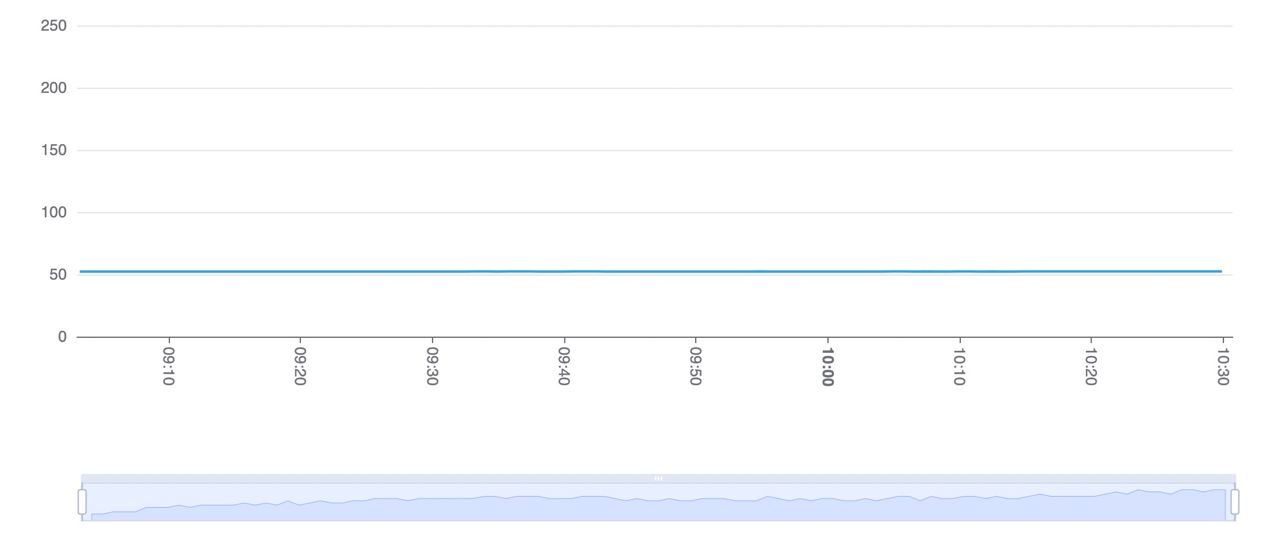
Same stuff. The main chart has a scale from 0 to 250 and values from approximately 52.20 to 52.37. The chart thumbnail does not match the main one. It would be great to be able to set the minimum and maximum for the chart thumbnail.
> further help might be sought from the core team :)
@pissang, @100pah, @Ovilia, @plainheart, @susiwen8
May be, someone will find it interesting to make a hotfix in one of the next minor releases?
--
This is an automated message from the Apache Git Service.
To respond to the message, please log on to GitHub and use the
URL above to go to the specific comment.
To unsubscribe, e-mail: commits-unsubscribe@echarts.apache.org
For queries about this service, please contact Infrastructure at:
users@infra.apache.org
---------------------------------------------------------------------
To unsubscribe, e-mail: commits-unsubscribe@echarts.apache.org
For additional commands, e-mail: commits-help@echarts.apache.org