You are viewing a plain text version of this content. The canonical link for it is here.
Posted to dev@echarts.apache.org by GitBox <gi...@apache.org> on 2018/09/18 02:17:23 UTC
[GitHub] ayesha-omarali opened a new issue #9093: Scroll Legend Arrows
Overlap With Values
ayesha-omarali opened a new issue #9093: Scroll Legend Arrows Overlap With Values
URL: https://github.com/apache/incubator-echarts/issues/9093
### One-line summary [问题简述]
When series/data names are over ~50 in length, there is no flex between arrows and legend values. I have tried to use all of top/left/right/bottom properties to layout legend as suggested [here](https://github.com/apache/incubator-echarts/issues/9080).
Please help me understand how to prevent the arrows from overlapping with the legend values. I have tried many different values with all the properties.
### Version & Environment [版本及环境]
+ ECharts version [ECharts 版本]: "^4.1.0",
+ Browser version [浏览器类型和版本]: Chrome 68
+ OS Version [操作系统类型和版本]: 10.13.1
### Expected behaviour [期望结果]
Arrows do not overlap with legend values

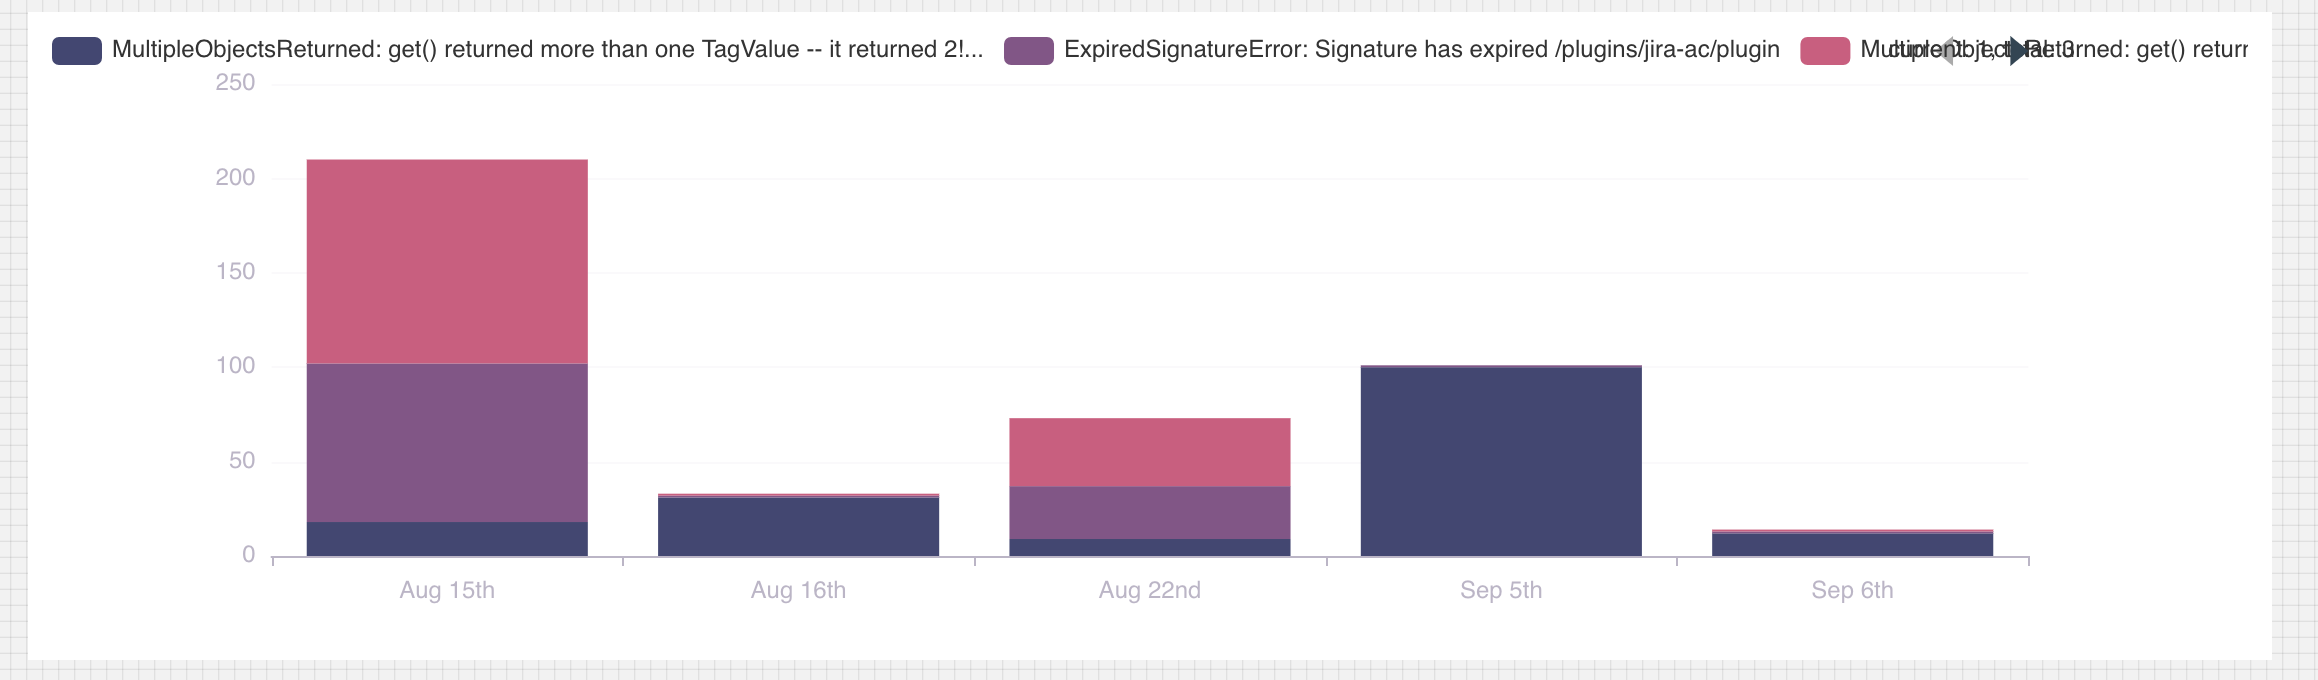
Below is with `legend { right: 10% }` property set -- it only moves the arrows, does not move the text:

Below is with `legend {width: 90%}` -- again only moves the arrows
### ECharts option [ECharts配置项]
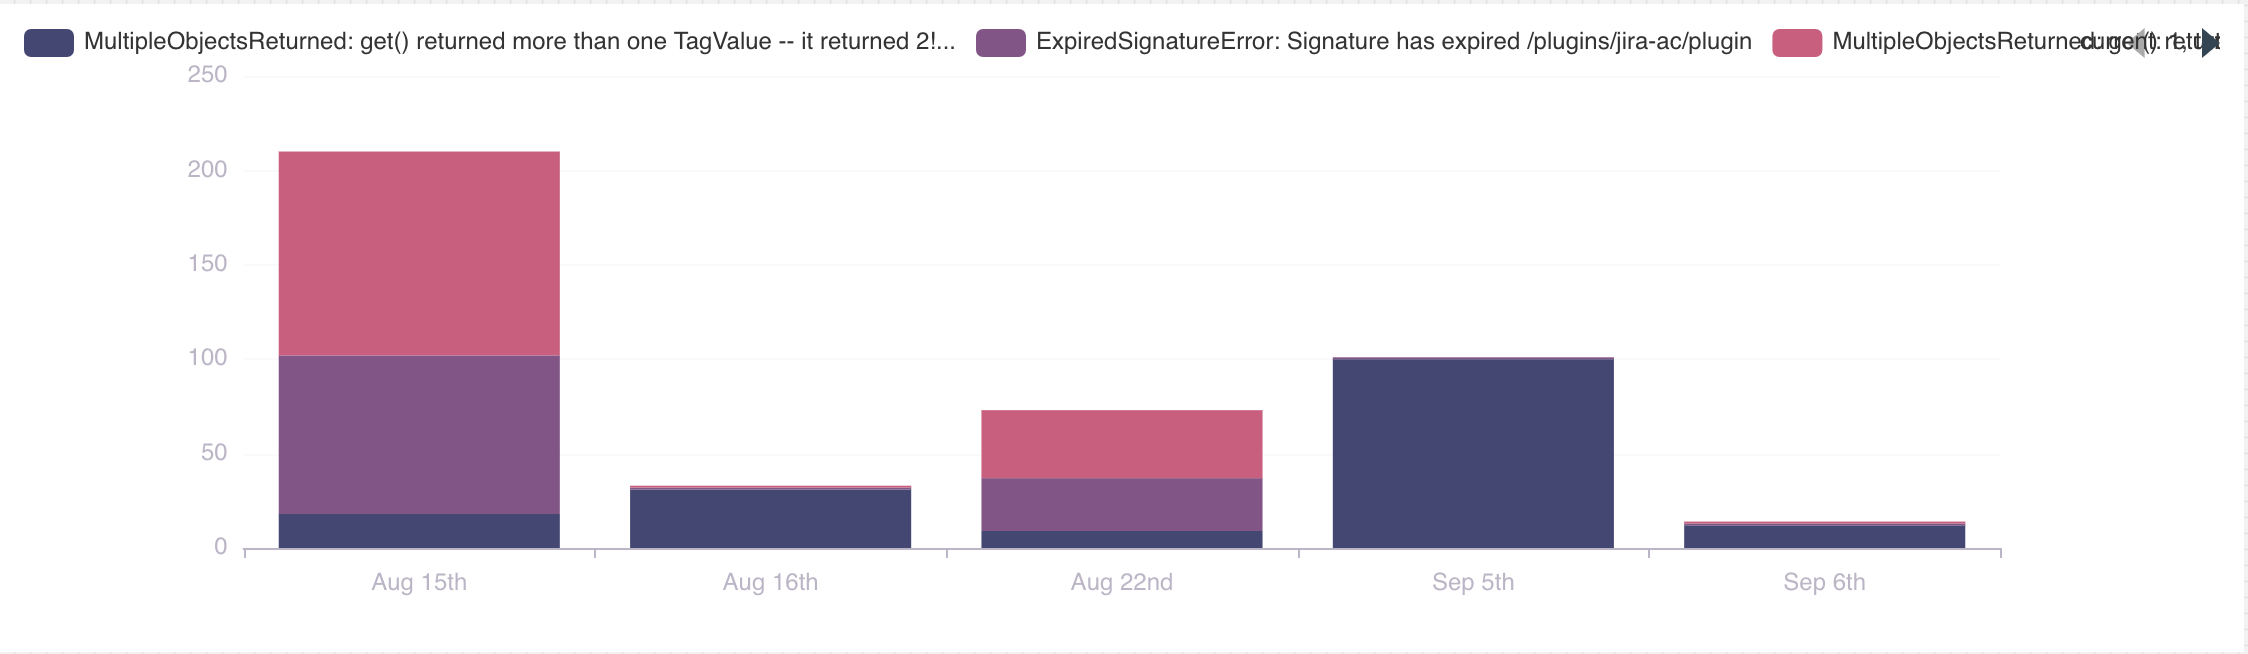
This is how the code below renders the graph (note the scroll arrows):
<!-- Copy and paste your 'echarts option' here. -->
<!-- [下方贴你的option,注意不要删掉下方 ```javascript 和 尾部的 ``` 字样。最好是我们能够直接运行的 option。如何得到能运行的 option 参见上方的 guidelines for contributing] -->
```javascript
option = {
<div style={{backgroundColor: 'white', padding: 12}}>
<BarChart
stacked={boolean('stacked', true)}
series={[
{
seriesName: text('Line 1', 'MultipleObjectsReturned: get() returned more than one TagValue -- it returned 2! sentry.tasks.index_event_tags'),
data: [
{value: 18, name: 'Aug 15th'},
{value: 31, name: 'Aug 16th'},
{value: 9, name: 'Aug 22nd'},
{value: 100, name: 'Sep 5th'},
{value: 12, name: 'Sep 6th'},
],
},
{
seriesName: text('Line 2', 'ExpiredSignatureError: Signature has expired /plugins/jira-ac/plugin'),
data: [
{value: 84, name: 'Aug 15th'},
{value: 1, name: 'Aug 16th'},
{value: 28, name: 'Aug 22nd'},
{value: 1, name: 'Sep 5th'},
{value: 1, name: 'Sep 6th'},
],
},
{
seriesName: text('Line 3', 'MultipleObjectsReturned: get() returned more than one TagValue -- it returned 3! sentry.tasks.index_event_tags'),
data: [
{value: 108, name: 'Aug 15th'},
{value: 1, name: 'Aug 16th'},
{value: 36, name: 'Aug 22nd'},
{value: null, name: 'Sep 5th'},
{value: 1, name: 'Sep 6th'},
],
},
]}
tooltip={{
filter: value => value !== null,
truncate: 50,
}}
legend={{
show: true,
data: [
'MultipleObjectsReturned: get() returned more than one TagValue -- it returned 2! sentry.tasks.index_event_tags',
'ExpiredSignatureError: Signature has expired /plugins/jira-ac/plugin',
'MultipleObjectsReturned: get() returned more than one TagValue -- it returned 3! sentry.tasks.index_event_tags',
],
padding: 'Legend Padding', 0,
type: 'scroll',
orient: 'Legend Orient (vertical or horizontal)', 'horizontal',
align: 'Legend Align (left, right)', 'auto',
left: 'center',
right: 'auto',
top: 'auto',
bottom: 'auto',
width: 'auto',
height: 'auto',
scrollDataIndex: 0,
pageButtonItemGap: 5,
pageButtonGap: null,
pageButtonPosition: 'end',
pageFormatter:
'current: 1, total: 3',
}}
height={300}
grid={{
top: 24,
bottom: 40,
left:'10%',
right:'10%',
}}
/>
</div>
}
```
and this is how my Legend component is constructed:
```
import 'echarts/lib/component/legend';
import 'echarts/lib/component/legendScroll';
export default function Legend(props = {}) {
return {
show: true,
type: 'scroll',
formatter: function(name) {
if (name.length > 80) {
return name.substring(0, 80) + '...';
} else {
return name;
}
},
...props,
};
}
```
----------------------------------------------------------------
This is an automated message from the Apache Git Service.
To respond to the message, please log on GitHub and use the
URL above to go to the specific comment.
For queries about this service, please contact Infrastructure at:
users@infra.apache.org
With regards,
Apache Git Services
---------------------------------------------------------------------
To unsubscribe, e-mail: dev-unsubscribe@echarts.apache.org
For additional commands, e-mail: dev-help@echarts.apache.org