You are viewing a plain text version of this content. The canonical link for it is here.
Posted to dev@echarts.apache.org by GitBox <gi...@apache.org> on 2018/08/13 06:44:23 UTC
[GitHub] htsuki opened a new issue #8859: echarts加载json数据如何动态生成效果
htsuki opened a new issue #8859: echarts加载json数据如何动态生成效果
URL: https://github.com/apache/incubator-echarts/issues/8859
<!--
为了方便我们能够复现和修复 bug,请遵从下面的规范描述您的问题。
-->
### One-line summary [问题简述]
需要实现一些功能:echarts获取json数据异步加载到页面中,并且json数据后续会更新,如何在不手动修改代码的情况下使用echarts或其他JS动态增加生成.
### Version & Environment [版本及环境]
+ ECharts version [ECharts 版本]:4.1
+ Browser version [浏览器类型和版本]:68.0.3440.106
+ OS Version [操作系统类型和版本]:WIN7 WIN10
### Expected behaviour [期望结果]
### ECharts option [ECharts配置项]
<!-- Copy and paste your 'echarts option' here. -->
<!-- [下方贴你的option,注意不要删掉下方 ```javascript 和 尾部的 ``` 字样。最好是我们能够直接运行的 option。如何得到能运行的 option 参见上方的 guidelines for contributing] -->
```javascript
<script>
$(document).ready(function(){
var chart = document.getElementById('chart');
var chartData = echarts.init(chart);
chartData.setOption({
title: {
text: '异步数据加载示例'
},
tooltip: {},
legend: {
data:['华为', 'OPPO', 'VIVO']
},
xAxis: {
data: []
},
yAxis: {},
series: [
{
name: '华为',
type: 'bar',
data: []
},
{
name: 'OPPO',
type: 'bar',
data: []
},
{
name: 'VIVO',
type: 'bar',
data: []
},
]
});
$.get('../csv2json/test.json').done(function (data) {
console.dir(data);
// 填入数据
var data = JSON.parse(data);
chartData.setOption({
xAxis: {
data: data.列1
},
series: [
{
name: '华为',
data: data.华为
},
{
name: 'OPPO',
data: data.OPPO
},
{
name: 'VIVO',
data: data.VIVO
},
]
});
});
function eConsole(param)
{
console.dir(param);
}
chartData.on("click",eConsole);
});
</script>
```
### Other comments [其他信息]
<!-- For example: Screenshot or Online demo -->
<!-- [例如,截图或线上实例 (JSFiddle/JSBin/Codepen)] -->
目前的效果图
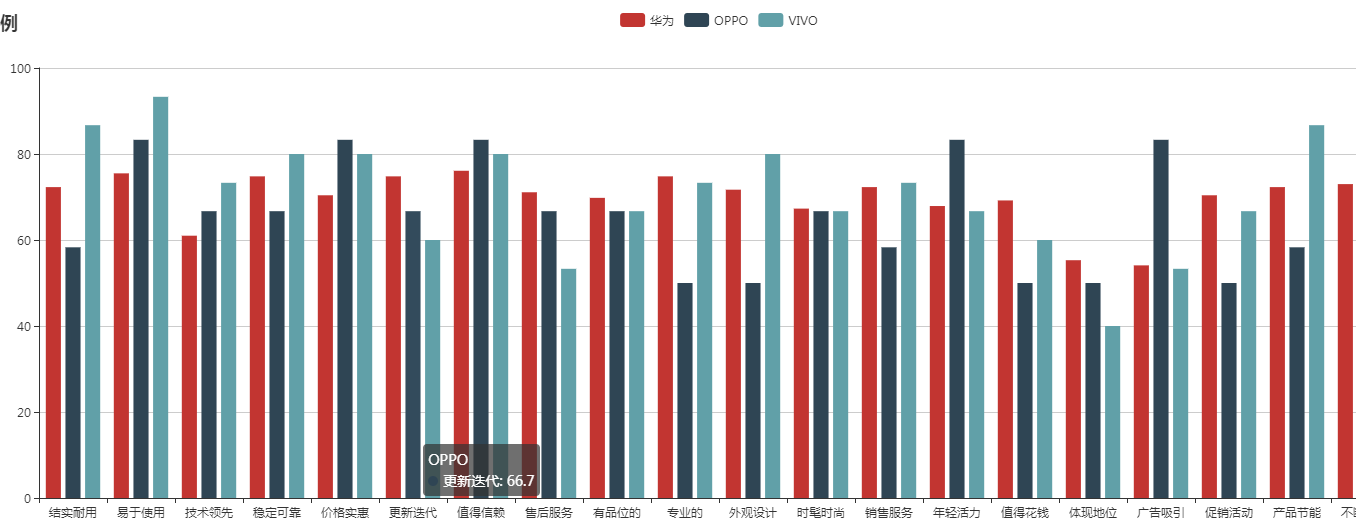
json数据
{
"VIVO": [
"86.7",
"93.3",
"73.3",
"80",
"80",
"60",
"80",
"53.3",
"66.7",
"73.3",
"80",
"66.7",
"73.3",
"66.7",
"60",
"40",
"53.3",
"66.7",
"86.7",
"53.3"
],
"华为": [
"72.3",
"75.5",
"61",
"74.8",
"70.4",
"74.8",
"76.1",
"71.1",
"69.8",
"74.8",
"71.7",
"67.3",
"72.3",
"67.9",
"69.2",
"55.3",
"54.1",
"70.4",
"72.3",
"73"
],
"列1": [
"结实耐用",
"易于使用",
"技术领先",
"稳定可靠",
"价格实惠",
"更新迭代",
"值得信赖",
"售后服务",
"有品位的",
"专业的",
"外观设计",
"时髦时尚",
"销售服务",
"年轻活力",
"值得花钱",
"体现地位",
"广告吸引",
"促销活动",
"产品节能",
"不断创新"
]
}
比如我json数据中增加了OPPO的数据,我需要手动在series中为OPPO创建空间才可以显示在页面中,那么如何可以在我不手动增加代码的情况下让JS知道json数据更新了,并且动态生成呢?这个功能是否可以实现?echarts是否有这个功能?还是说需要写一些JS呢?
----------------------------------------------------------------
This is an automated message from the Apache Git Service.
To respond to the message, please log on GitHub and use the
URL above to go to the specific comment.
For queries about this service, please contact Infrastructure at:
users@infra.apache.org
With regards,
Apache Git Services
---------------------------------------------------------------------
To unsubscribe, e-mail: dev-unsubscribe@echarts.apache.org
For additional commands, e-mail: dev-help@echarts.apache.org