You are viewing a plain text version of this content. The canonical link for it is here.
Posted to commits@echarts.apache.org by GitBox <gi...@apache.org> on 2022/06/09 04:31:47 UTC
[GitHub] [echarts] shadabumer opened a new issue, #17186: [Bug] Echarts are plotted wrongly for type time, if the time data is given with timezone offset
shadabumer opened a new issue, #17186:
URL: https://github.com/apache/echarts/issues/17186
### Version
5.2.1
### Link to Minimal Reproduction
_No response_
### Steps to Reproduce
**_index.html_**
```
<!DOCTYPE html>
<html lang="en">
<head>
<meta charset="utf-8">
<title>Area Pieces - Apache ECharts Demo</title>
<link rel="stylesheet" href="./style.css">
</head>
<body>
<div id="chart-container"></div>
<script src="https://fastly.jsdelivr.net/npm/echarts@5.3.2/dist/echarts.min.js"></script>
<script src="./index.js"></script>
</body>
</html>
```
**_index.js_**
```
var dom = document.getElementById("chart-container");
var myChart = echarts.init(dom, null, {
renderer: "canvas",
useDirtyRect: false
});
var app = {};
var option;
option = {
xAxis: {
type: "time",
boundaryGap: false
},
yAxis: {
type: "value",
boundaryGap: [0, "30%"]
},
visualMap: {
type: "piecewise",
show: false,
dimension: 0,
seriesIndex: 0,
pieces: [
{
gt: 1,
lt: 3,
color: "rgba(0, 0, 180, 0.4)"
},
{
gt: 5,
lt: 7,
color: "rgba(0, 0, 180, 0.4)"
}
]
},
series: [
{
type: "line",
smooth: 0,
symbol: "none",
lineStyle: {
color: "#5470C6",
width: 5
},
markLine: {
symbol: ["none", "none"],
label: { show: false },
data: [{ xAxis: 1 }, { xAxis: 3 }, { xAxis: 5 }, { xAxis: 7 }]
},
areaStyle: {},
data: [
["2022-05-31 17:25:00+05:30", 19],
["2022-05-31 17:30:00+05:30", 29],
["2022-05-31 17:35:00+05:30", 39],
["2022-05-31 17:40:00+05:30", 49],
["2022-05-31 17:45:00+05:30", 19],
["2022-05-31 17:50:00+05:30", 19],
["2022-05-31 17:55:00+05:30", 19],
["2022-05-31 18:00:00+05:30", 19],
["2022-05-31 18:05:00+05:30", 19],
["2022-05-31 18:10:00+05:30", 19],
["2022-05-31 18:15:00+05:30", 19]
]
}
]
};
if (option && typeof option === "object") {
myChart.setOption(option);
}
window.addEventListener("resize", myChart.resize);
```
Here in the series data, along with date and time, timezone (+05:30) is also provided.
### Current Behavior
The chart plotted against the data is skewed by 30 mins.
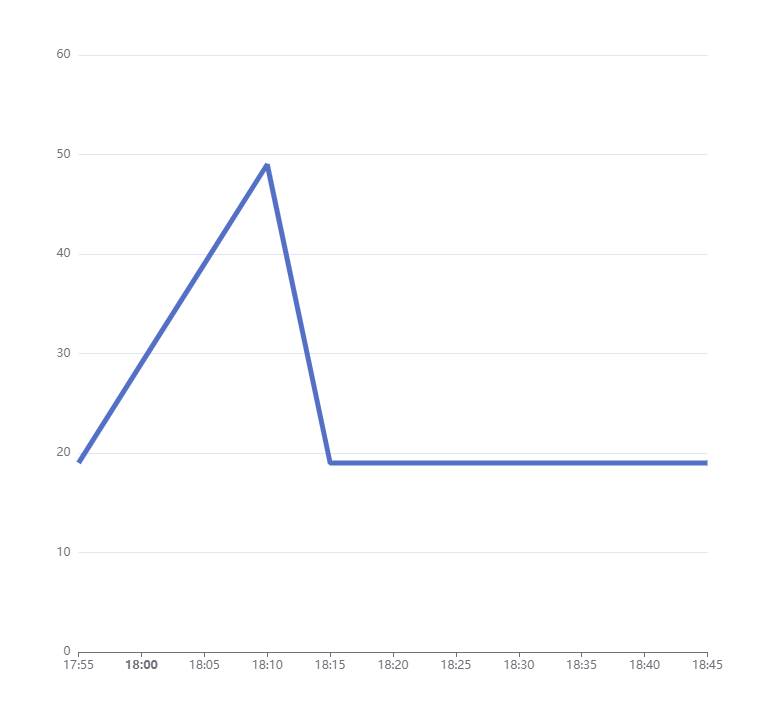
### Expected Behavior
Users expect the chart to start the plotting from 17:25 but it begins at 17:55 and is expected to end at 18:15 but ends at 18:45.
### Environment
```markdown
- OS: Windows
- Browser: Chrome
- Framework: Vanilla JS, Angular@11
```
### Any additional comments?
_No response_
--
This is an automated message from the Apache Git Service.
To respond to the message, please log on to GitHub and use the
URL above to go to the specific comment.
To unsubscribe, e-mail: commits-unsubscribe@echarts.apache.org.apache.org
For queries about this service, please contact Infrastructure at:
users@infra.apache.org
---------------------------------------------------------------------
To unsubscribe, e-mail: commits-unsubscribe@echarts.apache.org
For additional commands, e-mail: commits-help@echarts.apache.org
[GitHub] [echarts] shadabumer commented on issue #17186: [Bug] Echarts are plotted wrongly for type time, if the time data is given with timezone offset
Posted by GitBox <gi...@apache.org>.
shadabumer commented on issue #17186:
URL: https://github.com/apache/echarts/issues/17186#issuecomment-1157343120

   My current time zone is **(GMT+5:30) Indian Standard Time**. So for the data point `["2022-05-31 17:25:00+05:30", 19]` the line should be plotted at 17:25, but currently, it's plotting to 17:55 which is differed by 30 minutes.

   I am not sure about your time zone. So to test in your system, you can change your system's timezone to (GMT+5:30) and check the output


--
This is an automated message from the Apache Git Service.
To respond to the message, please log on to GitHub and use the
URL above to go to the specific comment.

To unsubscribe, e-mail: commits-unsubscribe@echarts.apache.org

For queries about this service, please contact Infrastructure at:
users@infra.apache.org


---------------------------------------------------------------------
To unsubscribe, e-mail: commits-unsubscribe@echarts.apache.org
For additional commands, e-mail: commits-help@echarts.apache.org
[GitHub] [echarts] shadabumer commented on issue #17186: [Bug] Echarts are plotted wrongly for type time, if the time data is given with timezone offset
Posted by GitBox <gi...@apache.org>.
shadabumer commented on issue #17186:
URL: https://github.com/apache/echarts/issues/17186#issuecomment-1156001403

   The reproduction link which I have provided uses the echart version 5.3.2 and the problem still exists.


--
This is an automated message from the Apache Git Service.
To respond to the message, please log on to GitHub and use the
URL above to go to the specific comment.

To unsubscribe, e-mail: commits-unsubscribe@echarts.apache.org

For queries about this service, please contact Infrastructure at:
users@infra.apache.org


---------------------------------------------------------------------
To unsubscribe, e-mail: commits-unsubscribe@echarts.apache.org
For additional commands, e-mail: commits-help@echarts.apache.org
[GitHub] [echarts] jiawulin001 commented on issue #17186: [Bug] Echarts are plotted wrongly for type time, if the time data is given with timezone offset
Posted by GitBox <gi...@apache.org>.
jiawulin001 commented on issue #17186:
URL: https://github.com/apache/echarts/issues/17186#issuecomment-1155926059

   As is tested, there seems not to be such bugs in 5.3.x.. Would you mind trying using 5.3.x to plot?


--
This is an automated message from the Apache Git Service.
To respond to the message, please log on to GitHub and use the
URL above to go to the specific comment.

To unsubscribe, e-mail: commits-unsubscribe@echarts.apache.org

For queries about this service, please contact Infrastructure at:
users@infra.apache.org


---------------------------------------------------------------------
To unsubscribe, e-mail: commits-unsubscribe@echarts.apache.org
For additional commands, e-mail: commits-help@echarts.apache.org
Re: [I] [Bug] Echarts are plotted wrongly for type time, if the time data is given with timezone offset [echarts]
Posted by "devnull73 (via GitHub)" <gi...@apache.org>.
devnull73 commented on issue #17186:
URL: https://github.com/apache/echarts/issues/17186#issuecomment-2011196509

   Can confirm, we have the same issue. Our local TZ is UTC+8:00, but the data is UTC+9:30. The data is offset by 30 mins, as if it is interpretting the timezone as UTC+9.


--
This is an automated message from the Apache Git Service.
To respond to the message, please log on to GitHub and use the
URL above to go to the specific comment.

To unsubscribe, e-mail: commits-unsubscribe@echarts.apache.org

For queries about this service, please contact Infrastructure at:
users@infra.apache.org


---------------------------------------------------------------------
To unsubscribe, e-mail: commits-unsubscribe@echarts.apache.org
For additional commands, e-mail: commits-help@echarts.apache.org
[GitHub] [echarts] jiawulin001 commented on issue #17186: [Bug] Echarts are plotted wrongly for type time, if the time data is given with timezone offset
Posted by GitBox <gi...@apache.org>.
jiawulin001 commented on issue #17186:
URL: https://github.com/apache/echarts/issues/17186#issuecomment-1156034093
Right, what I am seeing is as followed in your link:
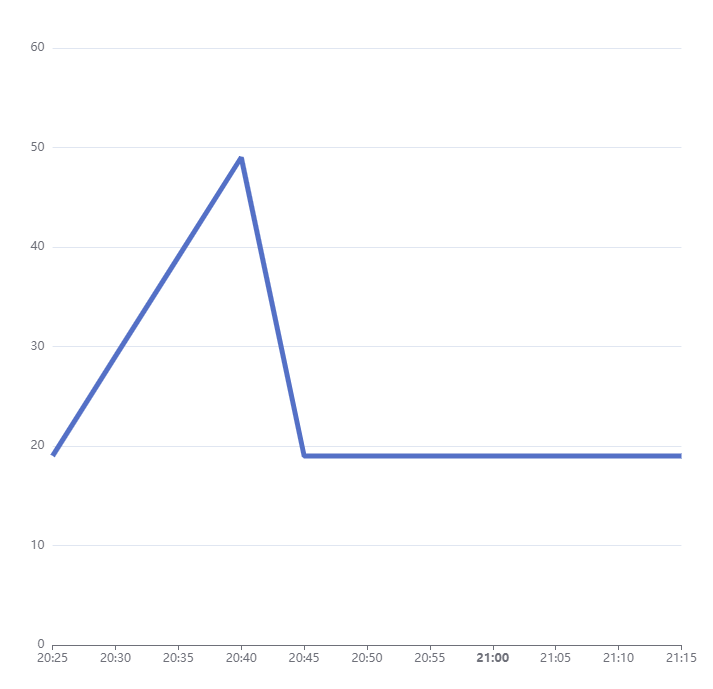
And it doesn't look like what you've provided in the issue and looks good to me.
Is this demo what you think is problematic? Did I miss anything?
--
This is an automated message from the Apache Git Service.
To respond to the message, please log on to GitHub and use the
URL above to go to the specific comment.
To unsubscribe, e-mail: commits-unsubscribe@echarts.apache.org
For queries about this service, please contact Infrastructure at:
users@infra.apache.org
---------------------------------------------------------------------
To unsubscribe, e-mail: commits-unsubscribe@echarts.apache.org
For additional commands, e-mail: commits-help@echarts.apache.org
Re: [I] [Bug] Echarts are plotted wrongly for type time, if the time data is given with timezone offset [echarts]
Posted by "devnull73 (via GitHub)" <gi...@apache.org>.
devnull73 commented on issue #17186:
URL: https://github.com/apache/echarts/issues/17186#issuecomment-2011249005

   Still exists in echarts 5.5.0


--
This is an automated message from the Apache Git Service.
To respond to the message, please log on to GitHub and use the
URL above to go to the specific comment.

To unsubscribe, e-mail: commits-unsubscribe@echarts.apache.org

For queries about this service, please contact Infrastructure at:
users@infra.apache.org


---------------------------------------------------------------------
To unsubscribe, e-mail: commits-unsubscribe@echarts.apache.org
For additional commands, e-mail: commits-help@echarts.apache.org