You are viewing a plain text version of this content. The canonical link for it is here.
Posted to commits@dolphinscheduler.apache.org by GitBox <gi...@apache.org> on 2020/10/11 19:24:37 UTC
[GitHub] [incubator-dolphinscheduler-website] Segun-Ogundipe opened a new pull request #190: [Feature][Docs] Add English version of "system-manual" to the documentation
Segun-Ogundipe opened a new pull request #190:
URL: https://github.com/apache/incubator-dolphinscheduler-website/pull/190


   # What is the purpose of the pull request

   This adds the English version of the "system-manual" to the user documentation.

   # Change Log

   - Add "docs/en-us/1.3.2/user-doc/system-manual.md"
   - Add "img/create_project_en.png"

   # How to verify this PR

   - Clone the branch
   - npm i
   - docsite start
   - Go to "localhost:8080/en-us/docs/1.3.2/user_doc/system-manual.html"


----------------------------------------------------------------
This is an automated message from the Apache Git Service.
To respond to the message, please log on to GitHub and use the
URL above to go to the specific comment.

For queries about this service, please contact Infrastructure at:
users@infra.apache.org
[GitHub] [incubator-dolphinscheduler-website] AhahaGe commented on pull request #190: [Feature][Docs] Add English version of "system-manual" to the documentation
Posted by GitBox <gi...@apache.org>.
AhahaGe commented on pull request #190:
URL: https://github.com/apache/incubator-dolphinscheduler-website/pull/190#issuecomment-707664580


   Hi, I suggest we translate in the same format, content of task instance part is the same as workflow part but translate different, all be optional, or all be not required, not part optional ,part not required. Example in en version is supplement the data from September 19 to October 16,  but may 1 to 10 in cn version. @Segun-Ogundipe @dailidong


----------------------------------------------------------------
This is an automated message from the Apache Git Service.
To respond to the message, please log on to GitHub and use the
URL above to go to the specific comment.

For queries about this service, please contact Infrastructure at:
users@infra.apache.org
[GitHub] [incubator-dolphinscheduler-website] AhahaGe commented on a change in pull request #190: [Feature][Docs] Add English version of "system-manual" to the documentation
Posted by GitBox <gi...@apache.org>.
AhahaGe commented on a change in pull request #190:
URL: https://github.com/apache/incubator-dolphinscheduler-website/pull/190#discussion_r503241561


##########
File path: docs/en-us/1.3.2/user_doc/system-manual.md
##########
@@ -0,0 +1,883 @@
+# System User Manual
+
+## Get started quickly
+
+> Please refer to [Quick Start](quick-start.html)
+
+## Operation guide
+
+### 1. Home
+
+The home page contains task status statistics, process status statistics, and workflow definition statistics for all projects of the user.
+
+<p align="center">
+<img src="/img/home_en.png" width="80%" />
+</p>
+
+### 2. Project management
+
+#### 2.1 Create project
+
+- Click "Project Management" to enter the project management page, click the "Create Project" button, enter the project name, project description, and click "Submit" to create a new project.
+
+  <p align="center">
+      <img src="/img/create_project_en1.png" width="80%" />
+  </p>
+
+#### 2.2 Project home
+
+- Click the project name link on the project management page to enter the project home page, as shown in the figure below, the project home page contains the task status statistics, process status statistics, and workflow definition statistics of the project.
+  <p align="center">
+     <img src="/img/project_home_en.png" width="80%" />
+  </p>
+
+- Task status statistics: within the specified time range, count the number of tasks in the task instance as successful submission, running, ready to pause, pause, ready to stop, stop, failure, success, fault tolerance, kill, and waiting threads
+- Process status statistics: within the specified time range, count the number of the status of the workflow instance as submission success, running, ready to pause, pause, ready to stop, stop, failure, success, fault tolerance, kill, and waiting threads
+- Workflow definition statistics: Count the workflow definitions created by users and the workflow definitions granted to this user by the administrator
+
+#### 2.3 Workflow definition
+
+#### <span id=creatDag>2.3.1 Create a workflow definition</span>
+
+- Click Project Management -> Workflow -> Workflow Definition to enter the workflow definition page, and click the "Create Workflow" button to enter the **workflow DAG edit** page, as shown in the following figure:
+  <p align="center">
+      <img src="/img/dag5.png" width="80%" />
+  </p>
+- Drag in the toolbar <img src="/img/shell.png" width="35"/> Add a Shell task to the drawing board, as shown in the figure below:
+  <p align="center">
+      <img src="/img/shell-en.png" width="80%" />
+  </p>
+- **Add parameter settings for shell tasks:**
+
+1. Fill in the "Node Name", "Description", and "Script" fields;
+2. Check “Normal” for “Run Flag”. If “Prohibit Execution” is checked, the task will not be executed when running the workflow;
+3. Select "Task Priority": When the number of worker threads is insufficient, high-level tasks will be executed first in the execution queue, and tasks with the same priority will be executed in the order of first in, first out;
+4. Timeout alarm (not required): Check the timeout alarm, timeout failure, and fill in the "timeout period". When the task execution time exceeds **timeout period**, an alert email will be sent and the task timeout fails;
+5. Resources (optional). Resource files are files created or uploaded on the Resource Center -> File Management page. For example, the file name is `test.sh`, and the command to call the resource in the script is `sh test.sh`;
+6. Custom parameters (not required), refer to [Custom Parameters](#UserDefinedParameters);
+7. Click the "Confirm Add" button to save the task settings.
+
+- **Increase the order of task execution:** Click the icon in the upper right corner <img src="/img/line.png" width="35"/> to connect the task; as shown in the figure below, task 2 and task 3 are executed in parallel, When task 1 is executed, tasks 2 and 3 will be executed simultaneously.
+
+  <p align="center">
+     <img src="/img/dag6.png" width="80%" />
+  </p>
+
+- **Delete dependencies:** Click the "arrow" icon in the upper right corner <img src="/img/arrow.png" width="35"/>, select the connection line, and click the "Delete" icon in the upper right corner <img src= "/img/delete.png" width="35"/>, delete dependencies between tasks.
+  <p align="center">
+     <img src="/img/dag7.png" width="80%" />
+  </p>
+
+- **Save workflow definition:** Click the "Save" button, and the "Set DAG chart name" pop-up box will pop up, as shown in the figure below. Enter the workflow definition name, workflow definition description, and set global parameters (optional, refer to [ Custom parameters](#UserDefinedParameters)), click the "Add" button, and the workflow definition is created successfully.
+  <p align="center">
+     <img src="/img/dag8.png" width="80%" />
+   </p>
+> For other types of tasks, please refer to [Task Node Type and Parameter Settings](#TaskParamers).
+
+#### 2.3.2 Workflow definition operation function
+
+Click Project Management -> Workflow -> Workflow Definition to enter the workflow definition page, as shown below:
+
+<p align="center">
+<img src="/img/work_list_en.png" width="80%" />
+</p>
+The operation functions of the workflow definition list are as follows:
+
+- **Edit:** Only "offline" workflow definitions can be edited. Workflow DAG editing is the same as [Create Workflow Definition](#creatDag).
+- **Online:** When the workflow status is "Offline", the workflow is online. Only the workflow in the "Online" state can run, but cannot be edited.
+- **Offline:** When the workflow status is "Online", the workflow is offline. Only the workflow in the "Offline" state can be edited, but not run.
+- **Run:** Only workflow in the online state can run. See [2.3.3 Run Workflow](#runWorkflow) for the operation steps
+- **Timing:** Timing can only be set in online workflows, and the system automatically schedules the workflow to run on a regular basis. The status after creating a timing is "offline", and the timing must be online on the timing management page to take effect. See [2.3.4 Workflow Timing](#creatTiming) for timing operation steps.
+- **Timing Management:** The timing management page can be edited, online/offline, and deleted.
+- **Delete:** Delete the workflow definition.
+- **Download:** Download workflow definition to local.
+- **Tree Diagram:** Display the task node type and task status in a tree structure, as shown in the figure below:
+  <p align="center">
+      <img src="/img/tree_en.png" width="80%" />
+  </p>
+
+#### <span id=runWorkflow>2.3.3 Run the workflow</span>
+
+- Click Project Management -> Workflow -> Workflow Definition to enter the workflow definition page, as shown in the figure below, click the "Go Online" button <img src="/img/online.png" width="35"/>,Go online workflow.
+  <p align="center">
+      <img src="/img/work_list_en.png" width="80%" />
+  </p>
+
+- Click the "Run" button to pop up the startup parameter setting pop-up box, as shown in the figure below, set the startup parameters, click the "Run" button in the pop-up box, the workflow starts running, and the workflow instance page generates a workflow instance.
+     <p align="center">
+       <img src="/img/run_work_en.png" width="80%" />
+     </p>
+  <span id=runParamers>Description of workflow operating parameters:</span>
+
+      * Failure strategy: When a task node fails to execute, other parallel task nodes need to execute the strategy. "Continue" means: after a certain task fails, other task nodes execute normally; "End" means: terminate all tasks being executed, and terminate the entire process.
+      * Notification strategy: When the process is over, the process execution information notification email is sent according to the process status, including any status is not sent, successful, failed, successful or failed.

Review comment:
       ```suggestion
         * Notification strategy: When the process is over, the process execution information notification email is sent according to the process status, _including any status is not sent, successful, failed, successful or failed._ need improve
   ```


----------------------------------------------------------------
This is an automated message from the Apache Git Service.
To respond to the message, please log on to GitHub and use the
URL above to go to the specific comment.

For queries about this service, please contact Infrastructure at:
users@infra.apache.org
[GitHub] [incubator-dolphinscheduler-website] AhahaGe commented on a change in pull request #190: [Feature][Docs] Add English version of "system-manual" to the documentation
Posted by GitBox <gi...@apache.org>.
AhahaGe commented on a change in pull request #190:
URL: https://github.com/apache/incubator-dolphinscheduler-website/pull/190#discussion_r503236657


##########
File path: docs/en-us/1.3.2/user_doc/system-manual.md
##########
@@ -0,0 +1,883 @@
+# System User Manual
+
+## Get started quickly
+
+> Please refer to [Quick Start](quick-start.html)
+
+## Operation guide
+
+### 1. Home
+
+The home page contains task status statistics, process status statistics, and workflow definition statistics for all projects of the user.
+
+<p align="center">
+<img src="/img/home_en.png" width="80%" />
+</p>
+
+### 2. Project management
+
+#### 2.1 Create project
+
+- Click "Project Management" to enter the project management page, click the "Create Project" button, enter the project name, project description, and click "Submit" to create a new project.
+
+  <p align="center">
+      <img src="/img/create_project_en1.png" width="80%" />
+  </p>
+
+#### 2.2 Project home
+
+- Click the project name link on the project management page to enter the project home page, as shown in the figure below, the project home page contains the task status statistics, process status statistics, and workflow definition statistics of the project.
+  <p align="center">
+     <img src="/img/project_home_en.png" width="80%" />
+  </p>
+
+- Task status statistics: within the specified time range, count the number of tasks in the task instance as successful submission, running, ready to pause, pause, ready to stop, stop, failure, success, fault tolerance, kill, and waiting threads
+- Process status statistics: within the specified time range, count the number of the status of the workflow instance as submission success, running, ready to pause, pause, ready to stop, stop, failure, success, fault tolerance, kill, and waiting threads
+- Workflow definition statistics: Count the workflow definitions created by users and the workflow definitions granted to this user by the administrator
+
+#### 2.3 Workflow definition
+
+#### <span id=creatDag>2.3.1 Create a workflow definition</span>
+
+- Click Project Management -> Workflow -> Workflow Definition to enter the workflow definition page, and click the "Create Workflow" button to enter the **workflow DAG edit** page, as shown in the following figure:
+  <p align="center">
+      <img src="/img/dag5.png" width="80%" />
+  </p>
+- Drag in the toolbar <img src="/img/shell.png" width="35"/> Add a Shell task to the drawing board, as shown in the figure below:
+  <p align="center">
+      <img src="/img/shell-en.png" width="80%" />
+  </p>
+- **Add parameter settings for shell tasks:**
+
+1. Fill in the "Node Name", "Description", and "Script" fields;
+2. Check “Normal” for “Run Flag”. If “Prohibit Execution” is checked, the task will not be executed when running the workflow;
+3. Select "Task Priority": When the number of worker threads is insufficient, high-level tasks will be executed first in the execution queue, and tasks with the same priority will be executed in the order of first in, first out;
+4. Timeout alarm (not required): Check the timeout alarm, timeout failure, and fill in the "timeout period". When the task execution time exceeds **timeout period**, an alert email will be sent and the task timeout fails;
+5. Resources (optional). Resource files are files created or uploaded on the Resource Center -> File Management page. For example, the file name is `test.sh`, and the command to call the resource in the script is `sh test.sh`;
+6. Custom parameters (not required), refer to [Custom Parameters](#UserDefinedParameters);
+7. Click the "Confirm Add" button to save the task settings.
+
+- **Increase the order of task execution:** Click the icon in the upper right corner <img src="/img/line.png" width="35"/> to connect the task; as shown in the figure below, task 2 and task 3 are executed in parallel, When task 1 is executed, tasks 2 and 3 will be executed simultaneously.
+
+  <p align="center">
+     <img src="/img/dag6.png" width="80%" />
+  </p>
+
+- **Delete dependencies:** Click the "arrow" icon in the upper right corner <img src="/img/arrow.png" width="35"/>, select the connection line, and click the "Delete" icon in the upper right corner <img src= "/img/delete.png" width="35"/>, delete dependencies between tasks.
+  <p align="center">
+     <img src="/img/dag7.png" width="80%" />
+  </p>
+
+- **Save workflow definition:** Click the "Save" button, and the "Set DAG chart name" pop-up box will pop up, as shown in the figure below. Enter the workflow definition name, workflow definition description, and set global parameters (optional, refer to [ Custom parameters](#UserDefinedParameters)), click the "Add" button, and the workflow definition is created successfully.
+  <p align="center">
+     <img src="/img/dag8.png" width="80%" />
+   </p>
+> For other types of tasks, please refer to [Task Node Type and Parameter Settings](#TaskParamers).
+
+#### 2.3.2 Workflow definition operation function
+
+Click Project Management -> Workflow -> Workflow Definition to enter the workflow definition page, as shown below:
+
+<p align="center">
+<img src="/img/work_list_en.png" width="80%" />
+</p>
+The operation functions of the workflow definition list are as follows:
+
+- **Edit:** Only "offline" workflow definitions can be edited. Workflow DAG editing is the same as [Create Workflow Definition](#creatDag).
+- **Online:** When the workflow status is "Offline", the workflow is online. Only the workflow in the "Online" state can run, but cannot be edited.

Review comment:
       ```suggestion
   - **Online:** When the workflow status is "Offline", used to online workflow. Only the workflow in the "Online" state can run, but cannot be edited.
   ```

##########
File path: docs/en-us/1.3.2/user_doc/system-manual.md
##########
@@ -0,0 +1,883 @@
+# System User Manual
+
+## Get started quickly
+
+> Please refer to [Quick Start](quick-start.html)
+
+## Operation guide
+
+### 1. Home
+
+The home page contains task status statistics, process status statistics, and workflow definition statistics for all projects of the user.
+
+<p align="center">
+<img src="/img/home_en.png" width="80%" />
+</p>
+
+### 2. Project management
+
+#### 2.1 Create project
+
+- Click "Project Management" to enter the project management page, click the "Create Project" button, enter the project name, project description, and click "Submit" to create a new project.
+
+  <p align="center">
+      <img src="/img/create_project_en1.png" width="80%" />
+  </p>
+
+#### 2.2 Project home
+
+- Click the project name link on the project management page to enter the project home page, as shown in the figure below, the project home page contains the task status statistics, process status statistics, and workflow definition statistics of the project.
+  <p align="center">
+     <img src="/img/project_home_en.png" width="80%" />
+  </p>
+
+- Task status statistics: within the specified time range, count the number of tasks in the task instance as successful submission, running, ready to pause, pause, ready to stop, stop, failure, success, fault tolerance, kill, and waiting threads
+- Process status statistics: within the specified time range, count the number of the status of the workflow instance as submission success, running, ready to pause, pause, ready to stop, stop, failure, success, fault tolerance, kill, and waiting threads
+- Workflow definition statistics: Count the workflow definitions created by users and the workflow definitions granted to this user by the administrator
+
+#### 2.3 Workflow definition
+
+#### <span id=creatDag>2.3.1 Create a workflow definition</span>
+
+- Click Project Management -> Workflow -> Workflow Definition to enter the workflow definition page, and click the "Create Workflow" button to enter the **workflow DAG edit** page, as shown in the following figure:
+  <p align="center">
+      <img src="/img/dag5.png" width="80%" />
+  </p>
+- Drag in the toolbar <img src="/img/shell.png" width="35"/> Add a Shell task to the drawing board, as shown in the figure below:
+  <p align="center">
+      <img src="/img/shell-en.png" width="80%" />
+  </p>
+- **Add parameter settings for shell tasks:**
+
+1. Fill in the "Node Name", "Description", and "Script" fields;
+2. Check “Normal” for “Run Flag”. If “Prohibit Execution” is checked, the task will not be executed when running the workflow;
+3. Select "Task Priority": When the number of worker threads is insufficient, high-level tasks will be executed first in the execution queue, and tasks with the same priority will be executed in the order of first in, first out;
+4. Timeout alarm (not required): Check the timeout alarm, timeout failure, and fill in the "timeout period". When the task execution time exceeds **timeout period**, an alert email will be sent and the task timeout fails;
+5. Resources (optional). Resource files are files created or uploaded on the Resource Center -> File Management page. For example, the file name is `test.sh`, and the command to call the resource in the script is `sh test.sh`;
+6. Custom parameters (not required), refer to [Custom Parameters](#UserDefinedParameters);
+7. Click the "Confirm Add" button to save the task settings.
+
+- **Increase the order of task execution:** Click the icon in the upper right corner <img src="/img/line.png" width="35"/> to connect the task; as shown in the figure below, task 2 and task 3 are executed in parallel, When task 1 is executed, tasks 2 and 3 will be executed simultaneously.
+
+  <p align="center">
+     <img src="/img/dag6.png" width="80%" />
+  </p>
+
+- **Delete dependencies:** Click the "arrow" icon in the upper right corner <img src="/img/arrow.png" width="35"/>, select the connection line, and click the "Delete" icon in the upper right corner <img src= "/img/delete.png" width="35"/>, delete dependencies between tasks.
+  <p align="center">
+     <img src="/img/dag7.png" width="80%" />
+  </p>
+
+- **Save workflow definition:** Click the "Save" button, and the "Set DAG chart name" pop-up box will pop up, as shown in the figure below. Enter the workflow definition name, workflow definition description, and set global parameters (optional, refer to [ Custom parameters](#UserDefinedParameters)), click the "Add" button, and the workflow definition is created successfully.
+  <p align="center">
+     <img src="/img/dag8.png" width="80%" />
+   </p>
+> For other types of tasks, please refer to [Task Node Type and Parameter Settings](#TaskParamers).
+
+#### 2.3.2 Workflow definition operation function
+
+Click Project Management -> Workflow -> Workflow Definition to enter the workflow definition page, as shown below:
+
+<p align="center">
+<img src="/img/work_list_en.png" width="80%" />
+</p>
+The operation functions of the workflow definition list are as follows:
+
+- **Edit:** Only "offline" workflow definitions can be edited. Workflow DAG editing is the same as [Create Workflow Definition](#creatDag).
+- **Online:** When the workflow status is "Offline", the workflow is online. Only the workflow in the "Online" state can run, but cannot be edited.
+- **Offline:** When the workflow status is "Online", the workflow is offline. Only the workflow in the "Offline" state can be edited, but not run.

Review comment:
       ```suggestion
   - **Offline:** When the workflow status is "Online", used to offline workflow. Only the workflow in the "Offline" state can be edited, but not run.
   ```


----------------------------------------------------------------
This is an automated message from the Apache Git Service.
To respond to the message, please log on to GitHub and use the
URL above to go to the specific comment.

For queries about this service, please contact Infrastructure at:
users@infra.apache.org
[GitHub] [incubator-dolphinscheduler-website] AhahaGe commented on a change in pull request #190: [Feature][Docs] Add English version of "system-manual" to the documentation
Posted by GitBox <gi...@apache.org>.
AhahaGe commented on a change in pull request #190:
URL: https://github.com/apache/incubator-dolphinscheduler-website/pull/190#discussion_r503241561


##########
File path: docs/en-us/1.3.2/user_doc/system-manual.md
##########
@@ -0,0 +1,883 @@
+# System User Manual
+
+## Get started quickly
+
+> Please refer to [Quick Start](quick-start.html)
+
+## Operation guide
+
+### 1. Home
+
+The home page contains task status statistics, process status statistics, and workflow definition statistics for all projects of the user.
+
+<p align="center">
+<img src="/img/home_en.png" width="80%" />
+</p>
+
+### 2. Project management
+
+#### 2.1 Create project
+
+- Click "Project Management" to enter the project management page, click the "Create Project" button, enter the project name, project description, and click "Submit" to create a new project.
+
+  <p align="center">
+      <img src="/img/create_project_en1.png" width="80%" />
+  </p>
+
+#### 2.2 Project home
+
+- Click the project name link on the project management page to enter the project home page, as shown in the figure below, the project home page contains the task status statistics, process status statistics, and workflow definition statistics of the project.
+  <p align="center">
+     <img src="/img/project_home_en.png" width="80%" />
+  </p>
+
+- Task status statistics: within the specified time range, count the number of tasks in the task instance as successful submission, running, ready to pause, pause, ready to stop, stop, failure, success, fault tolerance, kill, and waiting threads
+- Process status statistics: within the specified time range, count the number of the status of the workflow instance as submission success, running, ready to pause, pause, ready to stop, stop, failure, success, fault tolerance, kill, and waiting threads
+- Workflow definition statistics: Count the workflow definitions created by users and the workflow definitions granted to this user by the administrator
+
+#### 2.3 Workflow definition
+
+#### <span id=creatDag>2.3.1 Create a workflow definition</span>
+
+- Click Project Management -> Workflow -> Workflow Definition to enter the workflow definition page, and click the "Create Workflow" button to enter the **workflow DAG edit** page, as shown in the following figure:
+  <p align="center">
+      <img src="/img/dag5.png" width="80%" />
+  </p>
+- Drag in the toolbar <img src="/img/shell.png" width="35"/> Add a Shell task to the drawing board, as shown in the figure below:
+  <p align="center">
+      <img src="/img/shell-en.png" width="80%" />
+  </p>
+- **Add parameter settings for shell tasks:**
+
+1. Fill in the "Node Name", "Description", and "Script" fields;
+2. Check “Normal” for “Run Flag”. If “Prohibit Execution” is checked, the task will not be executed when running the workflow;
+3. Select "Task Priority": When the number of worker threads is insufficient, high-level tasks will be executed first in the execution queue, and tasks with the same priority will be executed in the order of first in, first out;
+4. Timeout alarm (not required): Check the timeout alarm, timeout failure, and fill in the "timeout period". When the task execution time exceeds **timeout period**, an alert email will be sent and the task timeout fails;
+5. Resources (optional). Resource files are files created or uploaded on the Resource Center -> File Management page. For example, the file name is `test.sh`, and the command to call the resource in the script is `sh test.sh`;
+6. Custom parameters (not required), refer to [Custom Parameters](#UserDefinedParameters);
+7. Click the "Confirm Add" button to save the task settings.
+
+- **Increase the order of task execution:** Click the icon in the upper right corner <img src="/img/line.png" width="35"/> to connect the task; as shown in the figure below, task 2 and task 3 are executed in parallel, When task 1 is executed, tasks 2 and 3 will be executed simultaneously.
+
+  <p align="center">
+     <img src="/img/dag6.png" width="80%" />
+  </p>
+
+- **Delete dependencies:** Click the "arrow" icon in the upper right corner <img src="/img/arrow.png" width="35"/>, select the connection line, and click the "Delete" icon in the upper right corner <img src= "/img/delete.png" width="35"/>, delete dependencies between tasks.
+  <p align="center">
+     <img src="/img/dag7.png" width="80%" />
+  </p>
+
+- **Save workflow definition:** Click the "Save" button, and the "Set DAG chart name" pop-up box will pop up, as shown in the figure below. Enter the workflow definition name, workflow definition description, and set global parameters (optional, refer to [ Custom parameters](#UserDefinedParameters)), click the "Add" button, and the workflow definition is created successfully.
+  <p align="center">
+     <img src="/img/dag8.png" width="80%" />
+   </p>
+> For other types of tasks, please refer to [Task Node Type and Parameter Settings](#TaskParamers).
+
+#### 2.3.2 Workflow definition operation function
+
+Click Project Management -> Workflow -> Workflow Definition to enter the workflow definition page, as shown below:
+
+<p align="center">
+<img src="/img/work_list_en.png" width="80%" />
+</p>
+The operation functions of the workflow definition list are as follows:
+
+- **Edit:** Only "offline" workflow definitions can be edited. Workflow DAG editing is the same as [Create Workflow Definition](#creatDag).
+- **Online:** When the workflow status is "Offline", the workflow is online. Only the workflow in the "Online" state can run, but cannot be edited.
+- **Offline:** When the workflow status is "Online", the workflow is offline. Only the workflow in the "Offline" state can be edited, but not run.
+- **Run:** Only workflow in the online state can run. See [2.3.3 Run Workflow](#runWorkflow) for the operation steps
+- **Timing:** Timing can only be set in online workflows, and the system automatically schedules the workflow to run on a regular basis. The status after creating a timing is "offline", and the timing must be online on the timing management page to take effect. See [2.3.4 Workflow Timing](#creatTiming) for timing operation steps.
+- **Timing Management:** The timing management page can be edited, online/offline, and deleted.
+- **Delete:** Delete the workflow definition.
+- **Download:** Download workflow definition to local.
+- **Tree Diagram:** Display the task node type and task status in a tree structure, as shown in the figure below:
+  <p align="center">
+      <img src="/img/tree_en.png" width="80%" />
+  </p>
+
+#### <span id=runWorkflow>2.3.3 Run the workflow</span>
+
+- Click Project Management -> Workflow -> Workflow Definition to enter the workflow definition page, as shown in the figure below, click the "Go Online" button <img src="/img/online.png" width="35"/>,Go online workflow.
+  <p align="center">
+      <img src="/img/work_list_en.png" width="80%" />
+  </p>
+
+- Click the "Run" button to pop up the startup parameter setting pop-up box, as shown in the figure below, set the startup parameters, click the "Run" button in the pop-up box, the workflow starts running, and the workflow instance page generates a workflow instance.
+     <p align="center">
+       <img src="/img/run_work_en.png" width="80%" />
+     </p>
+  <span id=runParamers>Description of workflow operating parameters:</span>
+
+      * Failure strategy: When a task node fails to execute, other parallel task nodes need to execute the strategy. "Continue" means: after a certain task fails, other task nodes execute normally; "End" means: terminate all tasks being executed, and terminate the entire process.
+      * Notification strategy: When the process is over, the process execution information notification email is sent according to the process status, including any status is not sent, successful, failed, successful or failed.

Review comment:
       ```suggestion
         * Notification strategy: When the process is over, the process execution information notification email is sent according to the process status, including any status is not sent, successful sent, failed sent, successful or failed sent.
   ```


----------------------------------------------------------------
This is an automated message from the Apache Git Service.
To respond to the message, please log on to GitHub and use the
URL above to go to the specific comment.

For queries about this service, please contact Infrastructure at:
users@infra.apache.org
[GitHub] [incubator-dolphinscheduler-website] AhahaGe commented on a change in pull request #190: [Feature][Docs] Add English version of "system-manual" to the documentation
Posted by GitBox <gi...@apache.org>.
AhahaGe commented on a change in pull request #190:
URL: https://github.com/apache/incubator-dolphinscheduler-website/pull/190#discussion_r503230026


##########
File path: docs/en-us/1.3.2/user_doc/system-manual.md
##########
@@ -0,0 +1,883 @@
+# System User Manual
+
+## Get started quickly
+
+> Please refer to [Quick Start](quick-start.html)
+
+## Operation guide
+
+### 1. Home
+
+The home page contains task status statistics, process status statistics, and workflow definition statistics for all projects of the user.
+
+<p align="center">
+<img src="/img/home_en.png" width="80%" />
+</p>
+
+### 2. Project management
+
+#### 2.1 Create project
+
+- Click "Project Management" to enter the project management page, click the "Create Project" button, enter the project name, project description, and click "Submit" to create a new project.
+
+  <p align="center">
+      <img src="/img/create_project_en1.png" width="80%" />
+  </p>
+
+#### 2.2 Project home
+
+- Click the project name link on the project management page to enter the project home page, as shown in the figure below, the project home page contains the task status statistics, process status statistics, and workflow definition statistics of the project.
+  <p align="center">
+     <img src="/img/project_home_en.png" width="80%" />
+  </p>
+
+- Task status statistics: within the specified time range, count the number of tasks in the task instance as successful submission, running, ready to pause, pause, ready to stop, stop, failure, success, fault tolerance, kill, and waiting threads
+- Process status statistics: within the specified time range, count the number of the status of the workflow instance as submission success, running, ready to pause, pause, ready to stop, stop, failure, success, fault tolerance, kill, and waiting threads
+- Workflow definition statistics: Count the workflow definitions created by users and the workflow definitions granted to this user by the administrator
+
+#### 2.3 Workflow definition
+
+#### <span id=creatDag>2.3.1 Create a workflow definition</span>
+
+- Click Project Management -> Workflow -> Workflow Definition to enter the workflow definition page, and click the "Create Workflow" button to enter the **workflow DAG edit** page, as shown in the following figure:
+  <p align="center">
+      <img src="/img/dag5.png" width="80%" />
+  </p>
+- Drag in the toolbar <img src="/img/shell.png" width="35"/> Add a Shell task to the drawing board, as shown in the figure below:
+  <p align="center">
+      <img src="/img/shell-en.png" width="80%" />
+  </p>
+- **Add parameter settings for shell tasks:**

Review comment:
       for this shell task


----------------------------------------------------------------
This is an automated message from the Apache Git Service.
To respond to the message, please log on to GitHub and use the
URL above to go to the specific comment.

For queries about this service, please contact Infrastructure at:
users@infra.apache.org
[GitHub] [incubator-dolphinscheduler-website] AhahaGe commented on pull request #190: [Feature][Docs] Add English version of "system-manual" to the documentation
Posted by GitBox <gi...@apache.org>.
AhahaGe commented on pull request #190:
URL: https://github.com/apache/incubator-dolphinscheduler-website/pull/190#issuecomment-707686076


   @Segun-Ogundipe  If u think need not to edit, please feel free to comment out.


----------------------------------------------------------------
This is an automated message from the Apache Git Service.
To respond to the message, please log on to GitHub and use the
URL above to go to the specific comment.

For queries about this service, please contact Infrastructure at:
users@infra.apache.org
[GitHub] [incubator-dolphinscheduler-website] AhahaGe commented on a change in pull request #190: [Feature][Docs] Add English version of "system-manual" to the documentation
Posted by GitBox <gi...@apache.org>.
AhahaGe commented on a change in pull request #190:
URL: https://github.com/apache/incubator-dolphinscheduler-website/pull/190#discussion_r504594478
##########
File path: docs/en-us/1.3.2/user_doc/system-manual.md
##########
@@ -0,0 +1,886 @@
+# System User Manual
+
+## Get started quickly
+
+> Please refer to [Quick Start](quick-start.html)
+
+## Operation guide
+
+### 1. Home
+
+The home page contains task status statistics, process status statistics, and workflow definition statistics for all projects of the user.
+
+<p align="center">
+<img src="/img/home_en.png" width="80%" />
+</p>
+
+### 2. Project management
+
+#### 2.1 Create project
+
+- Click "Project Management" to enter the project management page, click the "Create Project" button, enter the project name, project description, and click "Submit" to create a new project.
+
+ <p align="center">
+ <img src="/img/create_project_en1.png" width="80%" />
+ </p>
+
+#### 2.2 Project home
+
+- Click the project name link on the project management page to enter the project home page, as shown in the figure below, the project home page contains the task status statistics, process status statistics, and workflow definition statistics of the project.
+ <p align="center">
+ <img src="/img/project_home_en.png" width="80%" />
+ </p>
+
+- Task status statistics: within the specified time range, count the number of task instances as successful submission, running, ready to pause, pause, ready to stop, stop, failure, success, fault tolerance, kill, and waiting threads
+- Process status statistics: within the specified time range, count the number of the status of the workflow instance as submission success, running, ready to pause, pause, ready to stop, stop, failure, success, fault tolerance, kill, and waiting threads
+- Workflow definition statistics: Count the workflow definitions created by this user and the workflow definitions granted to this user by the administrator
+
+#### 2.3 Workflow definition
+
+#### <span id=creatDag>2.3.1 Create workflow definition</span>
+
+- Click Project Management -> Workflow -> Workflow Definition to enter the workflow definition page, and click the "Create Workflow" button to enter the **workflow DAG edit** page, as shown in the following figure:
+ <p align="center">
+ <img src="/img/dag5.png" width="80%" />
+ </p>
+- Drag in the toolbar <img src="/img/shell.png" width="35"/> Add a Shell task to the drawing board, as shown in the figure below:
+ <p align="center">
+ <img src="/img/shell-en.png" width="80%" />
+ </p>
+- **Add parameter settings for this shell task:**
+
+1. Fill in the "Node Name", "Description", and "Script" fields;
+2. Check “Normal” for “Run Flag”. If “Prohibit Execution” is checked, the task will not be executed when the workflow runs;
+3. Select "Task Priority": When the number of worker threads is insufficient, high-level tasks will be executed first in the execution queue, and tasks with the same priority will be executed in the order of first in, first out;
+4. Timeout alarm (optional): Check the timeout alarm, timeout failure, and fill in the "timeout period". When the task execution time exceeds **timeout period**, an alert email will be sent and the task timeout fails;
+5. Resources (optional). Resource files are files created or uploaded on the Resource Center -> File Management page. For example, the file name is `test.sh`, and the command to call the resource in the script is `sh test.sh`;
+6. Custom parameters (optional), refer to [Custom Parameters](#UserDefinedParameters);
+7. Click the "Confirm Add" button to save the task settings.
+
+- **Increase the order of task execution:** Click the icon in the upper right corner <img src="/img/line.png" width="35"/> to connect the task; as shown in the figure below, task 2 and task 3 are executed in parallel, When task 1 finished execute, tasks 2 and 3 will be executed simultaneously.
+
+ <p align="center">
+ <img src="/img/dag6.png" width="80%" />
+ </p>
+
+- **Delete dependencies:** Click the "arrow" icon in the upper right corner <img src="/img/arrow.png" width="35"/>, select the connection line, and click the "Delete" icon in the upper right corner <img src= "/img/delete.png" width="35"/>, delete dependencies between tasks.
+ <p align="center">
+ <img src="/img/dag7.png" width="80%" />
+ </p>
+
+- **Save workflow definition:** Click the "Save" button, and the "Set DAG chart name" pop-up box will pop up, as shown in the figure below. Enter the workflow definition name, workflow definition description, and set global parameters (optional, refer to [ Custom parameters](#UserDefinedParameters)), click the "Add" button, and the workflow definition is created successfully.
+ <p align="center">
+ <img src="/img/dag8.png" width="80%" />
+ </p>
+> For other types of tasks, please refer to [Task Node Type and Parameter Settings](#TaskParamers).
+
+#### 2.3.2 Workflow definition operation function
+
+Click Project Management -> Workflow -> Workflow Definition to enter the workflow definition page, as shown below:
+
+<p align="center">
+<img src="/img/work_list_en.png" width="80%" />
+</p>
+The operation functions of the workflow definition list are as follows:
+
+- **Edit:** Only "offline" workflow definitions can be edited. Workflow DAG editing is the same as [Create Workflow Definition](#creatDag).
+- **Online:** When the workflow status is "Offline", used to online workflow. Only the workflow in the "Online" state can run, but cannot be edited.
+- **Offline:** When the workflow status is "Online", used to offline workflow. Only the workflow in the "Offline" state can be edited, but not run.
+- **Run:** Only workflow in the online state can run. See [2.3.3 Run Workflow](#runWorkflow) for the operation steps
+- **Timing:** Timing can only be set in online workflows, and the system automatically schedules the workflow to run on a regular basis. The status after creating a timing is "offline", and the timing must be online on the timing management page to take effect. See [2.3.4 Workflow Timing](#creatTiming) for timing operation steps.
+- **Timing Management:** The timing management page can be edited, online/offline, and deleted.
+- **Delete:** Delete the workflow definition.
+- **Download:** Download workflow definition to local.
+- **Tree Diagram:** Display the task node type and task status in a tree structure, as shown in the figure below:
+ <p align="center">
+ <img src="/img/tree_en.png" width="80%" />
+ </p>
+
+#### <span id=runWorkflow>2.3.3 Run the workflow</span>
+
+- Click Project Management -> Workflow -> Workflow Definition to enter the workflow definition page, as shown in the figure below, click the "Go Online" button <img src="/img/online.png" width="35"/>,Go online workflow.
+ <p align="center">
+ <img src="/img/work_list_en.png" width="80%" />
+ </p>
+
+- Click the "Run" button to pop up the startup parameter setting pop-up box, as shown in the figure below, set the startup parameters, click the "Run" button in the pop-up box, the workflow starts running, and the workflow instance page generates a workflow instance.
+ <p align="center">
+ <img src="/img/run_work_en.png" width="80%" />
+ </p>
+ <span id=runParamers>Description of workflow operating parameters:</span>
+
+ * Failure strategy: When a task node fails to execute, other parallel task nodes need to execute the strategy. "Continue" means: after a certain task fails, other task nodes execute normally; "End" means: terminate all tasks being executed, and terminate the entire process.
+ * Notification strategy: When the process is over, the process execution information notification email is sent according to the process status, including any status is not sent, successful sent, failed sent, successful or failed sent.
+ * Process priority: The priority of process operation, divided into five levels: highest (HIGHEST), high (HIGH), medium (MEDIUM), low (LOW), and lowest (LOWEST). When the number of master threads is insufficient, high-level processes will be executed first in the execution queue, and processes with the same priority will be executed in a first-in first-out order.
+ * Worker group: The process can only be executed in the specified worker machine group. The default is Default, which can be executed on any worker.
+ * Notification group: select notification strategy||timeout alarm||when fault tolerance occurs, process information or email will be sent to all members in the notification group.
+ * Recipient: Select notification policy||Timeout alarm||When fault tolerance occurs, process information or alarm email will be sent to the recipient list.
+ * Cc: Select the notification strategy||Timeout alarm||When fault tolerance occurs, the process information or warning email will be copied to the CC list.
+ * Complement: Two modes including serial complement and parallel complement. Serial complement: within the specified time range, the complement is executed sequentially from the start date to the end date, and only one process instance is generated; parallel complement: within the specified time range, multiple days are complemented at the same time to generate N process instances.
+ * For example, you need to fill in the data from May 1 to May 10.
+
+ <p align="center">
+ <img src="/img/complement_en1.png" width="80%" />
+ </p>
+
+ > Serial mode: The complement is executed sequentially from May 1 to May 10, and a process instance is generated on the process instance page;
+
+ > Parallel mode: The tasks from May 1 to may 10 are executed simultaneously, and 10 process instances are generated on the process instance page.
+
+#### <span id=creatTiming>2.3.4 Workflow timing</span>
+
+- Create timing: Click Project Management->Workflow->Workflow Definition, enter the workflow definition page, go online the workflow, click the "timing" button <img src="/img/timing.png" width="35"/> ,The timing parameter setting dialog box pops up, as shown in the figure below:
+ <p align="center">
+ <img src="/img/time_schedule_en.png" width="80%" />
+ </p>
+- Choose the start and end time. In the start and end time range, the workflow is run at regular intervals; not in the start and end time range, no more regular workflow instances are generated.
+- Add a timing that is executed once every day at 5 AM, as shown in the following figure:
+ <p align="center">
+ <img src="/img/timer-en.png" width="80%" />
+ </p>
+- Failure strategy, notification strategy, process priority, worker group, notification group, recipient, and CC are the same as [workflow running parameters](#runParamers).
+- Click the "Create" button to create the timing successfully. At this time, the timing status is "**Offline**" and the timing needs to be **Online** to take effect.
+- Timing online: Click the "timing management" button <img src="/img/timeManagement.png" width="35"/>, enter the timing management page, click the "online" button, the timing status will change to "online", as shown in the below figure, the workflow takes effect regularly.
+ <p align="center">
+ <img src="/img/time-manage-list-en.png" width="80%" />
+ </p>
+
+#### 2.3.5 Import workflow
+
+Click Project Management -> Workflow -> Workflow Definition to enter the workflow definition page, click the "Import Workflow" button to import the local workflow file, the workflow definition list displays the imported workflow, and the status is offline.
+
+#### 2.4 Workflow instance
+
+#### 2.4.1 View workflow instance
+
+- Click Project Management -> Workflow -> Workflow Instance to enter the Workflow Instance page, as shown in the figure below:
+ <p align="center">
+ <img src="/img/instance-list-en.png" width="80%" />
+ </p>
+- Click the workflow name to enter the DAG view page to view the task execution status, as shown in the figure below.
+ <p align="center">
+ <img src="/img/instance-runs-en.png" width="80%" />
+ </p>
+
+#### 2.4.2 View task log
+
+- Enter the workflow instance page, click the workflow name, enter the DAG view page, double-click the task node, as shown in the following figure:
+ <p align="center">
+ <img src="/img/instanceViewLog-en.png" width="80%" />
+ </p>
+- Click "View Log", a log pop-up box will pop up, as shown in the figure below, the task log can also be viewed on the task instance page, refer to [Task View Log](#taskLog)。
+ <p align="center">
+ <img src="/img/task-log-en.png" width="80%" />
+ </p>
+
+#### 2.4.3 View task history
+
+- Click Project Management -> Workflow -> Workflow Instance to enter the workflow instance page, and click the workflow name to enter the workflow DAG page;
+- Double-click the task node, as shown in the figure below, click "View History" to jump to the task instance page, and display a list of task instances running by the workflow instance
+ <p align="center">
+ <img src="/img/task_history_en.png" width="80%" />
+ </p>
+
+#### 2.4.4 View operating parameters
+
+- Click Project Management -> Workflow -> Workflow Instance to enter the workflow instance page, and click the workflow name to enter the workflow DAG page;
+- Click the icon in the upper left corner <img src="/img/run_params_button.png" width="35"/>,View the startup parameters of the workflow instance; click the icon <img src="/img/global_param.png" width="35"/>,View the global and local parameters of the workflow instance, as shown in the following figure:
+ <p align="center">
+ <img src="/img/run_params_en.png" width="80%" />
+ </p>
+
+#### 2.4.4 Workflow instance operation function
+
+Click Project Management -> Workflow -> Workflow Instance to enter the Workflow Instance page, as shown in the figure below:
+
+ <p align="center">
+ <img src="/img/instance-list-en.png" width="80%" />
+ </p>
+
+- **Edit:** Only terminated processes can be edited. Click the "Edit" button or the name of the workflow instance to enter the DAG edit page. After edit, click the "Save" button to pop up the Save DAG pop-up box, as shown in the figure below. In the pop-up box, check "Whether to update to workflow definition" and save After that, the workflow definition will be updated; if it is not checked, the workflow definition will not be updated.
+ <p align="center">
+ <img src="/img/editDag-en.png" width="80%" />
+ </p>
+- **Rerun:** Re-execute the terminated process.
+- **Recovery failed:** For failed processes, you can perform recovery operations, starting from the failed node.
+- **Stop:** To **stop** the running process, the background will first `kill`worker process, and then execute `kill -9` operation
+- **Pause:** Perform a **pause** operation on the running process, the system status will change to **waiting for execution**, it will wait for the end of the task being executed, and pause the next task to be executed.
+- **Resume pause:** To resume the paused process, start running directly from the **paused node**
+- **Delete:** Delete the workflow instance and the task instance under the workflow instance
+- **Gantt chart:** The vertical axis of the Gantt chart is the topological sorting of task instances under a certain workflow instance, and the horizontal axis is the running time of the task instances, as shown in the figure:
+ <p align="center">
+ <img src="/img/gantt-en.png" width="80%" />
+ </p>
+
+#### 2.5 Task instance
+
+- Click Project Management -> Workflow -> Task Instance to enter the task instance page, as shown in the figure below, click the name of the workflow instance, you can jump to the workflow instance DAG chart to view the task status.
+ <p align="center">
+ <img src="/img/task-list-en.png" width="80%" />
+ </p>
+
+- <span id=taskLog>View log:</span>Click the "view log" button in the operation column to view the log of task execution.
+ <p align="center">
+ <img src="/img/task-log2-en.png" width="80%" />
+ </p>
+
+### 3. Resource Center
+
+#### 3.1 hdfs resource configuration
+
+- Upload resource files and udf functions, all uploaded files and resources will be stored on hdfs, so the following configuration items are required:
+
+```
+
+conf/common/common.properties
+ # Users who have permission to create directories under the HDFS root path
+ hdfs.root.user=hdfs
+ # data base dir, resource file will store to this hadoop hdfs path, self configuration, please make sure the directory exists on hdfs and have read write permissions。"/escheduler" is recommended
+ data.store2hdfs.basepath=/dolphinscheduler
+ # resource upload startup type : HDFS,S3,NONE
+ res.upload.startup.type=HDFS
+ # whether kerberos starts
+ hadoop.security.authentication.startup.state=false
+ # java.security.krb5.conf path
+ java.security.krb5.conf.path=/opt/krb5.conf
+ # loginUserFromKeytab user
+ login.user.keytab.username=hdfs-mycluster@ESZ.COM
+ # loginUserFromKeytab path
+ login.user.keytab.path=/opt/hdfs.headless.keytab
+
+conf/common/hadoop.properties
+ # ha or single namenode,If namenode ha needs to copy core-site.xml and hdfs-site.xml
+ # to the conf directory,support s3,for example : s3a://dolphinscheduler
+ fs.defaultFS=hdfs://mycluster:8020
+ #resourcemanager ha note this need ips , this empty if single
+ yarn.resourcemanager.ha.rm.ids=192.168.xx.xx,192.168.xx.xx
+ # If it is a single resourcemanager, you only need to configure one host name. If it is resourcemanager HA, the default configuration is fine
+ yarn.application.status.address=http://xxxx:8088/ws/v1/cluster/apps/%s
+
+```
+
+- Only one address needs to be configured for yarn.resourcemanager.ha.rm.ids and yarn.application.status.address, and the other address is empty.
+- You need to copy core-site.xml and hdfs-site.xml from the conf directory of the Hadoop cluster to the conf directory of the dolphinscheduler project, and restart the api-server service.
+
+#### 3.2 File management
+
+> It is the management of various resource files, including creating basic txt/log/sh/conf/py/java and other files, uploading jar packages and other types of files, and can do edit, rename, download, delete and other operations.
+
+ <p align="center">
+ <img src="/img/file-manage-en.png" width="80%" />
+ </p>
+
+- Create a file
+ > The file format supports the following types: txt, log, sh, conf, cfg, py, java, sql, xml, hql, properties
+
+<p align="center">
+ <img src="/img/file_create_en.png" width="80%" />
+ </p>
+
+- upload files
+
+> Upload file: Click the "Upload File" button to upload, drag the file to the upload area, the file name will be automatically completed with the uploaded file name
+
+<p align="center">
+ <img src="/img/file-upload-en.png" width="80%" />
+ </p>
+
+- File View
+
+> For the file types that can be viewed, click the file name to view the file details
+
+<p align="center">
+ <img src="/img/file_detail_en.png" width="80%" />
+ </p>
+
+- download file
+
+> Click the "Download" button in the file list to download the file or click the "Download" button in the upper right corner of the file details to download the file
+
+- File rename
+
+<p align="center">
+ <img src="/img/file_rename_en.png" width="80%" />
+ </p>
+
+- delete
+ > File list -> Click the "Delete" button to delete the specified file
+
+#### 3.3 UDF management
+
+#### 3.3.1 Resource management
+
+> The resource management and file management functions are similar. The difference is that the resource management is the uploaded UDF function, and the file management uploads the user program, script and configuration file.
+> Operation function: rename, download, delete.
+
+- Upload udf resources
+ > Same as uploading files.
+
+#### 3.3.2 Function management
+
+- Create UDF function
+ > Click "Create UDF Function", enter the udf function parameters, select the udf resource, and click "Submit" to create the udf function.
+
+> Currently only supports temporary UDF functions of HIVE
+
+- UDF function name: the name when the UDF function is entered
+- Package name Class name: Enter the full path of the UDF function
+- UDF resource: Set the resource file corresponding to the created UDF
+
+<p align="center">
+ <img src="/img/udf_edit_en.png" width="80%" />
+ </p>
+
+### 4. Create data source
+
+> Data source center supports MySQL, POSTGRESQL, HIVE/IMPALA, SPARK, CLICKHOUSE, ORACLE, SQLSERVER and other data sources
+
+#### 4.1 Create/Edit MySQL data source
+
+- Click "Data Source Center -> Create Data Source" to create different types of data sources according to requirements.
+
+- Data source: select MYSQL
+- Data source name: enter the name of the data source
+- Description: Enter a description of the data source
+- IP hostname: enter the IP to connect to MySQL
+- Port: Enter the port to connect to MySQL
+- Username: Set the username for connecting to MySQL
+- Password: Set the password for connecting to MySQL
+- Database name: Enter the name of the database connected to MySQL
+- Jdbc connection parameters: parameter settings for MySQL connection, filled in in JSON form
+
+<p align="center">
+ <img src="/img/mysql-en.png" width="80%" />
+ </p>
+
+> Click "Test Connection" to test whether the data source can be successfully connected.
+
+#### 4.2 Create/Edit POSTGRESQL data source
+
+- Data source: select POSTGRESQL
+- Data source name: enter the name of the data source
+- Description: Enter a description of the data source
+- IP/Host Name: Enter the IP to connect to POSTGRESQL
+- Port: Enter the port to connect to POSTGRESQL
+- Username: Set the username for connecting to POSTGRESQL
+- Password: Set the password for connecting to POSTGRESQL
+- Database name: Enter the name of the database connected to POSTGRESQL
+- Jdbc connection parameters: parameter settings for POSTGRESQL connection, filled in in JSON form
+
+<p align="center">
+ <img src="/img/postgresql-en.png" width="80%" />
+ </p>
+
+#### 4.3 Create/Edit HIVE data source
+
+1.Use HiveServer2 to connect
+
+ <p align="center">
+ <img src="/img/hive-en.png" width="80%" />
+ </p>
+
+- Data source: select HIVE
+- Data source name: enter the name of the data source
+- Description: Enter a description of the data source
+- IP/Host Name: Enter the IP connected to HIVE
+- Port: Enter the port connected to HIVE
+- Username: Set the username for connecting to HIVE
+- Password: Set the password for connecting to HIVE
+- Database name: Enter the name of the database connected to HIVE
+- Jdbc connection parameters: parameter settings for HIVE connection, filled in in JSON form
+
+ 2.Use HiveServer2 HA Zookeeper to connect
+
+ <p align="center">
+ <img src="/img/hive1-en.png" width="80%" />
+ </p>
+
+Note: If you enable **kerberos**, you need to fill in **Principal**
+
+<p align="center">
+ <img src="/img/hive-en.png" width="80%" />
+ </p>
+
+#### 4.4 Create/Edit Spark data source
+
+<p align="center">
+ <img src="/img/spark-en.png" width="80%" />
+ </p>
+
+- Data source: select Spark
+- Data source name: enter the name of the data source
+- Description: Enter a description of the data source
+- IP/Hostname: Enter the IP connected to Spark
+- Port: Enter the port connected to Spark
+- Username: Set the username for connecting to Spark
+- Password: Set the password for connecting to Spark
+- Database name: Enter the name of the database connected to Spark
+- Jdbc connection parameters: parameter settings for Spark connection, filled in in JSON form
+
+### 5. Security Center (Permission System)
+
+ * Only the administrator account in the security center has the authority to operate. It has functions such as queue management, tenant management, user management, alarm group management, worker group management, token management, etc. In the user management module, resources, data sources, projects, etc. Authorization
+ * Administrator login, default user name and password: admin/dolphinscheduler123
+
+#### 5.1 Create queue
+
+- Queue is used when the "queue" parameter is needed to execute programs such as spark and mapreduce.
+- The administrator enters the Security Center->Queue Management page and clicks the "Create Queue" button to create a queue.
+<p align="center">
+ <img src="/img/create-queue-en.png" width="80%" />
+ </p>
+
+#### 5.2 Add tenant
+
+- The tenant corresponds to the Linux user, which is used by the worker to submit the job. If Linux does not have this user, the worker will create this user when executing the script.
+- Tenant Code: **Tenant Code is the only user on Linux and cannot be repeated**
+- The administrator enters the Security Center->Tenant Management page and clicks the "Create Tenant" button to create a tenant.
+
+ <p align="center">
+ <img src="/img/addtenant-en.png" width="80%" />
+ </p>
+
+#### 5.3 Create normal user
+
+- Users are divided into **administrator users** and **normal users**
+
+ - The administrator has authorization and user management authority, but does not have the authority to create project and workflow definition operations.
+ - Ordinary users can create projects and create, edit, and execute workflow definitions.
+ - Note: If the user switches tenants, all resources under the tenant where the user belongs will be copied to the new tenant that is switched.
Review comment:
```suggestion
- Note: If the user switches tenants, all resources under the tenant where the user belongs to will be copied to the new tenant that is switched.
```
##########
File path: docs/en-us/1.3.2/user_doc/system-manual.md
##########
@@ -0,0 +1,886 @@
+# System User Manual
+
+## Get started quickly
+
+> Please refer to [Quick Start](quick-start.html)
+
+## Operation guide
+
+### 1. Home
+
+The home page contains task status statistics, process status statistics, and workflow definition statistics for all projects of the user.
+
+<p align="center">
+<img src="/img/home_en.png" width="80%" />
+</p>
+
+### 2. Project management
+
+#### 2.1 Create project
+
+- Click "Project Management" to enter the project management page, click the "Create Project" button, enter the project name, project description, and click "Submit" to create a new project.
+
+ <p align="center">
+ <img src="/img/create_project_en1.png" width="80%" />
+ </p>
+
+#### 2.2 Project home
+
+- Click the project name link on the project management page to enter the project home page, as shown in the figure below, the project home page contains the task status statistics, process status statistics, and workflow definition statistics of the project.
+ <p align="center">
+ <img src="/img/project_home_en.png" width="80%" />
+ </p>
+
+- Task status statistics: within the specified time range, count the number of task instances as successful submission, running, ready to pause, pause, ready to stop, stop, failure, success, fault tolerance, kill, and waiting threads
+- Process status statistics: within the specified time range, count the number of the status of the workflow instance as submission success, running, ready to pause, pause, ready to stop, stop, failure, success, fault tolerance, kill, and waiting threads
+- Workflow definition statistics: Count the workflow definitions created by this user and the workflow definitions granted to this user by the administrator
+
+#### 2.3 Workflow definition
+
+#### <span id=creatDag>2.3.1 Create workflow definition</span>
+
+- Click Project Management -> Workflow -> Workflow Definition to enter the workflow definition page, and click the "Create Workflow" button to enter the **workflow DAG edit** page, as shown in the following figure:
+ <p align="center">
+ <img src="/img/dag5.png" width="80%" />
+ </p>
+- Drag in the toolbar <img src="/img/shell.png" width="35"/> Add a Shell task to the drawing board, as shown in the figure below:
+ <p align="center">
+ <img src="/img/shell-en.png" width="80%" />
+ </p>
+- **Add parameter settings for this shell task:**
+
+1. Fill in the "Node Name", "Description", and "Script" fields;
+2. Check “Normal” for “Run Flag”. If “Prohibit Execution” is checked, the task will not be executed when the workflow runs;
+3. Select "Task Priority": When the number of worker threads is insufficient, high-level tasks will be executed first in the execution queue, and tasks with the same priority will be executed in the order of first in, first out;
+4. Timeout alarm (optional): Check the timeout alarm, timeout failure, and fill in the "timeout period". When the task execution time exceeds **timeout period**, an alert email will be sent and the task timeout fails;
+5. Resources (optional). Resource files are files created or uploaded on the Resource Center -> File Management page. For example, the file name is `test.sh`, and the command to call the resource in the script is `sh test.sh`;
+6. Custom parameters (optional), refer to [Custom Parameters](#UserDefinedParameters);
+7. Click the "Confirm Add" button to save the task settings.
+
+- **Increase the order of task execution:** Click the icon in the upper right corner <img src="/img/line.png" width="35"/> to connect the task; as shown in the figure below, task 2 and task 3 are executed in parallel, When task 1 finished execute, tasks 2 and 3 will be executed simultaneously.
+
+ <p align="center">
+ <img src="/img/dag6.png" width="80%" />
+ </p>
+
+- **Delete dependencies:** Click the "arrow" icon in the upper right corner <img src="/img/arrow.png" width="35"/>, select the connection line, and click the "Delete" icon in the upper right corner <img src= "/img/delete.png" width="35"/>, delete dependencies between tasks.
+ <p align="center">
+ <img src="/img/dag7.png" width="80%" />
+ </p>
+
+- **Save workflow definition:** Click the "Save" button, and the "Set DAG chart name" pop-up box will pop up, as shown in the figure below. Enter the workflow definition name, workflow definition description, and set global parameters (optional, refer to [ Custom parameters](#UserDefinedParameters)), click the "Add" button, and the workflow definition is created successfully.
+ <p align="center">
+ <img src="/img/dag8.png" width="80%" />
+ </p>
+> For other types of tasks, please refer to [Task Node Type and Parameter Settings](#TaskParamers).
+
+#### 2.3.2 Workflow definition operation function
+
+Click Project Management -> Workflow -> Workflow Definition to enter the workflow definition page, as shown below:
+
+<p align="center">
+<img src="/img/work_list_en.png" width="80%" />
+</p>
+The operation functions of the workflow definition list are as follows:
+
+- **Edit:** Only "offline" workflow definitions can be edited. Workflow DAG editing is the same as [Create Workflow Definition](#creatDag).
+- **Online:** When the workflow status is "Offline", used to online workflow. Only the workflow in the "Online" state can run, but cannot be edited.
+- **Offline:** When the workflow status is "Online", used to offline workflow. Only the workflow in the "Offline" state can be edited, but not run.
+- **Run:** Only workflow in the online state can run. See [2.3.3 Run Workflow](#runWorkflow) for the operation steps
+- **Timing:** Timing can only be set in online workflows, and the system automatically schedules the workflow to run on a regular basis. The status after creating a timing is "offline", and the timing must be online on the timing management page to take effect. See [2.3.4 Workflow Timing](#creatTiming) for timing operation steps.
+- **Timing Management:** The timing management page can be edited, online/offline, and deleted.
+- **Delete:** Delete the workflow definition.
+- **Download:** Download workflow definition to local.
+- **Tree Diagram:** Display the task node type and task status in a tree structure, as shown in the figure below:
+ <p align="center">
+ <img src="/img/tree_en.png" width="80%" />
+ </p>
+
+#### <span id=runWorkflow>2.3.3 Run the workflow</span>
+
+- Click Project Management -> Workflow -> Workflow Definition to enter the workflow definition page, as shown in the figure below, click the "Go Online" button <img src="/img/online.png" width="35"/>,Go online workflow.
+ <p align="center">
+ <img src="/img/work_list_en.png" width="80%" />
+ </p>
+
+- Click the "Run" button to pop up the startup parameter setting pop-up box, as shown in the figure below, set the startup parameters, click the "Run" button in the pop-up box, the workflow starts running, and the workflow instance page generates a workflow instance.
+ <p align="center">
+ <img src="/img/run_work_en.png" width="80%" />
+ </p>
+ <span id=runParamers>Description of workflow operating parameters:</span>
+
+ * Failure strategy: When a task node fails to execute, other parallel task nodes need to execute the strategy. "Continue" means: after a certain task fails, other task nodes execute normally; "End" means: terminate all tasks being executed, and terminate the entire process.
+ * Notification strategy: When the process is over, the process execution information notification email is sent according to the process status, including any status is not sent, successful sent, failed sent, successful or failed sent.
+ * Process priority: The priority of process operation, divided into five levels: highest (HIGHEST), high (HIGH), medium (MEDIUM), low (LOW), and lowest (LOWEST). When the number of master threads is insufficient, high-level processes will be executed first in the execution queue, and processes with the same priority will be executed in a first-in first-out order.
+ * Worker group: The process can only be executed in the specified worker machine group. The default is Default, which can be executed on any worker.
+ * Notification group: select notification strategy||timeout alarm||when fault tolerance occurs, process information or email will be sent to all members in the notification group.
+ * Recipient: Select notification policy||Timeout alarm||When fault tolerance occurs, process information or alarm email will be sent to the recipient list.
+ * Cc: Select the notification strategy||Timeout alarm||When fault tolerance occurs, the process information or warning email will be copied to the CC list.
+ * Complement: Two modes including serial complement and parallel complement. Serial complement: within the specified time range, the complement is executed sequentially from the start date to the end date, and only one process instance is generated; parallel complement: within the specified time range, multiple days are complemented at the same time to generate N process instances.
+ * For example, you need to fill in the data from May 1 to May 10.
+
+ <p align="center">
+ <img src="/img/complement_en1.png" width="80%" />
+ </p>
+
+ > Serial mode: The complement is executed sequentially from May 1 to May 10, and a process instance is generated on the process instance page;
+
+ > Parallel mode: The tasks from May 1 to may 10 are executed simultaneously, and 10 process instances are generated on the process instance page.
+
+#### <span id=creatTiming>2.3.4 Workflow timing</span>
+
+- Create timing: Click Project Management->Workflow->Workflow Definition, enter the workflow definition page, go online the workflow, click the "timing" button <img src="/img/timing.png" width="35"/> ,The timing parameter setting dialog box pops up, as shown in the figure below:
+ <p align="center">
+ <img src="/img/time_schedule_en.png" width="80%" />
+ </p>
+- Choose the start and end time. In the start and end time range, the workflow is run at regular intervals; not in the start and end time range, no more regular workflow instances are generated.
+- Add a timing that is executed once every day at 5 AM, as shown in the following figure:
+ <p align="center">
+ <img src="/img/timer-en.png" width="80%" />
+ </p>
+- Failure strategy, notification strategy, process priority, worker group, notification group, recipient, and CC are the same as [workflow running parameters](#runParamers).
+- Click the "Create" button to create the timing successfully. At this time, the timing status is "**Offline**" and the timing needs to be **Online** to take effect.
+- Timing online: Click the "timing management" button <img src="/img/timeManagement.png" width="35"/>, enter the timing management page, click the "online" button, the timing status will change to "online", as shown in the below figure, the workflow takes effect regularly.
+ <p align="center">
+ <img src="/img/time-manage-list-en.png" width="80%" />
+ </p>
+
+#### 2.3.5 Import workflow
+
+Click Project Management -> Workflow -> Workflow Definition to enter the workflow definition page, click the "Import Workflow" button to import the local workflow file, the workflow definition list displays the imported workflow, and the status is offline.
+
+#### 2.4 Workflow instance
+
+#### 2.4.1 View workflow instance
+
+- Click Project Management -> Workflow -> Workflow Instance to enter the Workflow Instance page, as shown in the figure below:
+ <p align="center">
+ <img src="/img/instance-list-en.png" width="80%" />
+ </p>
+- Click the workflow name to enter the DAG view page to view the task execution status, as shown in the figure below.
+ <p align="center">
+ <img src="/img/instance-runs-en.png" width="80%" />
+ </p>
+
+#### 2.4.2 View task log
+
+- Enter the workflow instance page, click the workflow name, enter the DAG view page, double-click the task node, as shown in the following figure:
+ <p align="center">
+ <img src="/img/instanceViewLog-en.png" width="80%" />
+ </p>
+- Click "View Log", a log pop-up box will pop up, as shown in the figure below, the task log can also be viewed on the task instance page, refer to [Task View Log](#taskLog)。
+ <p align="center">
+ <img src="/img/task-log-en.png" width="80%" />
+ </p>
+
+#### 2.4.3 View task history
+
+- Click Project Management -> Workflow -> Workflow Instance to enter the workflow instance page, and click the workflow name to enter the workflow DAG page;
+- Double-click the task node, as shown in the figure below, click "View History" to jump to the task instance page, and display a list of task instances running by the workflow instance
+ <p align="center">
+ <img src="/img/task_history_en.png" width="80%" />
+ </p>
+
+#### 2.4.4 View operating parameters
+
+- Click Project Management -> Workflow -> Workflow Instance to enter the workflow instance page, and click the workflow name to enter the workflow DAG page;
+- Click the icon in the upper left corner <img src="/img/run_params_button.png" width="35"/>,View the startup parameters of the workflow instance; click the icon <img src="/img/global_param.png" width="35"/>,View the global and local parameters of the workflow instance, as shown in the following figure:
+ <p align="center">
+ <img src="/img/run_params_en.png" width="80%" />
+ </p>
+
+#### 2.4.4 Workflow instance operation function
+
+Click Project Management -> Workflow -> Workflow Instance to enter the Workflow Instance page, as shown in the figure below:
+
+ <p align="center">
+ <img src="/img/instance-list-en.png" width="80%" />
+ </p>
+
+- **Edit:** Only terminated processes can be edited. Click the "Edit" button or the name of the workflow instance to enter the DAG edit page. After edit, click the "Save" button to pop up the Save DAG pop-up box, as shown in the figure below. In the pop-up box, check "Whether to update to workflow definition" and save After that, the workflow definition will be updated; if it is not checked, the workflow definition will not be updated.
+ <p align="center">
+ <img src="/img/editDag-en.png" width="80%" />
+ </p>
+- **Rerun:** Re-execute the terminated process.
+- **Recovery failed:** For failed processes, you can perform recovery operations, starting from the failed node.
+- **Stop:** To **stop** the running process, the background will first `kill`worker process, and then execute `kill -9` operation
+- **Pause:** Perform a **pause** operation on the running process, the system status will change to **waiting for execution**, it will wait for the end of the task being executed, and pause the next task to be executed.
+- **Resume pause:** To resume the paused process, start running directly from the **paused node**
+- **Delete:** Delete the workflow instance and the task instance under the workflow instance
+- **Gantt chart:** The vertical axis of the Gantt chart is the topological sorting of task instances under a certain workflow instance, and the horizontal axis is the running time of the task instances, as shown in the figure:
+ <p align="center">
+ <img src="/img/gantt-en.png" width="80%" />
+ </p>
+
+#### 2.5 Task instance
+
+- Click Project Management -> Workflow -> Task Instance to enter the task instance page, as shown in the figure below, click the name of the workflow instance, you can jump to the workflow instance DAG chart to view the task status.
+ <p align="center">
+ <img src="/img/task-list-en.png" width="80%" />
+ </p>
+
+- <span id=taskLog>View log:</span>Click the "view log" button in the operation column to view the log of task execution.
+ <p align="center">
+ <img src="/img/task-log2-en.png" width="80%" />
+ </p>
+
+### 3. Resource Center
+
+#### 3.1 hdfs resource configuration
+
+- Upload resource files and udf functions, all uploaded files and resources will be stored on hdfs, so the following configuration items are required:
+
+```
+
+conf/common/common.properties
+ # Users who have permission to create directories under the HDFS root path
+ hdfs.root.user=hdfs
+ # data base dir, resource file will store to this hadoop hdfs path, self configuration, please make sure the directory exists on hdfs and have read write permissions。"/escheduler" is recommended
+ data.store2hdfs.basepath=/dolphinscheduler
+ # resource upload startup type : HDFS,S3,NONE
+ res.upload.startup.type=HDFS
+ # whether kerberos starts
+ hadoop.security.authentication.startup.state=false
+ # java.security.krb5.conf path
+ java.security.krb5.conf.path=/opt/krb5.conf
+ # loginUserFromKeytab user
+ login.user.keytab.username=hdfs-mycluster@ESZ.COM
+ # loginUserFromKeytab path
+ login.user.keytab.path=/opt/hdfs.headless.keytab
+
+conf/common/hadoop.properties
+ # ha or single namenode,If namenode ha needs to copy core-site.xml and hdfs-site.xml
+ # to the conf directory,support s3,for example : s3a://dolphinscheduler
+ fs.defaultFS=hdfs://mycluster:8020
+ #resourcemanager ha note this need ips , this empty if single
+ yarn.resourcemanager.ha.rm.ids=192.168.xx.xx,192.168.xx.xx
+ # If it is a single resourcemanager, you only need to configure one host name. If it is resourcemanager HA, the default configuration is fine
+ yarn.application.status.address=http://xxxx:8088/ws/v1/cluster/apps/%s
+
+```
+
+- Only one address needs to be configured for yarn.resourcemanager.ha.rm.ids and yarn.application.status.address, and the other address is empty.
+- You need to copy core-site.xml and hdfs-site.xml from the conf directory of the Hadoop cluster to the conf directory of the dolphinscheduler project, and restart the api-server service.
+
+#### 3.2 File management
+
+> It is the management of various resource files, including creating basic txt/log/sh/conf/py/java and other files, uploading jar packages and other types of files, and can do edit, rename, download, delete and other operations.
+
+ <p align="center">
+ <img src="/img/file-manage-en.png" width="80%" />
+ </p>
+
+- Create a file
+ > The file format supports the following types: txt, log, sh, conf, cfg, py, java, sql, xml, hql, properties
+
+<p align="center">
+ <img src="/img/file_create_en.png" width="80%" />
+ </p>
+
+- upload files
+
+> Upload file: Click the "Upload File" button to upload, drag the file to the upload area, the file name will be automatically completed with the uploaded file name
+
+<p align="center">
+ <img src="/img/file-upload-en.png" width="80%" />
+ </p>
+
+- File View
+
+> For the file types that can be viewed, click the file name to view the file details
+
+<p align="center">
+ <img src="/img/file_detail_en.png" width="80%" />
+ </p>
+
+- download file
+
+> Click the "Download" button in the file list to download the file or click the "Download" button in the upper right corner of the file details to download the file
+
+- File rename
+
+<p align="center">
+ <img src="/img/file_rename_en.png" width="80%" />
+ </p>
+
+- delete
+ > File list -> Click the "Delete" button to delete the specified file
+
+#### 3.3 UDF management
+
+#### 3.3.1 Resource management
+
+> The resource management and file management functions are similar. The difference is that the resource management is the uploaded UDF function, and the file management uploads the user program, script and configuration file.
+> Operation function: rename, download, delete.
+
+- Upload udf resources
+ > Same as uploading files.
+
+#### 3.3.2 Function management
+
+- Create UDF function
+ > Click "Create UDF Function", enter the udf function parameters, select the udf resource, and click "Submit" to create the udf function.
+
+> Currently only supports temporary UDF functions of HIVE
+
+- UDF function name: the name when the UDF function is entered
+- Package name Class name: Enter the full path of the UDF function
+- UDF resource: Set the resource file corresponding to the created UDF
+
+<p align="center">
+ <img src="/img/udf_edit_en.png" width="80%" />
+ </p>
+
+### 4. Create data source
+
+> Data source center supports MySQL, POSTGRESQL, HIVE/IMPALA, SPARK, CLICKHOUSE, ORACLE, SQLSERVER and other data sources
+
+#### 4.1 Create/Edit MySQL data source
+
+- Click "Data Source Center -> Create Data Source" to create different types of data sources according to requirements.
+
+- Data source: select MYSQL
+- Data source name: enter the name of the data source
+- Description: Enter a description of the data source
+- IP hostname: enter the IP to connect to MySQL
+- Port: Enter the port to connect to MySQL
+- Username: Set the username for connecting to MySQL
+- Password: Set the password for connecting to MySQL
+- Database name: Enter the name of the database connected to MySQL
+- Jdbc connection parameters: parameter settings for MySQL connection, filled in in JSON form
+
+<p align="center">
+ <img src="/img/mysql-en.png" width="80%" />
+ </p>
+
+> Click "Test Connection" to test whether the data source can be successfully connected.
+
+#### 4.2 Create/Edit POSTGRESQL data source
+
+- Data source: select POSTGRESQL
+- Data source name: enter the name of the data source
+- Description: Enter a description of the data source
+- IP/Host Name: Enter the IP to connect to POSTGRESQL
+- Port: Enter the port to connect to POSTGRESQL
+- Username: Set the username for connecting to POSTGRESQL
+- Password: Set the password for connecting to POSTGRESQL
+- Database name: Enter the name of the database connected to POSTGRESQL
+- Jdbc connection parameters: parameter settings for POSTGRESQL connection, filled in in JSON form
+
+<p align="center">
+ <img src="/img/postgresql-en.png" width="80%" />
+ </p>
+
+#### 4.3 Create/Edit HIVE data source
+
+1.Use HiveServer2 to connect
+
+ <p align="center">
+ <img src="/img/hive-en.png" width="80%" />
+ </p>
+
+- Data source: select HIVE
+- Data source name: enter the name of the data source
+- Description: Enter a description of the data source
+- IP/Host Name: Enter the IP connected to HIVE
+- Port: Enter the port connected to HIVE
+- Username: Set the username for connecting to HIVE
+- Password: Set the password for connecting to HIVE
+- Database name: Enter the name of the database connected to HIVE
+- Jdbc connection parameters: parameter settings for HIVE connection, filled in in JSON form
+
+ 2.Use HiveServer2 HA Zookeeper to connect
+
+ <p align="center">
+ <img src="/img/hive1-en.png" width="80%" />
+ </p>
+
+Note: If you enable **kerberos**, you need to fill in **Principal**
+
+<p align="center">
+ <img src="/img/hive-en.png" width="80%" />
+ </p>
+
+#### 4.4 Create/Edit Spark data source
+
+<p align="center">
+ <img src="/img/spark-en.png" width="80%" />
+ </p>
+
+- Data source: select Spark
+- Data source name: enter the name of the data source
+- Description: Enter a description of the data source
+- IP/Hostname: Enter the IP connected to Spark
+- Port: Enter the port connected to Spark
+- Username: Set the username for connecting to Spark
+- Password: Set the password for connecting to Spark
+- Database name: Enter the name of the database connected to Spark
+- Jdbc connection parameters: parameter settings for Spark connection, filled in in JSON form
+
+### 5. Security Center (Permission System)
+
+ * Only the administrator account in the security center has the authority to operate. It has functions such as queue management, tenant management, user management, alarm group management, worker group management, token management, etc. In the user management module, resources, data sources, projects, etc. Authorization
+ * Administrator login, default user name and password: admin/dolphinscheduler123
+
+#### 5.1 Create queue
+
+- Queue is used when the "queue" parameter is needed to execute programs such as spark and mapreduce.
+- The administrator enters the Security Center->Queue Management page and clicks the "Create Queue" button to create a queue.
+<p align="center">
+ <img src="/img/create-queue-en.png" width="80%" />
+ </p>
+
+#### 5.2 Add tenant
+
+- The tenant corresponds to the Linux user, which is used by the worker to submit the job. If Linux does not have this user, the worker will create this user when executing the script.
+- Tenant Code: **Tenant Code is the only user on Linux and cannot be repeated**
+- The administrator enters the Security Center->Tenant Management page and clicks the "Create Tenant" button to create a tenant.
+
+ <p align="center">
+ <img src="/img/addtenant-en.png" width="80%" />
+ </p>
+
+#### 5.3 Create normal user
+
+- Users are divided into **administrator users** and **normal users**
+
+ - The administrator has authorization and user management authority, but does not have the authority to create project and workflow definition operations.
Review comment:
```suggestion
- The administrator has authorization and user management authority, but does not have the authority to create project and workflow definition.
```
##########
File path: docs/en-us/1.3.2/user_doc/system-manual.md
##########
@@ -0,0 +1,886 @@
+# System User Manual
+
+## Get started quickly
+
+> Please refer to [Quick Start](quick-start.html)
+
+## Operation guide
+
+### 1. Home
+
+The home page contains task status statistics, process status statistics, and workflow definition statistics for all projects of the user.
+
+<p align="center">
+<img src="/img/home_en.png" width="80%" />
+</p>
+
+### 2. Project management
+
+#### 2.1 Create project
+
+- Click "Project Management" to enter the project management page, click the "Create Project" button, enter the project name, project description, and click "Submit" to create a new project.
+
+ <p align="center">
+ <img src="/img/create_project_en1.png" width="80%" />
+ </p>
+
+#### 2.2 Project home
+
+- Click the project name link on the project management page to enter the project home page, as shown in the figure below, the project home page contains the task status statistics, process status statistics, and workflow definition statistics of the project.
+ <p align="center">
+ <img src="/img/project_home_en.png" width="80%" />
+ </p>
+
+- Task status statistics: within the specified time range, count the number of task instances as successful submission, running, ready to pause, pause, ready to stop, stop, failure, success, fault tolerance, kill, and waiting threads
+- Process status statistics: within the specified time range, count the number of the status of the workflow instance as submission success, running, ready to pause, pause, ready to stop, stop, failure, success, fault tolerance, kill, and waiting threads
+- Workflow definition statistics: Count the workflow definitions created by this user and the workflow definitions granted to this user by the administrator
+
+#### 2.3 Workflow definition
+
+#### <span id=creatDag>2.3.1 Create workflow definition</span>
+
+- Click Project Management -> Workflow -> Workflow Definition to enter the workflow definition page, and click the "Create Workflow" button to enter the **workflow DAG edit** page, as shown in the following figure:
+ <p align="center">
+ <img src="/img/dag5.png" width="80%" />
+ </p>
+- Drag in the toolbar <img src="/img/shell.png" width="35"/> Add a Shell task to the drawing board, as shown in the figure below:
+ <p align="center">
+ <img src="/img/shell-en.png" width="80%" />
+ </p>
+- **Add parameter settings for this shell task:**
+
+1. Fill in the "Node Name", "Description", and "Script" fields;
+2. Check “Normal” for “Run Flag”. If “Prohibit Execution” is checked, the task will not be executed when the workflow runs;
+3. Select "Task Priority": When the number of worker threads is insufficient, high-level tasks will be executed first in the execution queue, and tasks with the same priority will be executed in the order of first in, first out;
+4. Timeout alarm (optional): Check the timeout alarm, timeout failure, and fill in the "timeout period". When the task execution time exceeds **timeout period**, an alert email will be sent and the task timeout fails;
+5. Resources (optional). Resource files are files created or uploaded on the Resource Center -> File Management page. For example, the file name is `test.sh`, and the command to call the resource in the script is `sh test.sh`;
+6. Custom parameters (optional), refer to [Custom Parameters](#UserDefinedParameters);
+7. Click the "Confirm Add" button to save the task settings.
+
+- **Increase the order of task execution:** Click the icon in the upper right corner <img src="/img/line.png" width="35"/> to connect the task; as shown in the figure below, task 2 and task 3 are executed in parallel, When task 1 finished execute, tasks 2 and 3 will be executed simultaneously.
+
+ <p align="center">
+ <img src="/img/dag6.png" width="80%" />
+ </p>
+
+- **Delete dependencies:** Click the "arrow" icon in the upper right corner <img src="/img/arrow.png" width="35"/>, select the connection line, and click the "Delete" icon in the upper right corner <img src= "/img/delete.png" width="35"/>, delete dependencies between tasks.
+ <p align="center">
+ <img src="/img/dag7.png" width="80%" />
+ </p>
+
+- **Save workflow definition:** Click the "Save" button, and the "Set DAG chart name" pop-up box will pop up, as shown in the figure below. Enter the workflow definition name, workflow definition description, and set global parameters (optional, refer to [ Custom parameters](#UserDefinedParameters)), click the "Add" button, and the workflow definition is created successfully.
+ <p align="center">
+ <img src="/img/dag8.png" width="80%" />
+ </p>
+> For other types of tasks, please refer to [Task Node Type and Parameter Settings](#TaskParamers).
+
+#### 2.3.2 Workflow definition operation function
+
+Click Project Management -> Workflow -> Workflow Definition to enter the workflow definition page, as shown below:
+
+<p align="center">
+<img src="/img/work_list_en.png" width="80%" />
+</p>
+The operation functions of the workflow definition list are as follows:
+
+- **Edit:** Only "offline" workflow definitions can be edited. Workflow DAG editing is the same as [Create Workflow Definition](#creatDag).
+- **Online:** When the workflow status is "Offline", used to online workflow. Only the workflow in the "Online" state can run, but cannot be edited.
+- **Offline:** When the workflow status is "Online", used to offline workflow. Only the workflow in the "Offline" state can be edited, but not run.
+- **Run:** Only workflow in the online state can run. See [2.3.3 Run Workflow](#runWorkflow) for the operation steps
+- **Timing:** Timing can only be set in online workflows, and the system automatically schedules the workflow to run on a regular basis. The status after creating a timing is "offline", and the timing must be online on the timing management page to take effect. See [2.3.4 Workflow Timing](#creatTiming) for timing operation steps.
+- **Timing Management:** The timing management page can be edited, online/offline, and deleted.
+- **Delete:** Delete the workflow definition.
+- **Download:** Download workflow definition to local.
+- **Tree Diagram:** Display the task node type and task status in a tree structure, as shown in the figure below:
+ <p align="center">
+ <img src="/img/tree_en.png" width="80%" />
+ </p>
+
+#### <span id=runWorkflow>2.3.3 Run the workflow</span>
+
+- Click Project Management -> Workflow -> Workflow Definition to enter the workflow definition page, as shown in the figure below, click the "Go Online" button <img src="/img/online.png" width="35"/>,Go online workflow.
+ <p align="center">
+ <img src="/img/work_list_en.png" width="80%" />
+ </p>
+
+- Click the "Run" button to pop up the startup parameter setting pop-up box, as shown in the figure below, set the startup parameters, click the "Run" button in the pop-up box, the workflow starts running, and the workflow instance page generates a workflow instance.
+ <p align="center">
+ <img src="/img/run_work_en.png" width="80%" />
+ </p>
+ <span id=runParamers>Description of workflow operating parameters:</span>
+
+ * Failure strategy: When a task node fails to execute, other parallel task nodes need to execute the strategy. "Continue" means: after a certain task fails, other task nodes execute normally; "End" means: terminate all tasks being executed, and terminate the entire process.
+ * Notification strategy: When the process is over, the process execution information notification email is sent according to the process status, including any status is not sent, successful sent, failed sent, successful or failed sent.
+ * Process priority: The priority of process operation, divided into five levels: highest (HIGHEST), high (HIGH), medium (MEDIUM), low (LOW), and lowest (LOWEST). When the number of master threads is insufficient, high-level processes will be executed first in the execution queue, and processes with the same priority will be executed in a first-in first-out order.
+ * Worker group: The process can only be executed in the specified worker machine group. The default is Default, which can be executed on any worker.
+ * Notification group: select notification strategy||timeout alarm||when fault tolerance occurs, process information or email will be sent to all members in the notification group.
+ * Recipient: Select notification policy||Timeout alarm||When fault tolerance occurs, process information or alarm email will be sent to the recipient list.
+ * Cc: Select the notification strategy||Timeout alarm||When fault tolerance occurs, the process information or warning email will be copied to the CC list.
+ * Complement: Two modes including serial complement and parallel complement. Serial complement: within the specified time range, the complement is executed sequentially from the start date to the end date, and only one process instance is generated; parallel complement: within the specified time range, multiple days are complemented at the same time to generate N process instances.
+ * For example, you need to fill in the data from May 1 to May 10.
+
+ <p align="center">
+ <img src="/img/complement_en1.png" width="80%" />
+ </p>
+
+ > Serial mode: The complement is executed sequentially from May 1 to May 10, and a process instance is generated on the process instance page;
+
+ > Parallel mode: The tasks from May 1 to may 10 are executed simultaneously, and 10 process instances are generated on the process instance page.
+
+#### <span id=creatTiming>2.3.4 Workflow timing</span>
+
+- Create timing: Click Project Management->Workflow->Workflow Definition, enter the workflow definition page, go online the workflow, click the "timing" button <img src="/img/timing.png" width="35"/> ,The timing parameter setting dialog box pops up, as shown in the figure below:
+ <p align="center">
+ <img src="/img/time_schedule_en.png" width="80%" />
+ </p>
+- Choose the start and end time. In the start and end time range, the workflow is run at regular intervals; not in the start and end time range, no more regular workflow instances are generated.
+- Add a timing that is executed once every day at 5 AM, as shown in the following figure:
+ <p align="center">
+ <img src="/img/timer-en.png" width="80%" />
+ </p>
+- Failure strategy, notification strategy, process priority, worker group, notification group, recipient, and CC are the same as [workflow running parameters](#runParamers).
+- Click the "Create" button to create the timing successfully. At this time, the timing status is "**Offline**" and the timing needs to be **Online** to take effect.
+- Timing online: Click the "timing management" button <img src="/img/timeManagement.png" width="35"/>, enter the timing management page, click the "online" button, the timing status will change to "online", as shown in the below figure, the workflow takes effect regularly.
+ <p align="center">
+ <img src="/img/time-manage-list-en.png" width="80%" />
+ </p>
+
+#### 2.3.5 Import workflow
+
+Click Project Management -> Workflow -> Workflow Definition to enter the workflow definition page, click the "Import Workflow" button to import the local workflow file, the workflow definition list displays the imported workflow, and the status is offline.
+
+#### 2.4 Workflow instance
+
+#### 2.4.1 View workflow instance
+
+- Click Project Management -> Workflow -> Workflow Instance to enter the Workflow Instance page, as shown in the figure below:
+ <p align="center">
+ <img src="/img/instance-list-en.png" width="80%" />
+ </p>
+- Click the workflow name to enter the DAG view page to view the task execution status, as shown in the figure below.
+ <p align="center">
+ <img src="/img/instance-runs-en.png" width="80%" />
+ </p>
+
+#### 2.4.2 View task log
+
+- Enter the workflow instance page, click the workflow name, enter the DAG view page, double-click the task node, as shown in the following figure:
+ <p align="center">
+ <img src="/img/instanceViewLog-en.png" width="80%" />
+ </p>
+- Click "View Log", a log pop-up box will pop up, as shown in the figure below, the task log can also be viewed on the task instance page, refer to [Task View Log](#taskLog)。
+ <p align="center">
+ <img src="/img/task-log-en.png" width="80%" />
+ </p>
+
+#### 2.4.3 View task history
+
+- Click Project Management -> Workflow -> Workflow Instance to enter the workflow instance page, and click the workflow name to enter the workflow DAG page;
+- Double-click the task node, as shown in the figure below, click "View History" to jump to the task instance page, and display a list of task instances running by the workflow instance
+ <p align="center">
+ <img src="/img/task_history_en.png" width="80%" />
+ </p>
+
+#### 2.4.4 View operating parameters
+
+- Click Project Management -> Workflow -> Workflow Instance to enter the workflow instance page, and click the workflow name to enter the workflow DAG page;
+- Click the icon in the upper left corner <img src="/img/run_params_button.png" width="35"/>,View the startup parameters of the workflow instance; click the icon <img src="/img/global_param.png" width="35"/>,View the global and local parameters of the workflow instance, as shown in the following figure:
+ <p align="center">
+ <img src="/img/run_params_en.png" width="80%" />
+ </p>
+
+#### 2.4.4 Workflow instance operation function
+
+Click Project Management -> Workflow -> Workflow Instance to enter the Workflow Instance page, as shown in the figure below:
+
+ <p align="center">
+ <img src="/img/instance-list-en.png" width="80%" />
+ </p>
+
+- **Edit:** Only terminated processes can be edited. Click the "Edit" button or the name of the workflow instance to enter the DAG edit page. After edit, click the "Save" button to pop up the Save DAG pop-up box, as shown in the figure below. In the pop-up box, check "Whether to update to workflow definition" and save After that, the workflow definition will be updated; if it is not checked, the workflow definition will not be updated.
+ <p align="center">
+ <img src="/img/editDag-en.png" width="80%" />
+ </p>
+- **Rerun:** Re-execute the terminated process.
+- **Recovery failed:** For failed processes, you can perform recovery operations, starting from the failed node.
+- **Stop:** To **stop** the running process, the background will first `kill`worker process, and then execute `kill -9` operation
+- **Pause:** Perform a **pause** operation on the running process, the system status will change to **waiting for execution**, it will wait for the end of the task being executed, and pause the next task to be executed.
+- **Resume pause:** To resume the paused process, start running directly from the **paused node**
+- **Delete:** Delete the workflow instance and the task instance under the workflow instance
+- **Gantt chart:** The vertical axis of the Gantt chart is the topological sorting of task instances under a certain workflow instance, and the horizontal axis is the running time of the task instances, as shown in the figure:
+ <p align="center">
+ <img src="/img/gantt-en.png" width="80%" />
+ </p>
+
+#### 2.5 Task instance
+
+- Click Project Management -> Workflow -> Task Instance to enter the task instance page, as shown in the figure below, click the name of the workflow instance, you can jump to the workflow instance DAG chart to view the task status.
+ <p align="center">
+ <img src="/img/task-list-en.png" width="80%" />
+ </p>
+
+- <span id=taskLog>View log:</span>Click the "view log" button in the operation column to view the log of task execution.
+ <p align="center">
+ <img src="/img/task-log2-en.png" width="80%" />
+ </p>
+
+### 3. Resource Center
+
+#### 3.1 hdfs resource configuration
+
+- Upload resource files and udf functions, all uploaded files and resources will be stored on hdfs, so the following configuration items are required:
+
+```
+
+conf/common/common.properties
+ # Users who have permission to create directories under the HDFS root path
+ hdfs.root.user=hdfs
+ # data base dir, resource file will store to this hadoop hdfs path, self configuration, please make sure the directory exists on hdfs and have read write permissions。"/escheduler" is recommended
+ data.store2hdfs.basepath=/dolphinscheduler
+ # resource upload startup type : HDFS,S3,NONE
+ res.upload.startup.type=HDFS
+ # whether kerberos starts
+ hadoop.security.authentication.startup.state=false
+ # java.security.krb5.conf path
+ java.security.krb5.conf.path=/opt/krb5.conf
+ # loginUserFromKeytab user
+ login.user.keytab.username=hdfs-mycluster@ESZ.COM
+ # loginUserFromKeytab path
+ login.user.keytab.path=/opt/hdfs.headless.keytab
+
+conf/common/hadoop.properties
+ # ha or single namenode,If namenode ha needs to copy core-site.xml and hdfs-site.xml
+ # to the conf directory,support s3,for example : s3a://dolphinscheduler
+ fs.defaultFS=hdfs://mycluster:8020
+ #resourcemanager ha note this need ips , this empty if single
+ yarn.resourcemanager.ha.rm.ids=192.168.xx.xx,192.168.xx.xx
+ # If it is a single resourcemanager, you only need to configure one host name. If it is resourcemanager HA, the default configuration is fine
+ yarn.application.status.address=http://xxxx:8088/ws/v1/cluster/apps/%s
+
+```
+
+- Only one address needs to be configured for yarn.resourcemanager.ha.rm.ids and yarn.application.status.address, and the other address is empty.
+- You need to copy core-site.xml and hdfs-site.xml from the conf directory of the Hadoop cluster to the conf directory of the dolphinscheduler project, and restart the api-server service.
+
+#### 3.2 File management
+
+> It is the management of various resource files, including creating basic txt/log/sh/conf/py/java and other files, uploading jar packages and other types of files, and can do edit, rename, download, delete and other operations.
+
+ <p align="center">
+ <img src="/img/file-manage-en.png" width="80%" />
+ </p>
+
+- Create a file
+ > The file format supports the following types: txt, log, sh, conf, cfg, py, java, sql, xml, hql, properties
+
+<p align="center">
+ <img src="/img/file_create_en.png" width="80%" />
+ </p>
+
+- upload files
+
+> Upload file: Click the "Upload File" button to upload, drag the file to the upload area, the file name will be automatically completed with the uploaded file name
+
+<p align="center">
+ <img src="/img/file-upload-en.png" width="80%" />
+ </p>
+
+- File View
+
+> For the file types that can be viewed, click the file name to view the file details
+
+<p align="center">
+ <img src="/img/file_detail_en.png" width="80%" />
+ </p>
+
+- download file
+
+> Click the "Download" button in the file list to download the file or click the "Download" button in the upper right corner of the file details to download the file
+
+- File rename
+
+<p align="center">
+ <img src="/img/file_rename_en.png" width="80%" />
+ </p>
+
+- delete
+ > File list -> Click the "Delete" button to delete the specified file
+
+#### 3.3 UDF management
+
+#### 3.3.1 Resource management
+
+> The resource management and file management functions are similar. The difference is that the resource management is the uploaded UDF function, and the file management uploads the user program, script and configuration file.
+> Operation function: rename, download, delete.
+
+- Upload udf resources
+ > Same as uploading files.
+
+#### 3.3.2 Function management
+
+- Create UDF function
+ > Click "Create UDF Function", enter the udf function parameters, select the udf resource, and click "Submit" to create the udf function.
+
+> Currently only supports temporary UDF functions of HIVE
+
+- UDF function name: the name when the UDF function is entered
+- Package name Class name: Enter the full path of the UDF function
+- UDF resource: Set the resource file corresponding to the created UDF
+
+<p align="center">
+ <img src="/img/udf_edit_en.png" width="80%" />
+ </p>
+
+### 4. Create data source
+
+> Data source center supports MySQL, POSTGRESQL, HIVE/IMPALA, SPARK, CLICKHOUSE, ORACLE, SQLSERVER and other data sources
+
+#### 4.1 Create/Edit MySQL data source
+
+- Click "Data Source Center -> Create Data Source" to create different types of data sources according to requirements.
+
+- Data source: select MYSQL
+- Data source name: enter the name of the data source
+- Description: Enter a description of the data source
+- IP hostname: enter the IP to connect to MySQL
+- Port: Enter the port to connect to MySQL
+- Username: Set the username for connecting to MySQL
+- Password: Set the password for connecting to MySQL
+- Database name: Enter the name of the database connected to MySQL
+- Jdbc connection parameters: parameter settings for MySQL connection, filled in in JSON form
+
+<p align="center">
+ <img src="/img/mysql-en.png" width="80%" />
+ </p>
+
+> Click "Test Connection" to test whether the data source can be successfully connected.
+
+#### 4.2 Create/Edit POSTGRESQL data source
+
+- Data source: select POSTGRESQL
+- Data source name: enter the name of the data source
+- Description: Enter a description of the data source
+- IP/Host Name: Enter the IP to connect to POSTGRESQL
+- Port: Enter the port to connect to POSTGRESQL
+- Username: Set the username for connecting to POSTGRESQL
+- Password: Set the password for connecting to POSTGRESQL
+- Database name: Enter the name of the database connected to POSTGRESQL
+- Jdbc connection parameters: parameter settings for POSTGRESQL connection, filled in in JSON form
+
+<p align="center">
+ <img src="/img/postgresql-en.png" width="80%" />
+ </p>
+
+#### 4.3 Create/Edit HIVE data source
+
+1.Use HiveServer2 to connect
+
+ <p align="center">
+ <img src="/img/hive-en.png" width="80%" />
+ </p>
+
+- Data source: select HIVE
+- Data source name: enter the name of the data source
+- Description: Enter a description of the data source
+- IP/Host Name: Enter the IP connected to HIVE
+- Port: Enter the port connected to HIVE
+- Username: Set the username for connecting to HIVE
+- Password: Set the password for connecting to HIVE
+- Database name: Enter the name of the database connected to HIVE
+- Jdbc connection parameters: parameter settings for HIVE connection, filled in in JSON form
+
+ 2.Use HiveServer2 HA Zookeeper to connect
+
+ <p align="center">
+ <img src="/img/hive1-en.png" width="80%" />
+ </p>
+
+Note: If you enable **kerberos**, you need to fill in **Principal**
+
+<p align="center">
+ <img src="/img/hive-en.png" width="80%" />
+ </p>
+
+#### 4.4 Create/Edit Spark data source
+
+<p align="center">
+ <img src="/img/spark-en.png" width="80%" />
+ </p>
+
+- Data source: select Spark
+- Data source name: enter the name of the data source
+- Description: Enter a description of the data source
+- IP/Hostname: Enter the IP connected to Spark
+- Port: Enter the port connected to Spark
+- Username: Set the username for connecting to Spark
+- Password: Set the password for connecting to Spark
+- Database name: Enter the name of the database connected to Spark
+- Jdbc connection parameters: parameter settings for Spark connection, filled in in JSON form
+
+### 5. Security Center (Permission System)
+
+ * Only the administrator account in the security center has the authority to operate. It has functions such as queue management, tenant management, user management, alarm group management, worker group management, token management, etc. In the user management module, resources, data sources, projects, etc. Authorization
+ * Administrator login, default user name and password: admin/dolphinscheduler123
+
+#### 5.1 Create queue
+
+- Queue is used when the "queue" parameter is needed to execute programs such as spark and mapreduce.
+- The administrator enters the Security Center->Queue Management page and clicks the "Create Queue" button to create a queue.
+<p align="center">
+ <img src="/img/create-queue-en.png" width="80%" />
+ </p>
+
+#### 5.2 Add tenant
+
+- The tenant corresponds to the Linux user, which is used by the worker to submit the job. If Linux does not have this user, the worker will create this user when executing the script.
+- Tenant Code: **Tenant Code is the only user on Linux and cannot be repeated**
+- The administrator enters the Security Center->Tenant Management page and clicks the "Create Tenant" button to create a tenant.
+
+ <p align="center">
+ <img src="/img/addtenant-en.png" width="80%" />
+ </p>
+
+#### 5.3 Create normal user
+
+- Users are divided into **administrator users** and **normal users**
+
+ - The administrator has authorization and user management authority, but does not have the authority to create project and workflow definition operations.
+ - Ordinary users can create projects and create, edit, and execute workflow definitions.
+ - Note: If the user switches tenants, all resources under the tenant where the user belongs will be copied to the new tenant that is switched.
+
+- The administrator enters the Security Center -> User Management page and clicks the "Create User" button to create a user.
+<p align="center">
+ <img src="/img/user-en.png" width="80%" />
+ </p>
+
+> **Edit user information**
+
+- The administrator enters the Security Center->User Management page and clicks the "Edit" button to edit user information.
+- After an ordinary user logs in, click the user information in the user name drop-down box to enter the user information page, and click the "Edit" button to edit the user information.
+
+> **Modify user password**
+
+- The administrator enters the Security Center->User Management page and clicks the "Edit" button. When editing user information, enter the new password to modify the user password.
+- After a normal user logs in, click the user information in the user name drop-down box to enter the password modification page, enter the password and confirm the password and click the "Edit" button, then the password modification is successful.
+
+#### 5.4 Create alarm group
+
+- The alarm group is a parameter set at startup. After the process ends, the status of the process and other information will be sent to the alarm group in the form of email.
+
+* The administrator enters the Security Center -> Alarm Group Management page and clicks the "Create Alarm Group" button to create an alarm group.
+
+ <p align="center">
+ <img src="/img/mail-en.png" width="80%" />
+
+#### 5.5 Token management
+
+> Since the back-end interface has login check, token management provides a way to perform various operations on the system by calling the interface.
+
+- The administrator enters the Security Center -> Token Management page, clicks the "Create Token" button, selects the expiration time and user, clicks the "Generate Token" button, and clicks the "Submit" button, then the selected user's token is created successfully.
+
+ <p align="center">
+ <img src="/img/create-token-en.png" width="80%" />
+ </p>
+
+ - After an ordinary user logs in, click the user information in the user name drop-down box, enter the token management page, select the expiration time, click the "generate token" button, and click the "submit" button, then the user creates a token successfully.
+ - Call example:
+
+```
+Token call example
+ /**
+ * test token
+ */
+ public void doPOSTParam()throws Exception{
+ // create HttpClient
+ CloseableHttpClient httpclient = HttpClients.createDefault();
+
+ // create http post request
+ HttpPost httpPost = new HttpPost("http://127.0.0.1:12345/escheduler/projects/create");
+ httpPost.setHeader("token", "123");
+ // set parameters
+ List<NameValuePair> parameters = new ArrayList<NameValuePair>();
+ parameters.add(new BasicNameValuePair("projectName", "qzw"));
+ parameters.add(new BasicNameValuePair("desc", "qzw"));
+ UrlEncodedFormEntity formEntity = new UrlEncodedFormEntity(parameters);
+ httpPost.setEntity(formEntity);
+ CloseableHttpResponse response = null;
+ try {
+ // execute
+ response = httpclient.execute(httpPost);
+ // response status code 200
+ if (response.getStatusLine().getStatusCode() == 200) {
+ String content = EntityUtils.toString(response.getEntity(), "UTF-8");
+ System.out.println(content);
+ }
+ } finally {
+ if (response != null) {
+ response.close();
+ }
+ httpclient.close();
+ }
+ }
+```
+
+#### 5.6 Granted permission
+
+ * Granted permissions include project permissions, resource permissions, data source permissions, UDF function permissions.
+ * The administrator can authorize the projects, resources, data sources and UDF functions not created by ordinary users. Because the authorization methods for projects, resources, data sources and UDF functions are the same, we take project authorization as an example.
+ * Note: For projects created by users themselves, the user has all permissions. The project list and the selected project list will not be displayed.
+
+- The administrator enters the Security Center -> User Management page and clicks the "Authorize" button of the user who needs to be authorized, as shown in the figure below:
+ <p align="center">
+ <img src="/img/auth-en.png" width="80%" />
+</p>
+
+- Select the project to authorize the project.
+
+<p align="center">
+ <img src="/img/authproject-en.png" width="80%" />
+ </p>
+
+- Resources, data sources, and UDF function authorization are the same as project authorization.
+
+### 6. monitoring Center
+
+#### 6.1 Service management
+
+- Service management is mainly to monitor and display the health status and basic information of each service in the system
+
+#### 6.1.1 master monitoring
+
+- Mainly related to master information.
+<p align="center">
+ <img src="/img/master-jk-en.png" width="80%" />
+ </p>
+
+#### 6.1.2 worker monitoring
+
+- Mainly related to worker information.
+
+<p align="center">
+ <img src="/img/worker-jk-en.png" width="80%" />
+ </p>
+
+#### 6.1.3 Zookeeper monitoring
+
+- Mainly related configuration information of each worker and master in zookpeeper.
+
+<p align="center">
+ <img src="/img/zookeeper-monitor-en.png" width="80%" />
+ </p>
+
+#### 6.1.4 DB monitoring
+
+- Mainly the health of the DB
+
+<p align="center">
+ <img src="/img/mysql-jk-en.png" width="80%" />
+ </p>
+
+#### 6.2 Statistics management
+
+<p align="center">
+ <img src="/img/statistics-en.png" width="80%" />
+ </p>
+
+- Number of commands to be executed: statistics on the t_ds_command table
+- The number of failed commands: statistics on the t_ds_error_command table
+- Number of tasks to run: Count the data of task_queue in Zookeeper
+- Number of tasks to be killed: Count the data of task_kill in Zookeeper
+
+### 7. <span id=TaskParamers>Task node type and parameter settings</span>
+
+#### 7.1 Shell node
+
+> Shell node, when the worker is executed, a temporary shell script is generated, and the linux user with the same name as the tenant executes the script.
+
+- Click Project Management-Project Name-Workflow Definition, and click the "Create Workflow" button to enter the DAG editing page.
+- Drag <img src="/img/shell.png" width="35"/> from the toolbar to the drawing board, as shown in the figure below:
+
+ <p align="center">
+ <img src="/img/shell-en.png" width="80%" />
+ </p>
+
+- Node name: The node name in a workflow definition is unique.
+- Run flag: Identifies whether this node can be scheduled normally, if it does not need to be executed, you can turn on the prohibition switch.
+- Descriptive information: describe the function of the node.
+- Task priority: When the number of worker threads is insufficient, they are executed in order from high to low, and when the priority is the same, they are executed according to the first-in first-out principle.
+- Worker grouping: Tasks are assigned to the machines of the worker group to execute. If Default is selected, a worker machine will be randomly selected for execution.
+- Number of failed retry attempts: The number of times the task failed to be resubmitted. It supports drop-down and hand-filling.
+- Failed retry interval: The time interval for resubmitting the task after a failed task. It supports drop-down and hand-filling.
Review comment:
```suggestion
- Failed retry interval: The time interval for resubmitting the task after a task failed. It supports drop-down and hand-filling.
```
##########
File path: docs/en-us/1.3.2/user_doc/system-manual.md
##########
@@ -0,0 +1,886 @@
+# System User Manual
+
+## Get started quickly
+
+> Please refer to [Quick Start](quick-start.html)
+
+## Operation guide
+
+### 1. Home
+
+The home page contains task status statistics, process status statistics, and workflow definition statistics for all projects of the user.
+
+<p align="center">
+<img src="/img/home_en.png" width="80%" />
+</p>
+
+### 2. Project management
+
+#### 2.1 Create project
+
+- Click "Project Management" to enter the project management page, click the "Create Project" button, enter the project name, project description, and click "Submit" to create a new project.
+
+ <p align="center">
+ <img src="/img/create_project_en1.png" width="80%" />
+ </p>
+
+#### 2.2 Project home
+
+- Click the project name link on the project management page to enter the project home page, as shown in the figure below, the project home page contains the task status statistics, process status statistics, and workflow definition statistics of the project.
+ <p align="center">
+ <img src="/img/project_home_en.png" width="80%" />
+ </p>
+
+- Task status statistics: within the specified time range, count the number of task instances as successful submission, running, ready to pause, pause, ready to stop, stop, failure, success, fault tolerance, kill, and waiting threads
+- Process status statistics: within the specified time range, count the number of the status of the workflow instance as submission success, running, ready to pause, pause, ready to stop, stop, failure, success, fault tolerance, kill, and waiting threads
+- Workflow definition statistics: Count the workflow definitions created by this user and the workflow definitions granted to this user by the administrator
+
+#### 2.3 Workflow definition
+
+#### <span id=creatDag>2.3.1 Create workflow definition</span>
+
+- Click Project Management -> Workflow -> Workflow Definition to enter the workflow definition page, and click the "Create Workflow" button to enter the **workflow DAG edit** page, as shown in the following figure:
+ <p align="center">
+ <img src="/img/dag5.png" width="80%" />
+ </p>
+- Drag in the toolbar <img src="/img/shell.png" width="35"/> Add a Shell task to the drawing board, as shown in the figure below:
+ <p align="center">
+ <img src="/img/shell-en.png" width="80%" />
+ </p>
+- **Add parameter settings for this shell task:**
+
+1. Fill in the "Node Name", "Description", and "Script" fields;
+2. Check “Normal” for “Run Flag”. If “Prohibit Execution” is checked, the task will not be executed when the workflow runs;
+3. Select "Task Priority": When the number of worker threads is insufficient, high-level tasks will be executed first in the execution queue, and tasks with the same priority will be executed in the order of first in, first out;
+4. Timeout alarm (optional): Check the timeout alarm, timeout failure, and fill in the "timeout period". When the task execution time exceeds **timeout period**, an alert email will be sent and the task timeout fails;
+5. Resources (optional). Resource files are files created or uploaded on the Resource Center -> File Management page. For example, the file name is `test.sh`, and the command to call the resource in the script is `sh test.sh`;
+6. Custom parameters (optional), refer to [Custom Parameters](#UserDefinedParameters);
+7. Click the "Confirm Add" button to save the task settings.
+
+- **Increase the order of task execution:** Click the icon in the upper right corner <img src="/img/line.png" width="35"/> to connect the task; as shown in the figure below, task 2 and task 3 are executed in parallel, When task 1 finished execute, tasks 2 and 3 will be executed simultaneously.
+
+ <p align="center">
+ <img src="/img/dag6.png" width="80%" />
+ </p>
+
+- **Delete dependencies:** Click the "arrow" icon in the upper right corner <img src="/img/arrow.png" width="35"/>, select the connection line, and click the "Delete" icon in the upper right corner <img src= "/img/delete.png" width="35"/>, delete dependencies between tasks.
+ <p align="center">
+ <img src="/img/dag7.png" width="80%" />
+ </p>
+
+- **Save workflow definition:** Click the "Save" button, and the "Set DAG chart name" pop-up box will pop up, as shown in the figure below. Enter the workflow definition name, workflow definition description, and set global parameters (optional, refer to [ Custom parameters](#UserDefinedParameters)), click the "Add" button, and the workflow definition is created successfully.
+ <p align="center">
+ <img src="/img/dag8.png" width="80%" />
+ </p>
+> For other types of tasks, please refer to [Task Node Type and Parameter Settings](#TaskParamers).
+
+#### 2.3.2 Workflow definition operation function
+
+Click Project Management -> Workflow -> Workflow Definition to enter the workflow definition page, as shown below:
+
+<p align="center">
+<img src="/img/work_list_en.png" width="80%" />
+</p>
+The operation functions of the workflow definition list are as follows:
+
+- **Edit:** Only "offline" workflow definitions can be edited. Workflow DAG editing is the same as [Create Workflow Definition](#creatDag).
+- **Online:** When the workflow status is "Offline", used to online workflow. Only the workflow in the "Online" state can run, but cannot be edited.
+- **Offline:** When the workflow status is "Online", used to offline workflow. Only the workflow in the "Offline" state can be edited, but not run.
+- **Run:** Only workflow in the online state can run. See [2.3.3 Run Workflow](#runWorkflow) for the operation steps
+- **Timing:** Timing can only be set in online workflows, and the system automatically schedules the workflow to run on a regular basis. The status after creating a timing is "offline", and the timing must be online on the timing management page to take effect. See [2.3.4 Workflow Timing](#creatTiming) for timing operation steps.
+- **Timing Management:** The timing management page can be edited, online/offline, and deleted.
+- **Delete:** Delete the workflow definition.
+- **Download:** Download workflow definition to local.
+- **Tree Diagram:** Display the task node type and task status in a tree structure, as shown in the figure below:
+ <p align="center">
+ <img src="/img/tree_en.png" width="80%" />
+ </p>
+
+#### <span id=runWorkflow>2.3.3 Run the workflow</span>
+
+- Click Project Management -> Workflow -> Workflow Definition to enter the workflow definition page, as shown in the figure below, click the "Go Online" button <img src="/img/online.png" width="35"/>,Go online workflow.
+ <p align="center">
+ <img src="/img/work_list_en.png" width="80%" />
+ </p>
+
+- Click the "Run" button to pop up the startup parameter setting pop-up box, as shown in the figure below, set the startup parameters, click the "Run" button in the pop-up box, the workflow starts running, and the workflow instance page generates a workflow instance.
+ <p align="center">
+ <img src="/img/run_work_en.png" width="80%" />
+ </p>
+ <span id=runParamers>Description of workflow operating parameters:</span>
+
+ * Failure strategy: When a task node fails to execute, other parallel task nodes need to execute the strategy. "Continue" means: after a certain task fails, other task nodes execute normally; "End" means: terminate all tasks being executed, and terminate the entire process.
+ * Notification strategy: When the process is over, the process execution information notification email is sent according to the process status, including any status is not sent, successful sent, failed sent, successful or failed sent.
+ * Process priority: The priority of process operation, divided into five levels: highest (HIGHEST), high (HIGH), medium (MEDIUM), low (LOW), and lowest (LOWEST). When the number of master threads is insufficient, high-level processes will be executed first in the execution queue, and processes with the same priority will be executed in a first-in first-out order.
+ * Worker group: The process can only be executed in the specified worker machine group. The default is Default, which can be executed on any worker.
+ * Notification group: select notification strategy||timeout alarm||when fault tolerance occurs, process information or email will be sent to all members in the notification group.
+ * Recipient: Select notification policy||Timeout alarm||When fault tolerance occurs, process information or alarm email will be sent to the recipient list.
+ * Cc: Select the notification strategy||Timeout alarm||When fault tolerance occurs, the process information or warning email will be copied to the CC list.
+ * Complement: Two modes including serial complement and parallel complement. Serial complement: within the specified time range, the complement is executed sequentially from the start date to the end date, and only one process instance is generated; parallel complement: within the specified time range, multiple days are complemented at the same time to generate N process instances.
+ * For example, you need to fill in the data from May 1 to May 10.
+
+ <p align="center">
+ <img src="/img/complement_en1.png" width="80%" />
+ </p>
+
+ > Serial mode: The complement is executed sequentially from May 1 to May 10, and a process instance is generated on the process instance page;
+
+ > Parallel mode: The tasks from May 1 to may 10 are executed simultaneously, and 10 process instances are generated on the process instance page.
+
+#### <span id=creatTiming>2.3.4 Workflow timing</span>
+
+- Create timing: Click Project Management->Workflow->Workflow Definition, enter the workflow definition page, go online the workflow, click the "timing" button <img src="/img/timing.png" width="35"/> ,The timing parameter setting dialog box pops up, as shown in the figure below:
+ <p align="center">
+ <img src="/img/time_schedule_en.png" width="80%" />
+ </p>
+- Choose the start and end time. In the start and end time range, the workflow is run at regular intervals; not in the start and end time range, no more regular workflow instances are generated.
+- Add a timing that is executed once every day at 5 AM, as shown in the following figure:
+ <p align="center">
+ <img src="/img/timer-en.png" width="80%" />
+ </p>
+- Failure strategy, notification strategy, process priority, worker group, notification group, recipient, and CC are the same as [workflow running parameters](#runParamers).
+- Click the "Create" button to create the timing successfully. At this time, the timing status is "**Offline**" and the timing needs to be **Online** to take effect.
+- Timing online: Click the "timing management" button <img src="/img/timeManagement.png" width="35"/>, enter the timing management page, click the "online" button, the timing status will change to "online", as shown in the below figure, the workflow takes effect regularly.
+ <p align="center">
+ <img src="/img/time-manage-list-en.png" width="80%" />
+ </p>
+
+#### 2.3.5 Import workflow
+
+Click Project Management -> Workflow -> Workflow Definition to enter the workflow definition page, click the "Import Workflow" button to import the local workflow file, the workflow definition list displays the imported workflow, and the status is offline.
+
+#### 2.4 Workflow instance
+
+#### 2.4.1 View workflow instance
+
+- Click Project Management -> Workflow -> Workflow Instance to enter the Workflow Instance page, as shown in the figure below:
+ <p align="center">
+ <img src="/img/instance-list-en.png" width="80%" />
+ </p>
+- Click the workflow name to enter the DAG view page to view the task execution status, as shown in the figure below.
+ <p align="center">
+ <img src="/img/instance-runs-en.png" width="80%" />
+ </p>
+
+#### 2.4.2 View task log
+
+- Enter the workflow instance page, click the workflow name, enter the DAG view page, double-click the task node, as shown in the following figure:
+ <p align="center">
+ <img src="/img/instanceViewLog-en.png" width="80%" />
+ </p>
+- Click "View Log", a log pop-up box will pop up, as shown in the figure below, the task log can also be viewed on the task instance page, refer to [Task View Log](#taskLog)。
+ <p align="center">
+ <img src="/img/task-log-en.png" width="80%" />
+ </p>
+
+#### 2.4.3 View task history
+
+- Click Project Management -> Workflow -> Workflow Instance to enter the workflow instance page, and click the workflow name to enter the workflow DAG page;
+- Double-click the task node, as shown in the figure below, click "View History" to jump to the task instance page, and display a list of task instances running by the workflow instance
+ <p align="center">
+ <img src="/img/task_history_en.png" width="80%" />
+ </p>
+
+#### 2.4.4 View operating parameters
+
+- Click Project Management -> Workflow -> Workflow Instance to enter the workflow instance page, and click the workflow name to enter the workflow DAG page;
+- Click the icon in the upper left corner <img src="/img/run_params_button.png" width="35"/>,View the startup parameters of the workflow instance; click the icon <img src="/img/global_param.png" width="35"/>,View the global and local parameters of the workflow instance, as shown in the following figure:
+ <p align="center">
+ <img src="/img/run_params_en.png" width="80%" />
+ </p>
+
+#### 2.4.4 Workflow instance operation function
+
+Click Project Management -> Workflow -> Workflow Instance to enter the Workflow Instance page, as shown in the figure below:
+
+ <p align="center">
+ <img src="/img/instance-list-en.png" width="80%" />
+ </p>
+
+- **Edit:** Only terminated processes can be edited. Click the "Edit" button or the name of the workflow instance to enter the DAG edit page. After edit, click the "Save" button to pop up the Save DAG pop-up box, as shown in the figure below. In the pop-up box, check "Whether to update to workflow definition" and save After that, the workflow definition will be updated; if it is not checked, the workflow definition will not be updated.
+ <p align="center">
+ <img src="/img/editDag-en.png" width="80%" />
+ </p>
+- **Rerun:** Re-execute the terminated process.
+- **Recovery failed:** For failed processes, you can perform recovery operations, starting from the failed node.
+- **Stop:** To **stop** the running process, the background will first `kill`worker process, and then execute `kill -9` operation
+- **Pause:** Perform a **pause** operation on the running process, the system status will change to **waiting for execution**, it will wait for the end of the task being executed, and pause the next task to be executed.
+- **Resume pause:** To resume the paused process, start running directly from the **paused node**
+- **Delete:** Delete the workflow instance and the task instance under the workflow instance
+- **Gantt chart:** The vertical axis of the Gantt chart is the topological sorting of task instances under a certain workflow instance, and the horizontal axis is the running time of the task instances, as shown in the figure:
+ <p align="center">
+ <img src="/img/gantt-en.png" width="80%" />
+ </p>
+
+#### 2.5 Task instance
+
+- Click Project Management -> Workflow -> Task Instance to enter the task instance page, as shown in the figure below, click the name of the workflow instance, you can jump to the workflow instance DAG chart to view the task status.
+ <p align="center">
+ <img src="/img/task-list-en.png" width="80%" />
+ </p>
+
+- <span id=taskLog>View log:</span>Click the "view log" button in the operation column to view the log of task execution.
+ <p align="center">
+ <img src="/img/task-log2-en.png" width="80%" />
+ </p>
+
+### 3. Resource Center
+
+#### 3.1 hdfs resource configuration
+
+- Upload resource files and udf functions, all uploaded files and resources will be stored on hdfs, so the following configuration items are required:
+
+```
+
+conf/common/common.properties
+ # Users who have permission to create directories under the HDFS root path
+ hdfs.root.user=hdfs
+ # data base dir, resource file will store to this hadoop hdfs path, self configuration, please make sure the directory exists on hdfs and have read write permissions。"/escheduler" is recommended
+ data.store2hdfs.basepath=/dolphinscheduler
+ # resource upload startup type : HDFS,S3,NONE
+ res.upload.startup.type=HDFS
+ # whether kerberos starts
+ hadoop.security.authentication.startup.state=false
+ # java.security.krb5.conf path
+ java.security.krb5.conf.path=/opt/krb5.conf
+ # loginUserFromKeytab user
+ login.user.keytab.username=hdfs-mycluster@ESZ.COM
+ # loginUserFromKeytab path
+ login.user.keytab.path=/opt/hdfs.headless.keytab
+
+conf/common/hadoop.properties
+ # ha or single namenode,If namenode ha needs to copy core-site.xml and hdfs-site.xml
+ # to the conf directory,support s3,for example : s3a://dolphinscheduler
+ fs.defaultFS=hdfs://mycluster:8020
+ #resourcemanager ha note this need ips , this empty if single
+ yarn.resourcemanager.ha.rm.ids=192.168.xx.xx,192.168.xx.xx
+ # If it is a single resourcemanager, you only need to configure one host name. If it is resourcemanager HA, the default configuration is fine
+ yarn.application.status.address=http://xxxx:8088/ws/v1/cluster/apps/%s
+
+```
+
+- Only one address needs to be configured for yarn.resourcemanager.ha.rm.ids and yarn.application.status.address, and the other address is empty.
+- You need to copy core-site.xml and hdfs-site.xml from the conf directory of the Hadoop cluster to the conf directory of the dolphinscheduler project, and restart the api-server service.
+
+#### 3.2 File management
+
+> It is the management of various resource files, including creating basic txt/log/sh/conf/py/java and other files, uploading jar packages and other types of files, and can do edit, rename, download, delete and other operations.
+
+ <p align="center">
+ <img src="/img/file-manage-en.png" width="80%" />
+ </p>
+
+- Create a file
+ > The file format supports the following types: txt, log, sh, conf, cfg, py, java, sql, xml, hql, properties
+
+<p align="center">
+ <img src="/img/file_create_en.png" width="80%" />
+ </p>
+
+- upload files
+
+> Upload file: Click the "Upload File" button to upload, drag the file to the upload area, the file name will be automatically completed with the uploaded file name
+
+<p align="center">
+ <img src="/img/file-upload-en.png" width="80%" />
+ </p>
+
+- File View
+
+> For the file types that can be viewed, click the file name to view the file details
+
+<p align="center">
+ <img src="/img/file_detail_en.png" width="80%" />
+ </p>
+
+- download file
+
+> Click the "Download" button in the file list to download the file or click the "Download" button in the upper right corner of the file details to download the file
+
+- File rename
+
+<p align="center">
+ <img src="/img/file_rename_en.png" width="80%" />
+ </p>
+
+- delete
+ > File list -> Click the "Delete" button to delete the specified file
+
+#### 3.3 UDF management
+
+#### 3.3.1 Resource management
+
+> The resource management and file management functions are similar. The difference is that the resource management is the uploaded UDF function, and the file management uploads the user program, script and configuration file.
+> Operation function: rename, download, delete.
+
+- Upload udf resources
+ > Same as uploading files.
+
+#### 3.3.2 Function management
+
+- Create UDF function
+ > Click "Create UDF Function", enter the udf function parameters, select the udf resource, and click "Submit" to create the udf function.
+
+> Currently only supports temporary UDF functions of HIVE
+
+- UDF function name: the name when the UDF function is entered
+- Package name Class name: Enter the full path of the UDF function
+- UDF resource: Set the resource file corresponding to the created UDF
+
+<p align="center">
+ <img src="/img/udf_edit_en.png" width="80%" />
+ </p>
+
+### 4. Create data source
+
+> Data source center supports MySQL, POSTGRESQL, HIVE/IMPALA, SPARK, CLICKHOUSE, ORACLE, SQLSERVER and other data sources
+
+#### 4.1 Create/Edit MySQL data source
+
+- Click "Data Source Center -> Create Data Source" to create different types of data sources according to requirements.
+
+- Data source: select MYSQL
+- Data source name: enter the name of the data source
+- Description: Enter a description of the data source
+- IP hostname: enter the IP to connect to MySQL
+- Port: Enter the port to connect to MySQL
+- Username: Set the username for connecting to MySQL
+- Password: Set the password for connecting to MySQL
+- Database name: Enter the name of the database connected to MySQL
+- Jdbc connection parameters: parameter settings for MySQL connection, filled in in JSON form
+
+<p align="center">
+ <img src="/img/mysql-en.png" width="80%" />
+ </p>
+
+> Click "Test Connection" to test whether the data source can be successfully connected.
+
+#### 4.2 Create/Edit POSTGRESQL data source
+
+- Data source: select POSTGRESQL
+- Data source name: enter the name of the data source
+- Description: Enter a description of the data source
+- IP/Host Name: Enter the IP to connect to POSTGRESQL
+- Port: Enter the port to connect to POSTGRESQL
+- Username: Set the username for connecting to POSTGRESQL
+- Password: Set the password for connecting to POSTGRESQL
+- Database name: Enter the name of the database connected to POSTGRESQL
+- Jdbc connection parameters: parameter settings for POSTGRESQL connection, filled in in JSON form
+
+<p align="center">
+ <img src="/img/postgresql-en.png" width="80%" />
+ </p>
+
+#### 4.3 Create/Edit HIVE data source
+
+1.Use HiveServer2 to connect
+
+ <p align="center">
+ <img src="/img/hive-en.png" width="80%" />
+ </p>
+
+- Data source: select HIVE
+- Data source name: enter the name of the data source
+- Description: Enter a description of the data source
+- IP/Host Name: Enter the IP connected to HIVE
+- Port: Enter the port connected to HIVE
+- Username: Set the username for connecting to HIVE
+- Password: Set the password for connecting to HIVE
+- Database name: Enter the name of the database connected to HIVE
+- Jdbc connection parameters: parameter settings for HIVE connection, filled in in JSON form
+
+ 2.Use HiveServer2 HA Zookeeper to connect
+
+ <p align="center">
+ <img src="/img/hive1-en.png" width="80%" />
+ </p>
+
+Note: If you enable **kerberos**, you need to fill in **Principal**
+
+<p align="center">
+ <img src="/img/hive-en.png" width="80%" />
+ </p>
+
+#### 4.4 Create/Edit Spark data source
+
+<p align="center">
+ <img src="/img/spark-en.png" width="80%" />
+ </p>
+
+- Data source: select Spark
+- Data source name: enter the name of the data source
+- Description: Enter a description of the data source
+- IP/Hostname: Enter the IP connected to Spark
+- Port: Enter the port connected to Spark
+- Username: Set the username for connecting to Spark
+- Password: Set the password for connecting to Spark
+- Database name: Enter the name of the database connected to Spark
+- Jdbc connection parameters: parameter settings for Spark connection, filled in in JSON form
+
+### 5. Security Center (Permission System)
+
+ * Only the administrator account in the security center has the authority to operate. It has functions such as queue management, tenant management, user management, alarm group management, worker group management, token management, etc. In the user management module, resources, data sources, projects, etc. Authorization
+ * Administrator login, default user name and password: admin/dolphinscheduler123
+
+#### 5.1 Create queue
+
+- Queue is used when the "queue" parameter is needed to execute programs such as spark and mapreduce.
+- The administrator enters the Security Center->Queue Management page and clicks the "Create Queue" button to create a queue.
+<p align="center">
+ <img src="/img/create-queue-en.png" width="80%" />
+ </p>
+
+#### 5.2 Add tenant
+
+- The tenant corresponds to the Linux user, which is used by the worker to submit the job. If Linux does not have this user, the worker will create this user when executing the script.
+- Tenant Code: **Tenant Code is the only user on Linux and cannot be repeated**
+- The administrator enters the Security Center->Tenant Management page and clicks the "Create Tenant" button to create a tenant.
+
+ <p align="center">
+ <img src="/img/addtenant-en.png" width="80%" />
+ </p>
+
+#### 5.3 Create normal user
+
+- Users are divided into **administrator users** and **normal users**
+
+ - The administrator has authorization and user management authority, but does not have the authority to create project and workflow definition operations.
+ - Ordinary users can create projects and create, edit, and execute workflow definitions.
+ - Note: If the user switches tenants, all resources under the tenant where the user belongs will be copied to the new tenant that is switched.
+
+- The administrator enters the Security Center -> User Management page and clicks the "Create User" button to create a user.
+<p align="center">
+ <img src="/img/user-en.png" width="80%" />
+ </p>
+
+> **Edit user information**
+
+- The administrator enters the Security Center->User Management page and clicks the "Edit" button to edit user information.
+- After an ordinary user logs in, click the user information in the user name drop-down box to enter the user information page, and click the "Edit" button to edit the user information.
+
+> **Modify user password**
+
+- The administrator enters the Security Center->User Management page and clicks the "Edit" button. When editing user information, enter the new password to modify the user password.
+- After a normal user logs in, click the user information in the user name drop-down box to enter the password modification page, enter the password and confirm the password and click the "Edit" button, then the password modification is successful.
+
+#### 5.4 Create alarm group
+
+- The alarm group is a parameter set at startup. After the process ends, the status of the process and other information will be sent to the alarm group in the form of email.
+
+* The administrator enters the Security Center -> Alarm Group Management page and clicks the "Create Alarm Group" button to create an alarm group.
+
+ <p align="center">
+ <img src="/img/mail-en.png" width="80%" />
+
+#### 5.5 Token management
+
+> Since the back-end interface has login check, token management provides a way to perform various operations on the system by calling the interface.
+
+- The administrator enters the Security Center -> Token Management page, clicks the "Create Token" button, selects the expiration time and user, clicks the "Generate Token" button, and clicks the "Submit" button, then the selected user's token is created successfully.
+
+ <p align="center">
+ <img src="/img/create-token-en.png" width="80%" />
+ </p>
+
+ - After an ordinary user logs in, click the user information in the user name drop-down box, enter the token management page, select the expiration time, click the "generate token" button, and click the "submit" button, then the user creates a token successfully.
+ - Call example:
+
+```
+Token call example
+ /**
+ * test token
+ */
+ public void doPOSTParam()throws Exception{
+ // create HttpClient
+ CloseableHttpClient httpclient = HttpClients.createDefault();
+
+ // create http post request
+ HttpPost httpPost = new HttpPost("http://127.0.0.1:12345/escheduler/projects/create");
+ httpPost.setHeader("token", "123");
+ // set parameters
+ List<NameValuePair> parameters = new ArrayList<NameValuePair>();
+ parameters.add(new BasicNameValuePair("projectName", "qzw"));
+ parameters.add(new BasicNameValuePair("desc", "qzw"));
+ UrlEncodedFormEntity formEntity = new UrlEncodedFormEntity(parameters);
+ httpPost.setEntity(formEntity);
+ CloseableHttpResponse response = null;
+ try {
+ // execute
+ response = httpclient.execute(httpPost);
+ // response status code 200
+ if (response.getStatusLine().getStatusCode() == 200) {
+ String content = EntityUtils.toString(response.getEntity(), "UTF-8");
+ System.out.println(content);
+ }
+ } finally {
+ if (response != null) {
+ response.close();
+ }
+ httpclient.close();
+ }
+ }
+```
+
+#### 5.6 Granted permission
+
+ * Granted permissions include project permissions, resource permissions, data source permissions, UDF function permissions.
+ * The administrator can authorize the projects, resources, data sources and UDF functions not created by ordinary users. Because the authorization methods for projects, resources, data sources and UDF functions are the same, we take project authorization as an example.
+ * Note: For projects created by users themselves, the user has all permissions. The project list and the selected project list will not be displayed.
+
+- The administrator enters the Security Center -> User Management page and clicks the "Authorize" button of the user who needs to be authorized, as shown in the figure below:
+ <p align="center">
+ <img src="/img/auth-en.png" width="80%" />
+</p>
+
+- Select the project to authorize the project.
+
+<p align="center">
+ <img src="/img/authproject-en.png" width="80%" />
+ </p>
+
+- Resources, data sources, and UDF function authorization are the same as project authorization.
+
+### 6. monitoring Center
+
+#### 6.1 Service management
+
+- Service management is mainly to monitor and display the health status and basic information of each service in the system
+
+#### 6.1.1 master monitoring
+
+- Mainly related to master information.
+<p align="center">
+ <img src="/img/master-jk-en.png" width="80%" />
+ </p>
+
+#### 6.1.2 worker monitoring
+
+- Mainly related to worker information.
+
+<p align="center">
+ <img src="/img/worker-jk-en.png" width="80%" />
+ </p>
+
+#### 6.1.3 Zookeeper monitoring
+
+- Mainly related configuration information of each worker and master in zookpeeper.
+
+<p align="center">
+ <img src="/img/zookeeper-monitor-en.png" width="80%" />
+ </p>
+
+#### 6.1.4 DB monitoring
+
+- Mainly the health of the DB
+
+<p align="center">
+ <img src="/img/mysql-jk-en.png" width="80%" />
+ </p>
+
+#### 6.2 Statistics management
+
+<p align="center">
+ <img src="/img/statistics-en.png" width="80%" />
+ </p>
+
+- Number of commands to be executed: statistics on the t_ds_command table
+- The number of failed commands: statistics on the t_ds_error_command table
+- Number of tasks to run: Count the data of task_queue in Zookeeper
+- Number of tasks to be killed: Count the data of task_kill in Zookeeper
+
+### 7. <span id=TaskParamers>Task node type and parameter settings</span>
+
+#### 7.1 Shell node
+
+> Shell node, when the worker is executed, a temporary shell script is generated, and the linux user with the same name as the tenant executes the script.
+
+- Click Project Management-Project Name-Workflow Definition, and click the "Create Workflow" button to enter the DAG editing page.
+- Drag <img src="/img/shell.png" width="35"/> from the toolbar to the drawing board, as shown in the figure below:
+
+ <p align="center">
+ <img src="/img/shell-en.png" width="80%" />
+ </p>
+
+- Node name: The node name in a workflow definition is unique.
+- Run flag: Identifies whether this node can be scheduled normally, if it does not need to be executed, you can turn on the prohibition switch.
+- Descriptive information: describe the function of the node.
+- Task priority: When the number of worker threads is insufficient, they are executed in order from high to low, and when the priority is the same, they are executed according to the first-in first-out principle.
+- Worker grouping: Tasks are assigned to the machines of the worker group to execute. If Default is selected, a worker machine will be randomly selected for execution.
+- Number of failed retry attempts: The number of times the task failed to be resubmitted. It supports drop-down and hand-filling.
+- Failed retry interval: The time interval for resubmitting the task after a failed task. It supports drop-down and hand-filling.
+- Timeout alarm: Check the timeout alarm and timeout failure. When the task exceeds the "timeout period", an alarm email will be sent and the task execution will fail.
+- Script: SHELL program developed by users.
+- Resource: Refers to the list of resource files that need to be called in the script, and the files uploaded or created by the resource center-file management.
+- User-defined parameters: It is a user-defined parameter that is part of SHELL, which will replace the content with \${variable} in the script.
+
+#### 7.2 Sub-process node
+
+- The sub-process node is to execute a certain external workflow definition as a task node.
+ > Drag the  task node in the toolbar to the drawing board, as shown in the following figure:
+
+<p align="center">
+ <img src="/img/sub-process-en.png" width="80%" />
+ </p>
+
+- Node name: The node name in a workflow definition is unique
+- Run flag: identify whether this node can be scheduled normally
+- Descriptive information: describe the function of the node
+- Timeout alarm: Check the timeout alarm and timeout failure. When the task exceeds the "timeout period", an alarm email will be sent and the task execution will fail.
+- Sub-node: It is the workflow definition of the selected sub-process. Enter the sub-node in the upper right corner to jump to the workflow definition of the selected sub-process
+
+#### 7.3 DEPENDENT node
+
+- Dependent nodes are **dependency check nodes**. For example, process A depends on the successful execution of process B yesterday, and the dependent node will check whether process B has a successful execution yesterday.
+
+> Drag the  task node in the toolbar to the drawing board, as shown in the following figure:
+
+<p align="center">
+ <img src="/img/dependent-nodes-en.png" width="80%" />
+ </p>
+
+> The dependent node provides a logical judgment function, such as checking whether the B process was successful yesterday, or whether the C process was executed successfully.
+
+ <p align="center">
+ <img src="/img/depend-node-en.png" width="80%" />
+ </p>
+
+> For example, process A is a weekly report task, processes B and C are daily tasks, and task A requires tasks B and C to be successfully executed every day of the last week, as shown in the figure:
+
+ <p align="center">
+ <img src="/img/depend-node1-en.png" width="80%" />
+ </p>
+
+> If the weekly report A also needs to be executed successfully last Tuesday:
+
+ <p align="center">
+ <img src="/img/depend-node3-en.png" width="80%" />
+ </p>
+
+#### 7.4 Stored procedure node
+
+- According to the selected data source, execute the stored procedure.
+ > Drag in the toolbarThe task node to the drawing board, as shown in the following figure:
+
+<p align="center">
+ <img src="/img/procedure-en.png" width="80%" />
+ </p>
+
+- Data source: The data source type of the stored procedure supports MySQL and POSTGRESQL, select the corresponding data source
+- Method: is the method name of the stored procedure
+- Custom parameters: The custom parameter types of the stored procedure support IN and OUT, and the data types support nine data types: VARCHAR, INTEGER, LONG, FLOAT, DOUBLE, DATE, TIME, TIMESTAMP, and BOOLEAN
+
+#### 7.5 SQL node
+
+- Drag in the toolbarTask node into the drawing board
+- Non-query SQL function: edit non-query SQL task information, select non-query for sql type, as shown in the figure below:
+ <p align="center">
+ <img src="/img/sql-en.png" width="80%" />
+</p>
+
+- Query SQL function: Edit and query SQL task information, sql type selection query, select form or attachment to send mail to the specified recipient, as shown in the figure below.
+
+<p align="center">
+ <img src="/img/sql-node-en.png" width="80%" />
+ </p>
+
+- Data source: select the corresponding data source
+- sql type: supports query and non-query. The query is a select type query, which is returned with a result set. You can specify three templates for email notification as form, attachment or form attachment. Non-queries are returned without a result set, and are for three types of operations: update, delete, and insert.
+- sql parameter: the input parameter format is key1=value1;key2=value2...
+- sql statement: SQL statement
+- UDF function: For data sources of type HIVE, you can refer to UDF functions created in the resource center. UDF functions are not supported for other types of data sources.
+- Custom parameters: SQL task type, and stored procedure is a custom parameter order to set values for the method. The custom parameter type and data type are the same as the stored procedure task type. The difference is that the SQL task type custom parameter will replace the \${variable} in the SQL statement.
Review comment:
```suggestion
- Custom parameters: SQL task type, and stored procedure is a custom parameter order to set values for the method. The custom parameter type and data type are the same as the stored procedure task type. The difference is that the SQL task type custom parameter will replace the \${variable} in the SQL statement. 语句不通顺哈,中文版也有这个问题
```
##########
File path: docs/en-us/1.3.2/user_doc/system-manual.md
##########
@@ -0,0 +1,886 @@
+# System User Manual
+
+## Get started quickly
+
+> Please refer to [Quick Start](quick-start.html)
+
+## Operation guide
+
+### 1. Home
+
+The home page contains task status statistics, process status statistics, and workflow definition statistics for all projects of the user.
+
+<p align="center">
+<img src="/img/home_en.png" width="80%" />
+</p>
+
+### 2. Project management
+
+#### 2.1 Create project
+
+- Click "Project Management" to enter the project management page, click the "Create Project" button, enter the project name, project description, and click "Submit" to create a new project.
+
+ <p align="center">
+ <img src="/img/create_project_en1.png" width="80%" />
+ </p>
+
+#### 2.2 Project home
+
+- Click the project name link on the project management page to enter the project home page, as shown in the figure below, the project home page contains the task status statistics, process status statistics, and workflow definition statistics of the project.
+ <p align="center">
+ <img src="/img/project_home_en.png" width="80%" />
+ </p>
+
+- Task status statistics: within the specified time range, count the number of task instances as successful submission, running, ready to pause, pause, ready to stop, stop, failure, success, fault tolerance, kill, and waiting threads
+- Process status statistics: within the specified time range, count the number of the status of the workflow instance as submission success, running, ready to pause, pause, ready to stop, stop, failure, success, fault tolerance, kill, and waiting threads
+- Workflow definition statistics: Count the workflow definitions created by this user and the workflow definitions granted to this user by the administrator
+
+#### 2.3 Workflow definition
+
+#### <span id=creatDag>2.3.1 Create workflow definition</span>
+
+- Click Project Management -> Workflow -> Workflow Definition to enter the workflow definition page, and click the "Create Workflow" button to enter the **workflow DAG edit** page, as shown in the following figure:
+ <p align="center">
+ <img src="/img/dag5.png" width="80%" />
+ </p>
+- Drag in the toolbar <img src="/img/shell.png" width="35"/> Add a Shell task to the drawing board, as shown in the figure below:
+ <p align="center">
+ <img src="/img/shell-en.png" width="80%" />
+ </p>
+- **Add parameter settings for this shell task:**
+
+1. Fill in the "Node Name", "Description", and "Script" fields;
+2. Check “Normal” for “Run Flag”. If “Prohibit Execution” is checked, the task will not be executed when the workflow runs;
+3. Select "Task Priority": When the number of worker threads is insufficient, high-level tasks will be executed first in the execution queue, and tasks with the same priority will be executed in the order of first in, first out;
+4. Timeout alarm (optional): Check the timeout alarm, timeout failure, and fill in the "timeout period". When the task execution time exceeds **timeout period**, an alert email will be sent and the task timeout fails;
+5. Resources (optional). Resource files are files created or uploaded on the Resource Center -> File Management page. For example, the file name is `test.sh`, and the command to call the resource in the script is `sh test.sh`;
+6. Custom parameters (optional), refer to [Custom Parameters](#UserDefinedParameters);
+7. Click the "Confirm Add" button to save the task settings.
+
+- **Increase the order of task execution:** Click the icon in the upper right corner <img src="/img/line.png" width="35"/> to connect the task; as shown in the figure below, task 2 and task 3 are executed in parallel, When task 1 finished execute, tasks 2 and 3 will be executed simultaneously.
+
+ <p align="center">
+ <img src="/img/dag6.png" width="80%" />
+ </p>
+
+- **Delete dependencies:** Click the "arrow" icon in the upper right corner <img src="/img/arrow.png" width="35"/>, select the connection line, and click the "Delete" icon in the upper right corner <img src= "/img/delete.png" width="35"/>, delete dependencies between tasks.
+ <p align="center">
+ <img src="/img/dag7.png" width="80%" />
+ </p>
+
+- **Save workflow definition:** Click the "Save" button, and the "Set DAG chart name" pop-up box will pop up, as shown in the figure below. Enter the workflow definition name, workflow definition description, and set global parameters (optional, refer to [ Custom parameters](#UserDefinedParameters)), click the "Add" button, and the workflow definition is created successfully.
+ <p align="center">
+ <img src="/img/dag8.png" width="80%" />
+ </p>
+> For other types of tasks, please refer to [Task Node Type and Parameter Settings](#TaskParamers).
+
+#### 2.3.2 Workflow definition operation function
+
+Click Project Management -> Workflow -> Workflow Definition to enter the workflow definition page, as shown below:
+
+<p align="center">
+<img src="/img/work_list_en.png" width="80%" />
+</p>
+The operation functions of the workflow definition list are as follows:
+
+- **Edit:** Only "offline" workflow definitions can be edited. Workflow DAG editing is the same as [Create Workflow Definition](#creatDag).
+- **Online:** When the workflow status is "Offline", used to online workflow. Only the workflow in the "Online" state can run, but cannot be edited.
+- **Offline:** When the workflow status is "Online", used to offline workflow. Only the workflow in the "Offline" state can be edited, but not run.
+- **Run:** Only workflow in the online state can run. See [2.3.3 Run Workflow](#runWorkflow) for the operation steps
+- **Timing:** Timing can only be set in online workflows, and the system automatically schedules the workflow to run on a regular basis. The status after creating a timing is "offline", and the timing must be online on the timing management page to take effect. See [2.3.4 Workflow Timing](#creatTiming) for timing operation steps.
+- **Timing Management:** The timing management page can be edited, online/offline, and deleted.
+- **Delete:** Delete the workflow definition.
+- **Download:** Download workflow definition to local.
+- **Tree Diagram:** Display the task node type and task status in a tree structure, as shown in the figure below:
+ <p align="center">
+ <img src="/img/tree_en.png" width="80%" />
+ </p>
+
+#### <span id=runWorkflow>2.3.3 Run the workflow</span>
+
+- Click Project Management -> Workflow -> Workflow Definition to enter the workflow definition page, as shown in the figure below, click the "Go Online" button <img src="/img/online.png" width="35"/>,Go online workflow.
+ <p align="center">
+ <img src="/img/work_list_en.png" width="80%" />
+ </p>
+
+- Click the "Run" button to pop up the startup parameter setting pop-up box, as shown in the figure below, set the startup parameters, click the "Run" button in the pop-up box, the workflow starts running, and the workflow instance page generates a workflow instance.
+ <p align="center">
+ <img src="/img/run_work_en.png" width="80%" />
+ </p>
+ <span id=runParamers>Description of workflow operating parameters:</span>
+
+ * Failure strategy: When a task node fails to execute, other parallel task nodes need to execute the strategy. "Continue" means: after a certain task fails, other task nodes execute normally; "End" means: terminate all tasks being executed, and terminate the entire process.
+ * Notification strategy: When the process is over, the process execution information notification email is sent according to the process status, including any status is not sent, successful sent, failed sent, successful or failed sent.
+ * Process priority: The priority of process operation, divided into five levels: highest (HIGHEST), high (HIGH), medium (MEDIUM), low (LOW), and lowest (LOWEST). When the number of master threads is insufficient, high-level processes will be executed first in the execution queue, and processes with the same priority will be executed in a first-in first-out order.
+ * Worker group: The process can only be executed in the specified worker machine group. The default is Default, which can be executed on any worker.
+ * Notification group: select notification strategy||timeout alarm||when fault tolerance occurs, process information or email will be sent to all members in the notification group.
+ * Recipient: Select notification policy||Timeout alarm||When fault tolerance occurs, process information or alarm email will be sent to the recipient list.
+ * Cc: Select the notification strategy||Timeout alarm||When fault tolerance occurs, the process information or warning email will be copied to the CC list.
+ * Complement: Two modes including serial complement and parallel complement. Serial complement: within the specified time range, the complement is executed sequentially from the start date to the end date, and only one process instance is generated; parallel complement: within the specified time range, multiple days are complemented at the same time to generate N process instances.
+ * For example, you need to fill in the data from May 1 to May 10.
+
+ <p align="center">
+ <img src="/img/complement_en1.png" width="80%" />
+ </p>
+
+ > Serial mode: The complement is executed sequentially from May 1 to May 10, and a process instance is generated on the process instance page;
+
+ > Parallel mode: The tasks from May 1 to may 10 are executed simultaneously, and 10 process instances are generated on the process instance page.
+
+#### <span id=creatTiming>2.3.4 Workflow timing</span>
+
+- Create timing: Click Project Management->Workflow->Workflow Definition, enter the workflow definition page, go online the workflow, click the "timing" button <img src="/img/timing.png" width="35"/> ,The timing parameter setting dialog box pops up, as shown in the figure below:
+ <p align="center">
+ <img src="/img/time_schedule_en.png" width="80%" />
+ </p>
+- Choose the start and end time. In the start and end time range, the workflow is run at regular intervals; not in the start and end time range, no more regular workflow instances are generated.
+- Add a timing that is executed once every day at 5 AM, as shown in the following figure:
+ <p align="center">
+ <img src="/img/timer-en.png" width="80%" />
+ </p>
+- Failure strategy, notification strategy, process priority, worker group, notification group, recipient, and CC are the same as [workflow running parameters](#runParamers).
+- Click the "Create" button to create the timing successfully. At this time, the timing status is "**Offline**" and the timing needs to be **Online** to take effect.
+- Timing online: Click the "timing management" button <img src="/img/timeManagement.png" width="35"/>, enter the timing management page, click the "online" button, the timing status will change to "online", as shown in the below figure, the workflow takes effect regularly.
+ <p align="center">
+ <img src="/img/time-manage-list-en.png" width="80%" />
+ </p>
+
+#### 2.3.5 Import workflow
+
+Click Project Management -> Workflow -> Workflow Definition to enter the workflow definition page, click the "Import Workflow" button to import the local workflow file, the workflow definition list displays the imported workflow, and the status is offline.
+
+#### 2.4 Workflow instance
+
+#### 2.4.1 View workflow instance
+
+- Click Project Management -> Workflow -> Workflow Instance to enter the Workflow Instance page, as shown in the figure below:
+ <p align="center">
+ <img src="/img/instance-list-en.png" width="80%" />
+ </p>
+- Click the workflow name to enter the DAG view page to view the task execution status, as shown in the figure below.
+ <p align="center">
+ <img src="/img/instance-runs-en.png" width="80%" />
+ </p>
+
+#### 2.4.2 View task log
+
+- Enter the workflow instance page, click the workflow name, enter the DAG view page, double-click the task node, as shown in the following figure:
+ <p align="center">
+ <img src="/img/instanceViewLog-en.png" width="80%" />
+ </p>
+- Click "View Log", a log pop-up box will pop up, as shown in the figure below, the task log can also be viewed on the task instance page, refer to [Task View Log](#taskLog)。
+ <p align="center">
+ <img src="/img/task-log-en.png" width="80%" />
+ </p>
+
+#### 2.4.3 View task history
+
+- Click Project Management -> Workflow -> Workflow Instance to enter the workflow instance page, and click the workflow name to enter the workflow DAG page;
+- Double-click the task node, as shown in the figure below, click "View History" to jump to the task instance page, and display a list of task instances running by the workflow instance
+ <p align="center">
+ <img src="/img/task_history_en.png" width="80%" />
+ </p>
+
+#### 2.4.4 View operating parameters
+
+- Click Project Management -> Workflow -> Workflow Instance to enter the workflow instance page, and click the workflow name to enter the workflow DAG page;
+- Click the icon in the upper left corner <img src="/img/run_params_button.png" width="35"/>,View the startup parameters of the workflow instance; click the icon <img src="/img/global_param.png" width="35"/>,View the global and local parameters of the workflow instance, as shown in the following figure:
+ <p align="center">
+ <img src="/img/run_params_en.png" width="80%" />
+ </p>
+
+#### 2.4.4 Workflow instance operation function
+
+Click Project Management -> Workflow -> Workflow Instance to enter the Workflow Instance page, as shown in the figure below:
+
+ <p align="center">
+ <img src="/img/instance-list-en.png" width="80%" />
+ </p>
+
+- **Edit:** Only terminated processes can be edited. Click the "Edit" button or the name of the workflow instance to enter the DAG edit page. After edit, click the "Save" button to pop up the Save DAG pop-up box, as shown in the figure below. In the pop-up box, check "Whether to update to workflow definition" and save After that, the workflow definition will be updated; if it is not checked, the workflow definition will not be updated.
+ <p align="center">
+ <img src="/img/editDag-en.png" width="80%" />
+ </p>
+- **Rerun:** Re-execute the terminated process.
+- **Recovery failed:** For failed processes, you can perform recovery operations, starting from the failed node.
+- **Stop:** To **stop** the running process, the background will first `kill`worker process, and then execute `kill -9` operation
+- **Pause:** Perform a **pause** operation on the running process, the system status will change to **waiting for execution**, it will wait for the end of the task being executed, and pause the next task to be executed.
+- **Resume pause:** To resume the paused process, start running directly from the **paused node**
+- **Delete:** Delete the workflow instance and the task instance under the workflow instance
+- **Gantt chart:** The vertical axis of the Gantt chart is the topological sorting of task instances under a certain workflow instance, and the horizontal axis is the running time of the task instances, as shown in the figure:
+ <p align="center">
+ <img src="/img/gantt-en.png" width="80%" />
+ </p>
+
+#### 2.5 Task instance
+
+- Click Project Management -> Workflow -> Task Instance to enter the task instance page, as shown in the figure below, click the name of the workflow instance, you can jump to the workflow instance DAG chart to view the task status.
+ <p align="center">
+ <img src="/img/task-list-en.png" width="80%" />
+ </p>
+
+- <span id=taskLog>View log:</span>Click the "view log" button in the operation column to view the log of task execution.
+ <p align="center">
+ <img src="/img/task-log2-en.png" width="80%" />
+ </p>
+
+### 3. Resource Center
+
+#### 3.1 hdfs resource configuration
+
+- Upload resource files and udf functions, all uploaded files and resources will be stored on hdfs, so the following configuration items are required:
+
+```
+
+conf/common/common.properties
+ # Users who have permission to create directories under the HDFS root path
+ hdfs.root.user=hdfs
+ # data base dir, resource file will store to this hadoop hdfs path, self configuration, please make sure the directory exists on hdfs and have read write permissions。"/escheduler" is recommended
+ data.store2hdfs.basepath=/dolphinscheduler
+ # resource upload startup type : HDFS,S3,NONE
+ res.upload.startup.type=HDFS
+ # whether kerberos starts
+ hadoop.security.authentication.startup.state=false
+ # java.security.krb5.conf path
+ java.security.krb5.conf.path=/opt/krb5.conf
+ # loginUserFromKeytab user
+ login.user.keytab.username=hdfs-mycluster@ESZ.COM
+ # loginUserFromKeytab path
+ login.user.keytab.path=/opt/hdfs.headless.keytab
+
+conf/common/hadoop.properties
+ # ha or single namenode,If namenode ha needs to copy core-site.xml and hdfs-site.xml
+ # to the conf directory,support s3,for example : s3a://dolphinscheduler
+ fs.defaultFS=hdfs://mycluster:8020
+ #resourcemanager ha note this need ips , this empty if single
+ yarn.resourcemanager.ha.rm.ids=192.168.xx.xx,192.168.xx.xx
+ # If it is a single resourcemanager, you only need to configure one host name. If it is resourcemanager HA, the default configuration is fine
+ yarn.application.status.address=http://xxxx:8088/ws/v1/cluster/apps/%s
+
+```
+
+- Only one address needs to be configured for yarn.resourcemanager.ha.rm.ids and yarn.application.status.address, and the other address is empty.
+- You need to copy core-site.xml and hdfs-site.xml from the conf directory of the Hadoop cluster to the conf directory of the dolphinscheduler project, and restart the api-server service.
+
+#### 3.2 File management
+
+> It is the management of various resource files, including creating basic txt/log/sh/conf/py/java and other files, uploading jar packages and other types of files, and can do edit, rename, download, delete and other operations.
+
+ <p align="center">
+ <img src="/img/file-manage-en.png" width="80%" />
+ </p>
+
+- Create a file
+ > The file format supports the following types: txt, log, sh, conf, cfg, py, java, sql, xml, hql, properties
+
+<p align="center">
+ <img src="/img/file_create_en.png" width="80%" />
+ </p>
+
+- upload files
+
+> Upload file: Click the "Upload File" button to upload, drag the file to the upload area, the file name will be automatically completed with the uploaded file name
+
+<p align="center">
+ <img src="/img/file-upload-en.png" width="80%" />
+ </p>
+
+- File View
+
+> For the file types that can be viewed, click the file name to view the file details
+
+<p align="center">
+ <img src="/img/file_detail_en.png" width="80%" />
+ </p>
+
+- download file
+
+> Click the "Download" button in the file list to download the file or click the "Download" button in the upper right corner of the file details to download the file
+
+- File rename
+
+<p align="center">
+ <img src="/img/file_rename_en.png" width="80%" />
+ </p>
+
+- delete
+ > File list -> Click the "Delete" button to delete the specified file
+
+#### 3.3 UDF management
+
+#### 3.3.1 Resource management
+
+> The resource management and file management functions are similar. The difference is that the resource management is the uploaded UDF function, and the file management uploads the user program, script and configuration file.
+> Operation function: rename, download, delete.
+
+- Upload udf resources
+ > Same as uploading files.
+
+#### 3.3.2 Function management
+
+- Create UDF function
+ > Click "Create UDF Function", enter the udf function parameters, select the udf resource, and click "Submit" to create the udf function.
+
+> Currently only supports temporary UDF functions of HIVE
+
+- UDF function name: the name when the UDF function is entered
+- Package name Class name: Enter the full path of the UDF function
+- UDF resource: Set the resource file corresponding to the created UDF
+
+<p align="center">
+ <img src="/img/udf_edit_en.png" width="80%" />
+ </p>
+
+### 4. Create data source
+
+> Data source center supports MySQL, POSTGRESQL, HIVE/IMPALA, SPARK, CLICKHOUSE, ORACLE, SQLSERVER and other data sources
+
+#### 4.1 Create/Edit MySQL data source
+
+- Click "Data Source Center -> Create Data Source" to create different types of data sources according to requirements.
+
+- Data source: select MYSQL
+- Data source name: enter the name of the data source
+- Description: Enter a description of the data source
+- IP hostname: enter the IP to connect to MySQL
+- Port: Enter the port to connect to MySQL
+- Username: Set the username for connecting to MySQL
+- Password: Set the password for connecting to MySQL
+- Database name: Enter the name of the database connected to MySQL
+- Jdbc connection parameters: parameter settings for MySQL connection, filled in in JSON form
+
+<p align="center">
+ <img src="/img/mysql-en.png" width="80%" />
+ </p>
+
+> Click "Test Connection" to test whether the data source can be successfully connected.
+
+#### 4.2 Create/Edit POSTGRESQL data source
+
+- Data source: select POSTGRESQL
+- Data source name: enter the name of the data source
+- Description: Enter a description of the data source
+- IP/Host Name: Enter the IP to connect to POSTGRESQL
+- Port: Enter the port to connect to POSTGRESQL
+- Username: Set the username for connecting to POSTGRESQL
+- Password: Set the password for connecting to POSTGRESQL
+- Database name: Enter the name of the database connected to POSTGRESQL
+- Jdbc connection parameters: parameter settings for POSTGRESQL connection, filled in in JSON form
+
+<p align="center">
+ <img src="/img/postgresql-en.png" width="80%" />
+ </p>
+
+#### 4.3 Create/Edit HIVE data source
+
+1.Use HiveServer2 to connect
+
+ <p align="center">
+ <img src="/img/hive-en.png" width="80%" />
+ </p>
+
+- Data source: select HIVE
+- Data source name: enter the name of the data source
+- Description: Enter a description of the data source
+- IP/Host Name: Enter the IP connected to HIVE
+- Port: Enter the port connected to HIVE
+- Username: Set the username for connecting to HIVE
+- Password: Set the password for connecting to HIVE
+- Database name: Enter the name of the database connected to HIVE
+- Jdbc connection parameters: parameter settings for HIVE connection, filled in in JSON form
+
+ 2.Use HiveServer2 HA Zookeeper to connect
+
+ <p align="center">
+ <img src="/img/hive1-en.png" width="80%" />
+ </p>
+
+Note: If you enable **kerberos**, you need to fill in **Principal**
+
+<p align="center">
+ <img src="/img/hive-en.png" width="80%" />
+ </p>
+
+#### 4.4 Create/Edit Spark data source
+
+<p align="center">
+ <img src="/img/spark-en.png" width="80%" />
+ </p>
+
+- Data source: select Spark
+- Data source name: enter the name of the data source
+- Description: Enter a description of the data source
+- IP/Hostname: Enter the IP connected to Spark
+- Port: Enter the port connected to Spark
+- Username: Set the username for connecting to Spark
+- Password: Set the password for connecting to Spark
+- Database name: Enter the name of the database connected to Spark
+- Jdbc connection parameters: parameter settings for Spark connection, filled in in JSON form
+
+### 5. Security Center (Permission System)
+
+ * Only the administrator account in the security center has the authority to operate. It has functions such as queue management, tenant management, user management, alarm group management, worker group management, token management, etc. In the user management module, resources, data sources, projects, etc. Authorization
+ * Administrator login, default user name and password: admin/dolphinscheduler123
+
+#### 5.1 Create queue
+
+- Queue is used when the "queue" parameter is needed to execute programs such as spark and mapreduce.
+- The administrator enters the Security Center->Queue Management page and clicks the "Create Queue" button to create a queue.
+<p align="center">
+ <img src="/img/create-queue-en.png" width="80%" />
+ </p>
+
+#### 5.2 Add tenant
+
+- The tenant corresponds to the Linux user, which is used by the worker to submit the job. If Linux does not have this user, the worker will create this user when executing the script.
+- Tenant Code: **Tenant Code is the only user on Linux and cannot be repeated**
+- The administrator enters the Security Center->Tenant Management page and clicks the "Create Tenant" button to create a tenant.
+
+ <p align="center">
+ <img src="/img/addtenant-en.png" width="80%" />
+ </p>
+
+#### 5.3 Create normal user
+
+- Users are divided into **administrator users** and **normal users**
+
+ - The administrator has authorization and user management authority, but does not have the authority to create project and workflow definition operations.
+ - Ordinary users can create projects and create, edit, and execute workflow definitions.
+ - Note: If the user switches tenants, all resources under the tenant where the user belongs will be copied to the new tenant that is switched.
+
+- The administrator enters the Security Center -> User Management page and clicks the "Create User" button to create a user.
+<p align="center">
+ <img src="/img/user-en.png" width="80%" />
+ </p>
+
+> **Edit user information**
+
+- The administrator enters the Security Center->User Management page and clicks the "Edit" button to edit user information.
+- After an ordinary user logs in, click the user information in the user name drop-down box to enter the user information page, and click the "Edit" button to edit the user information.
+
+> **Modify user password**
+
+- The administrator enters the Security Center->User Management page and clicks the "Edit" button. When editing user information, enter the new password to modify the user password.
+- After a normal user logs in, click the user information in the user name drop-down box to enter the password modification page, enter the password and confirm the password and click the "Edit" button, then the password modification is successful.
+
+#### 5.4 Create alarm group
+
+- The alarm group is a parameter set at startup. After the process ends, the status of the process and other information will be sent to the alarm group in the form of email.
+
+* The administrator enters the Security Center -> Alarm Group Management page and clicks the "Create Alarm Group" button to create an alarm group.
+
+ <p align="center">
+ <img src="/img/mail-en.png" width="80%" />
+
+#### 5.5 Token management
+
+> Since the back-end interface has login check, token management provides a way to perform various operations on the system by calling the interface.
+
+- The administrator enters the Security Center -> Token Management page, clicks the "Create Token" button, selects the expiration time and user, clicks the "Generate Token" button, and clicks the "Submit" button, then the selected user's token is created successfully.
+
+ <p align="center">
+ <img src="/img/create-token-en.png" width="80%" />
+ </p>
+
+ - After an ordinary user logs in, click the user information in the user name drop-down box, enter the token management page, select the expiration time, click the "generate token" button, and click the "submit" button, then the user creates a token successfully.
+ - Call example:
+
+```
+Token call example
+ /**
+ * test token
+ */
+ public void doPOSTParam()throws Exception{
+ // create HttpClient
+ CloseableHttpClient httpclient = HttpClients.createDefault();
+
+ // create http post request
+ HttpPost httpPost = new HttpPost("http://127.0.0.1:12345/escheduler/projects/create");
+ httpPost.setHeader("token", "123");
+ // set parameters
+ List<NameValuePair> parameters = new ArrayList<NameValuePair>();
+ parameters.add(new BasicNameValuePair("projectName", "qzw"));
+ parameters.add(new BasicNameValuePair("desc", "qzw"));
+ UrlEncodedFormEntity formEntity = new UrlEncodedFormEntity(parameters);
+ httpPost.setEntity(formEntity);
+ CloseableHttpResponse response = null;
+ try {
+ // execute
+ response = httpclient.execute(httpPost);
+ // response status code 200
+ if (response.getStatusLine().getStatusCode() == 200) {
+ String content = EntityUtils.toString(response.getEntity(), "UTF-8");
+ System.out.println(content);
+ }
+ } finally {
+ if (response != null) {
+ response.close();
+ }
+ httpclient.close();
+ }
+ }
+```
+
+#### 5.6 Granted permission
+
+ * Granted permissions include project permissions, resource permissions, data source permissions, UDF function permissions.
+ * The administrator can authorize the projects, resources, data sources and UDF functions not created by ordinary users. Because the authorization methods for projects, resources, data sources and UDF functions are the same, we take project authorization as an example.
+ * Note: For projects created by users themselves, the user has all permissions. The project list and the selected project list will not be displayed.
+
+- The administrator enters the Security Center -> User Management page and clicks the "Authorize" button of the user who needs to be authorized, as shown in the figure below:
+ <p align="center">
+ <img src="/img/auth-en.png" width="80%" />
+</p>
+
+- Select the project to authorize the project.
+
+<p align="center">
+ <img src="/img/authproject-en.png" width="80%" />
+ </p>
+
+- Resources, data sources, and UDF function authorization are the same as project authorization.
+
+### 6. monitoring Center
+
+#### 6.1 Service management
+
+- Service management is mainly to monitor and display the health status and basic information of each service in the system
+
+#### 6.1.1 master monitoring
+
+- Mainly related to master information.
+<p align="center">
+ <img src="/img/master-jk-en.png" width="80%" />
+ </p>
+
+#### 6.1.2 worker monitoring
+
+- Mainly related to worker information.
+
+<p align="center">
+ <img src="/img/worker-jk-en.png" width="80%" />
+ </p>
+
+#### 6.1.3 Zookeeper monitoring
+
+- Mainly related configuration information of each worker and master in zookpeeper.
+
+<p align="center">
+ <img src="/img/zookeeper-monitor-en.png" width="80%" />
+ </p>
+
+#### 6.1.4 DB monitoring
+
+- Mainly the health of the DB
+
+<p align="center">
+ <img src="/img/mysql-jk-en.png" width="80%" />
+ </p>
+
+#### 6.2 Statistics management
+
+<p align="center">
+ <img src="/img/statistics-en.png" width="80%" />
+ </p>
+
+- Number of commands to be executed: statistics on the t_ds_command table
+- The number of failed commands: statistics on the t_ds_error_command table
+- Number of tasks to run: Count the data of task_queue in Zookeeper
+- Number of tasks to be killed: Count the data of task_kill in Zookeeper
+
+### 7. <span id=TaskParamers>Task node type and parameter settings</span>
+
+#### 7.1 Shell node
+
+> Shell node, when the worker is executed, a temporary shell script is generated, and the linux user with the same name as the tenant executes the script.
+
+- Click Project Management-Project Name-Workflow Definition, and click the "Create Workflow" button to enter the DAG editing page.
+- Drag <img src="/img/shell.png" width="35"/> from the toolbar to the drawing board, as shown in the figure below:
+
+ <p align="center">
+ <img src="/img/shell-en.png" width="80%" />
+ </p>
+
+- Node name: The node name in a workflow definition is unique.
+- Run flag: Identifies whether this node can be scheduled normally, if it does not need to be executed, you can turn on the prohibition switch.
+- Descriptive information: describe the function of the node.
+- Task priority: When the number of worker threads is insufficient, they are executed in order from high to low, and when the priority is the same, they are executed according to the first-in first-out principle.
+- Worker grouping: Tasks are assigned to the machines of the worker group to execute. If Default is selected, a worker machine will be randomly selected for execution.
+- Number of failed retry attempts: The number of times the task failed to be resubmitted. It supports drop-down and hand-filling.
+- Failed retry interval: The time interval for resubmitting the task after a failed task. It supports drop-down and hand-filling.
+- Timeout alarm: Check the timeout alarm and timeout failure. When the task exceeds the "timeout period", an alarm email will be sent and the task execution will fail.
+- Script: SHELL program developed by users.
+- Resource: Refers to the list of resource files that need to be called in the script, and the files uploaded or created by the resource center-file management.
+- User-defined parameters: It is a user-defined parameter that is part of SHELL, which will replace the content with \${variable} in the script.
+
+#### 7.2 Sub-process node
+
+- The sub-process node is to execute a certain external workflow definition as a task node.
+ > Drag the  task node in the toolbar to the drawing board, as shown in the following figure:
+
+<p align="center">
+ <img src="/img/sub-process-en.png" width="80%" />
+ </p>
+
+- Node name: The node name in a workflow definition is unique
+- Run flag: identify whether this node can be scheduled normally
+- Descriptive information: describe the function of the node
+- Timeout alarm: Check the timeout alarm and timeout failure. When the task exceeds the "timeout period", an alarm email will be sent and the task execution will fail.
+- Sub-node: It is the workflow definition of the selected sub-process. Enter the sub-node in the upper right corner to jump to the workflow definition of the selected sub-process
+
+#### 7.3 DEPENDENT node
+
+- Dependent nodes are **dependency check nodes**. For example, process A depends on the successful execution of process B yesterday, and the dependent node will check whether process B has a successful execution yesterday.
+
+> Drag the  task node in the toolbar to the drawing board, as shown in the following figure:
+
+<p align="center">
+ <img src="/img/dependent-nodes-en.png" width="80%" />
+ </p>
+
+> The dependent node provides a logical judgment function, such as checking whether the B process was successful yesterday, or whether the C process was executed successfully.
+
+ <p align="center">
+ <img src="/img/depend-node-en.png" width="80%" />
+ </p>
+
+> For example, process A is a weekly report task, processes B and C are daily tasks, and task A requires tasks B and C to be successfully executed every day of the last week, as shown in the figure:
+
+ <p align="center">
+ <img src="/img/depend-node1-en.png" width="80%" />
+ </p>
+
+> If the weekly report A also needs to be executed successfully last Tuesday:
Review comment:
```suggestion
> For example, the weekly report A also needs to be executed successfully last Tuesday:
```
##########
File path: docs/en-us/1.3.2/user_doc/system-manual.md
##########
@@ -0,0 +1,886 @@
+# System User Manual
+
+## Get started quickly
+
+> Please refer to [Quick Start](quick-start.html)
+
+## Operation guide
+
+### 1. Home
+
+The home page contains task status statistics, process status statistics, and workflow definition statistics for all projects of the user.
+
+<p align="center">
+<img src="/img/home_en.png" width="80%" />
+</p>
+
+### 2. Project management
+
+#### 2.1 Create project
+
+- Click "Project Management" to enter the project management page, click the "Create Project" button, enter the project name, project description, and click "Submit" to create a new project.
+
+ <p align="center">
+ <img src="/img/create_project_en1.png" width="80%" />
+ </p>
+
+#### 2.2 Project home
+
+- Click the project name link on the project management page to enter the project home page, as shown in the figure below, the project home page contains the task status statistics, process status statistics, and workflow definition statistics of the project.
+ <p align="center">
+ <img src="/img/project_home_en.png" width="80%" />
+ </p>
+
+- Task status statistics: within the specified time range, count the number of task instances as successful submission, running, ready to pause, pause, ready to stop, stop, failure, success, fault tolerance, kill, and waiting threads
+- Process status statistics: within the specified time range, count the number of the status of the workflow instance as submission success, running, ready to pause, pause, ready to stop, stop, failure, success, fault tolerance, kill, and waiting threads
+- Workflow definition statistics: Count the workflow definitions created by this user and the workflow definitions granted to this user by the administrator
+
+#### 2.3 Workflow definition
+
+#### <span id=creatDag>2.3.1 Create workflow definition</span>
+
+- Click Project Management -> Workflow -> Workflow Definition to enter the workflow definition page, and click the "Create Workflow" button to enter the **workflow DAG edit** page, as shown in the following figure:
+ <p align="center">
+ <img src="/img/dag5.png" width="80%" />
+ </p>
+- Drag in the toolbar <img src="/img/shell.png" width="35"/> Add a Shell task to the drawing board, as shown in the figure below:
+ <p align="center">
+ <img src="/img/shell-en.png" width="80%" />
+ </p>
+- **Add parameter settings for this shell task:**
+
+1. Fill in the "Node Name", "Description", and "Script" fields;
+2. Check “Normal” for “Run Flag”. If “Prohibit Execution” is checked, the task will not be executed when the workflow runs;
+3. Select "Task Priority": When the number of worker threads is insufficient, high-level tasks will be executed first in the execution queue, and tasks with the same priority will be executed in the order of first in, first out;
+4. Timeout alarm (optional): Check the timeout alarm, timeout failure, and fill in the "timeout period". When the task execution time exceeds **timeout period**, an alert email will be sent and the task timeout fails;
+5. Resources (optional). Resource files are files created or uploaded on the Resource Center -> File Management page. For example, the file name is `test.sh`, and the command to call the resource in the script is `sh test.sh`;
+6. Custom parameters (optional), refer to [Custom Parameters](#UserDefinedParameters);
+7. Click the "Confirm Add" button to save the task settings.
+
+- **Increase the order of task execution:** Click the icon in the upper right corner <img src="/img/line.png" width="35"/> to connect the task; as shown in the figure below, task 2 and task 3 are executed in parallel, When task 1 finished execute, tasks 2 and 3 will be executed simultaneously.
+
+ <p align="center">
+ <img src="/img/dag6.png" width="80%" />
+ </p>
+
+- **Delete dependencies:** Click the "arrow" icon in the upper right corner <img src="/img/arrow.png" width="35"/>, select the connection line, and click the "Delete" icon in the upper right corner <img src= "/img/delete.png" width="35"/>, delete dependencies between tasks.
+ <p align="center">
+ <img src="/img/dag7.png" width="80%" />
+ </p>
+
+- **Save workflow definition:** Click the "Save" button, and the "Set DAG chart name" pop-up box will pop up, as shown in the figure below. Enter the workflow definition name, workflow definition description, and set global parameters (optional, refer to [ Custom parameters](#UserDefinedParameters)), click the "Add" button, and the workflow definition is created successfully.
+ <p align="center">
+ <img src="/img/dag8.png" width="80%" />
+ </p>
+> For other types of tasks, please refer to [Task Node Type and Parameter Settings](#TaskParamers).
+
+#### 2.3.2 Workflow definition operation function
+
+Click Project Management -> Workflow -> Workflow Definition to enter the workflow definition page, as shown below:
+
+<p align="center">
+<img src="/img/work_list_en.png" width="80%" />
+</p>
+The operation functions of the workflow definition list are as follows:
+
+- **Edit:** Only "offline" workflow definitions can be edited. Workflow DAG editing is the same as [Create Workflow Definition](#creatDag).
+- **Online:** When the workflow status is "Offline", used to online workflow. Only the workflow in the "Online" state can run, but cannot be edited.
+- **Offline:** When the workflow status is "Online", used to offline workflow. Only the workflow in the "Offline" state can be edited, but not run.
+- **Run:** Only workflow in the online state can run. See [2.3.3 Run Workflow](#runWorkflow) for the operation steps
+- **Timing:** Timing can only be set in online workflows, and the system automatically schedules the workflow to run on a regular basis. The status after creating a timing is "offline", and the timing must be online on the timing management page to take effect. See [2.3.4 Workflow Timing](#creatTiming) for timing operation steps.
+- **Timing Management:** The timing management page can be edited, online/offline, and deleted.
+- **Delete:** Delete the workflow definition.
+- **Download:** Download workflow definition to local.
+- **Tree Diagram:** Display the task node type and task status in a tree structure, as shown in the figure below:
+ <p align="center">
+ <img src="/img/tree_en.png" width="80%" />
+ </p>
+
+#### <span id=runWorkflow>2.3.3 Run the workflow</span>
+
+- Click Project Management -> Workflow -> Workflow Definition to enter the workflow definition page, as shown in the figure below, click the "Go Online" button <img src="/img/online.png" width="35"/>,Go online workflow.
+ <p align="center">
+ <img src="/img/work_list_en.png" width="80%" />
+ </p>
+
+- Click the "Run" button to pop up the startup parameter setting pop-up box, as shown in the figure below, set the startup parameters, click the "Run" button in the pop-up box, the workflow starts running, and the workflow instance page generates a workflow instance.
+ <p align="center">
+ <img src="/img/run_work_en.png" width="80%" />
+ </p>
+ <span id=runParamers>Description of workflow operating parameters:</span>
+
+ * Failure strategy: When a task node fails to execute, other parallel task nodes need to execute the strategy. "Continue" means: after a certain task fails, other task nodes execute normally; "End" means: terminate all tasks being executed, and terminate the entire process.
+ * Notification strategy: When the process is over, the process execution information notification email is sent according to the process status, including any status is not sent, successful sent, failed sent, successful or failed sent.
+ * Process priority: The priority of process operation, divided into five levels: highest (HIGHEST), high (HIGH), medium (MEDIUM), low (LOW), and lowest (LOWEST). When the number of master threads is insufficient, high-level processes will be executed first in the execution queue, and processes with the same priority will be executed in a first-in first-out order.
+ * Worker group: The process can only be executed in the specified worker machine group. The default is Default, which can be executed on any worker.
+ * Notification group: select notification strategy||timeout alarm||when fault tolerance occurs, process information or email will be sent to all members in the notification group.
+ * Recipient: Select notification policy||Timeout alarm||When fault tolerance occurs, process information or alarm email will be sent to the recipient list.
+ * Cc: Select the notification strategy||Timeout alarm||When fault tolerance occurs, the process information or warning email will be copied to the CC list.
+ * Complement: Two modes including serial complement and parallel complement. Serial complement: within the specified time range, the complement is executed sequentially from the start date to the end date, and only one process instance is generated; parallel complement: within the specified time range, multiple days are complemented at the same time to generate N process instances.
+ * For example, you need to fill in the data from May 1 to May 10.
+
+ <p align="center">
+ <img src="/img/complement_en1.png" width="80%" />
+ </p>
+
+ > Serial mode: The complement is executed sequentially from May 1 to May 10, and a process instance is generated on the process instance page;
+
+ > Parallel mode: The tasks from May 1 to may 10 are executed simultaneously, and 10 process instances are generated on the process instance page.
+
+#### <span id=creatTiming>2.3.4 Workflow timing</span>
+
+- Create timing: Click Project Management->Workflow->Workflow Definition, enter the workflow definition page, go online the workflow, click the "timing" button <img src="/img/timing.png" width="35"/> ,The timing parameter setting dialog box pops up, as shown in the figure below:
+ <p align="center">
+ <img src="/img/time_schedule_en.png" width="80%" />
+ </p>
+- Choose the start and end time. In the start and end time range, the workflow is run at regular intervals; not in the start and end time range, no more regular workflow instances are generated.
+- Add a timing that is executed once every day at 5 AM, as shown in the following figure:
+ <p align="center">
+ <img src="/img/timer-en.png" width="80%" />
+ </p>
+- Failure strategy, notification strategy, process priority, worker group, notification group, recipient, and CC are the same as [workflow running parameters](#runParamers).
+- Click the "Create" button to create the timing successfully. At this time, the timing status is "**Offline**" and the timing needs to be **Online** to take effect.
+- Timing online: Click the "timing management" button <img src="/img/timeManagement.png" width="35"/>, enter the timing management page, click the "online" button, the timing status will change to "online", as shown in the below figure, the workflow takes effect regularly.
+ <p align="center">
+ <img src="/img/time-manage-list-en.png" width="80%" />
+ </p>
+
+#### 2.3.5 Import workflow
+
+Click Project Management -> Workflow -> Workflow Definition to enter the workflow definition page, click the "Import Workflow" button to import the local workflow file, the workflow definition list displays the imported workflow, and the status is offline.
+
+#### 2.4 Workflow instance
+
+#### 2.4.1 View workflow instance
+
+- Click Project Management -> Workflow -> Workflow Instance to enter the Workflow Instance page, as shown in the figure below:
+ <p align="center">
+ <img src="/img/instance-list-en.png" width="80%" />
+ </p>
+- Click the workflow name to enter the DAG view page to view the task execution status, as shown in the figure below.
+ <p align="center">
+ <img src="/img/instance-runs-en.png" width="80%" />
+ </p>
+
+#### 2.4.2 View task log
+
+- Enter the workflow instance page, click the workflow name, enter the DAG view page, double-click the task node, as shown in the following figure:
+ <p align="center">
+ <img src="/img/instanceViewLog-en.png" width="80%" />
+ </p>
+- Click "View Log", a log pop-up box will pop up, as shown in the figure below, the task log can also be viewed on the task instance page, refer to [Task View Log](#taskLog)。
+ <p align="center">
+ <img src="/img/task-log-en.png" width="80%" />
+ </p>
+
+#### 2.4.3 View task history
+
+- Click Project Management -> Workflow -> Workflow Instance to enter the workflow instance page, and click the workflow name to enter the workflow DAG page;
+- Double-click the task node, as shown in the figure below, click "View History" to jump to the task instance page, and display a list of task instances running by the workflow instance
+ <p align="center">
+ <img src="/img/task_history_en.png" width="80%" />
+ </p>
+
+#### 2.4.4 View operating parameters
+
+- Click Project Management -> Workflow -> Workflow Instance to enter the workflow instance page, and click the workflow name to enter the workflow DAG page;
+- Click the icon in the upper left corner <img src="/img/run_params_button.png" width="35"/>,View the startup parameters of the workflow instance; click the icon <img src="/img/global_param.png" width="35"/>,View the global and local parameters of the workflow instance, as shown in the following figure:
+ <p align="center">
+ <img src="/img/run_params_en.png" width="80%" />
+ </p>
+
+#### 2.4.4 Workflow instance operation function
+
+Click Project Management -> Workflow -> Workflow Instance to enter the Workflow Instance page, as shown in the figure below:
+
+ <p align="center">
+ <img src="/img/instance-list-en.png" width="80%" />
+ </p>
+
+- **Edit:** Only terminated processes can be edited. Click the "Edit" button or the name of the workflow instance to enter the DAG edit page. After edit, click the "Save" button to pop up the Save DAG pop-up box, as shown in the figure below. In the pop-up box, check "Whether to update to workflow definition" and save After that, the workflow definition will be updated; if it is not checked, the workflow definition will not be updated.
+ <p align="center">
+ <img src="/img/editDag-en.png" width="80%" />
+ </p>
+- **Rerun:** Re-execute the terminated process.
+- **Recovery failed:** For failed processes, you can perform recovery operations, starting from the failed node.
+- **Stop:** To **stop** the running process, the background will first `kill`worker process, and then execute `kill -9` operation
+- **Pause:** Perform a **pause** operation on the running process, the system status will change to **waiting for execution**, it will wait for the end of the task being executed, and pause the next task to be executed.
+- **Resume pause:** To resume the paused process, start running directly from the **paused node**
+- **Delete:** Delete the workflow instance and the task instance under the workflow instance
+- **Gantt chart:** The vertical axis of the Gantt chart is the topological sorting of task instances under a certain workflow instance, and the horizontal axis is the running time of the task instances, as shown in the figure:
+ <p align="center">
+ <img src="/img/gantt-en.png" width="80%" />
+ </p>
+
+#### 2.5 Task instance
+
+- Click Project Management -> Workflow -> Task Instance to enter the task instance page, as shown in the figure below, click the name of the workflow instance, you can jump to the workflow instance DAG chart to view the task status.
+ <p align="center">
+ <img src="/img/task-list-en.png" width="80%" />
+ </p>
+
+- <span id=taskLog>View log:</span>Click the "view log" button in the operation column to view the log of task execution.
+ <p align="center">
+ <img src="/img/task-log2-en.png" width="80%" />
+ </p>
+
+### 3. Resource Center
+
+#### 3.1 hdfs resource configuration
+
+- Upload resource files and udf functions, all uploaded files and resources will be stored on hdfs, so the following configuration items are required:
+
+```
+
+conf/common/common.properties
+ # Users who have permission to create directories under the HDFS root path
+ hdfs.root.user=hdfs
+ # data base dir, resource file will store to this hadoop hdfs path, self configuration, please make sure the directory exists on hdfs and have read write permissions。"/escheduler" is recommended
+ data.store2hdfs.basepath=/dolphinscheduler
+ # resource upload startup type : HDFS,S3,NONE
+ res.upload.startup.type=HDFS
+ # whether kerberos starts
+ hadoop.security.authentication.startup.state=false
+ # java.security.krb5.conf path
+ java.security.krb5.conf.path=/opt/krb5.conf
+ # loginUserFromKeytab user
+ login.user.keytab.username=hdfs-mycluster@ESZ.COM
+ # loginUserFromKeytab path
+ login.user.keytab.path=/opt/hdfs.headless.keytab
+
+conf/common/hadoop.properties
+ # ha or single namenode,If namenode ha needs to copy core-site.xml and hdfs-site.xml
+ # to the conf directory,support s3,for example : s3a://dolphinscheduler
+ fs.defaultFS=hdfs://mycluster:8020
+ #resourcemanager ha note this need ips , this empty if single
+ yarn.resourcemanager.ha.rm.ids=192.168.xx.xx,192.168.xx.xx
+ # If it is a single resourcemanager, you only need to configure one host name. If it is resourcemanager HA, the default configuration is fine
+ yarn.application.status.address=http://xxxx:8088/ws/v1/cluster/apps/%s
+
+```
+
+- Only one address needs to be configured for yarn.resourcemanager.ha.rm.ids and yarn.application.status.address, and the other address is empty.
+- You need to copy core-site.xml and hdfs-site.xml from the conf directory of the Hadoop cluster to the conf directory of the dolphinscheduler project, and restart the api-server service.
+
+#### 3.2 File management
+
+> It is the management of various resource files, including creating basic txt/log/sh/conf/py/java and other files, uploading jar packages and other types of files, and can do edit, rename, download, delete and other operations.
+
+ <p align="center">
+ <img src="/img/file-manage-en.png" width="80%" />
+ </p>
+
+- Create a file
+ > The file format supports the following types: txt, log, sh, conf, cfg, py, java, sql, xml, hql, properties
+
+<p align="center">
+ <img src="/img/file_create_en.png" width="80%" />
+ </p>
+
+- upload files
+
+> Upload file: Click the "Upload File" button to upload, drag the file to the upload area, the file name will be automatically completed with the uploaded file name
+
+<p align="center">
+ <img src="/img/file-upload-en.png" width="80%" />
+ </p>
+
+- File View
+
+> For the file types that can be viewed, click the file name to view the file details
+
+<p align="center">
+ <img src="/img/file_detail_en.png" width="80%" />
+ </p>
+
+- download file
+
+> Click the "Download" button in the file list to download the file or click the "Download" button in the upper right corner of the file details to download the file
+
+- File rename
+
+<p align="center">
+ <img src="/img/file_rename_en.png" width="80%" />
+ </p>
+
+- delete
+ > File list -> Click the "Delete" button to delete the specified file
+
+#### 3.3 UDF management
+
+#### 3.3.1 Resource management
+
+> The resource management and file management functions are similar. The difference is that the resource management is the uploaded UDF function, and the file management uploads the user program, script and configuration file.
+> Operation function: rename, download, delete.
+
+- Upload udf resources
+ > Same as uploading files.
+
+#### 3.3.2 Function management
+
+- Create UDF function
+ > Click "Create UDF Function", enter the udf function parameters, select the udf resource, and click "Submit" to create the udf function.
+
+> Currently only supports temporary UDF functions of HIVE
+
+- UDF function name: the name when the UDF function is entered
+- Package name Class name: Enter the full path of the UDF function
+- UDF resource: Set the resource file corresponding to the created UDF
+
+<p align="center">
+ <img src="/img/udf_edit_en.png" width="80%" />
+ </p>
+
+### 4. Create data source
+
+> Data source center supports MySQL, POSTGRESQL, HIVE/IMPALA, SPARK, CLICKHOUSE, ORACLE, SQLSERVER and other data sources
+
+#### 4.1 Create/Edit MySQL data source
+
+- Click "Data Source Center -> Create Data Source" to create different types of data sources according to requirements.
+
+- Data source: select MYSQL
+- Data source name: enter the name of the data source
+- Description: Enter a description of the data source
+- IP hostname: enter the IP to connect to MySQL
+- Port: Enter the port to connect to MySQL
+- Username: Set the username for connecting to MySQL
+- Password: Set the password for connecting to MySQL
+- Database name: Enter the name of the database connected to MySQL
+- Jdbc connection parameters: parameter settings for MySQL connection, filled in in JSON form
+
+<p align="center">
+ <img src="/img/mysql-en.png" width="80%" />
+ </p>
+
+> Click "Test Connection" to test whether the data source can be successfully connected.
+
+#### 4.2 Create/Edit POSTGRESQL data source
+
+- Data source: select POSTGRESQL
+- Data source name: enter the name of the data source
+- Description: Enter a description of the data source
+- IP/Host Name: Enter the IP to connect to POSTGRESQL
+- Port: Enter the port to connect to POSTGRESQL
+- Username: Set the username for connecting to POSTGRESQL
+- Password: Set the password for connecting to POSTGRESQL
+- Database name: Enter the name of the database connected to POSTGRESQL
+- Jdbc connection parameters: parameter settings for POSTGRESQL connection, filled in in JSON form
+
+<p align="center">
+ <img src="/img/postgresql-en.png" width="80%" />
+ </p>
+
+#### 4.3 Create/Edit HIVE data source
+
+1.Use HiveServer2 to connect
+
+ <p align="center">
+ <img src="/img/hive-en.png" width="80%" />
+ </p>
+
+- Data source: select HIVE
+- Data source name: enter the name of the data source
+- Description: Enter a description of the data source
+- IP/Host Name: Enter the IP connected to HIVE
+- Port: Enter the port connected to HIVE
+- Username: Set the username for connecting to HIVE
+- Password: Set the password for connecting to HIVE
+- Database name: Enter the name of the database connected to HIVE
+- Jdbc connection parameters: parameter settings for HIVE connection, filled in in JSON form
+
+ 2.Use HiveServer2 HA Zookeeper to connect
+
+ <p align="center">
+ <img src="/img/hive1-en.png" width="80%" />
+ </p>
+
+Note: If you enable **kerberos**, you need to fill in **Principal**
+
+<p align="center">
+ <img src="/img/hive-en.png" width="80%" />
+ </p>
+
+#### 4.4 Create/Edit Spark data source
+
+<p align="center">
+ <img src="/img/spark-en.png" width="80%" />
+ </p>
+
+- Data source: select Spark
+- Data source name: enter the name of the data source
+- Description: Enter a description of the data source
+- IP/Hostname: Enter the IP connected to Spark
+- Port: Enter the port connected to Spark
+- Username: Set the username for connecting to Spark
+- Password: Set the password for connecting to Spark
+- Database name: Enter the name of the database connected to Spark
+- Jdbc connection parameters: parameter settings for Spark connection, filled in in JSON form
+
+### 5. Security Center (Permission System)
+
+ * Only the administrator account in the security center has the authority to operate. It has functions such as queue management, tenant management, user management, alarm group management, worker group management, token management, etc. In the user management module, resources, data sources, projects, etc. Authorization
+ * Administrator login, default user name and password: admin/dolphinscheduler123
+
+#### 5.1 Create queue
+
+- Queue is used when the "queue" parameter is needed to execute programs such as spark and mapreduce.
+- The administrator enters the Security Center->Queue Management page and clicks the "Create Queue" button to create a queue.
+<p align="center">
+ <img src="/img/create-queue-en.png" width="80%" />
+ </p>
+
+#### 5.2 Add tenant
+
+- The tenant corresponds to the Linux user, which is used by the worker to submit the job. If Linux does not have this user, the worker will create this user when executing the script.
+- Tenant Code: **Tenant Code is the only user on Linux and cannot be repeated**
+- The administrator enters the Security Center->Tenant Management page and clicks the "Create Tenant" button to create a tenant.
+
+ <p align="center">
+ <img src="/img/addtenant-en.png" width="80%" />
+ </p>
+
+#### 5.3 Create normal user
+
+- Users are divided into **administrator users** and **normal users**
+
+ - The administrator has authorization and user management authority, but does not have the authority to create project and workflow definition operations.
+ - Ordinary users can create projects and create, edit, and execute workflow definitions.
+ - Note: If the user switches tenants, all resources under the tenant where the user belongs will be copied to the new tenant that is switched.
+
+- The administrator enters the Security Center -> User Management page and clicks the "Create User" button to create a user.
+<p align="center">
+ <img src="/img/user-en.png" width="80%" />
+ </p>
+
+> **Edit user information**
+
+- The administrator enters the Security Center->User Management page and clicks the "Edit" button to edit user information.
+- After an ordinary user logs in, click the user information in the user name drop-down box to enter the user information page, and click the "Edit" button to edit the user information.
+
+> **Modify user password**
+
+- The administrator enters the Security Center->User Management page and clicks the "Edit" button. When editing user information, enter the new password to modify the user password.
+- After a normal user logs in, click the user information in the user name drop-down box to enter the password modification page, enter the password and confirm the password and click the "Edit" button, then the password modification is successful.
+
+#### 5.4 Create alarm group
+
+- The alarm group is a parameter set at startup. After the process ends, the status of the process and other information will be sent to the alarm group in the form of email.
+
+* The administrator enters the Security Center -> Alarm Group Management page and clicks the "Create Alarm Group" button to create an alarm group.
+
+ <p align="center">
+ <img src="/img/mail-en.png" width="80%" />
+
+#### 5.5 Token management
+
+> Since the back-end interface has login check, token management provides a way to perform various operations on the system by calling the interface.
+
+- The administrator enters the Security Center -> Token Management page, clicks the "Create Token" button, selects the expiration time and user, clicks the "Generate Token" button, and clicks the "Submit" button, then the selected user's token is created successfully.
+
+ <p align="center">
+ <img src="/img/create-token-en.png" width="80%" />
+ </p>
+
+ - After an ordinary user logs in, click the user information in the user name drop-down box, enter the token management page, select the expiration time, click the "generate token" button, and click the "submit" button, then the user creates a token successfully.
+ - Call example:
+
+```
+Token call example
+ /**
+ * test token
+ */
+ public void doPOSTParam()throws Exception{
+ // create HttpClient
+ CloseableHttpClient httpclient = HttpClients.createDefault();
+
+ // create http post request
+ HttpPost httpPost = new HttpPost("http://127.0.0.1:12345/escheduler/projects/create");
+ httpPost.setHeader("token", "123");
+ // set parameters
+ List<NameValuePair> parameters = new ArrayList<NameValuePair>();
+ parameters.add(new BasicNameValuePair("projectName", "qzw"));
+ parameters.add(new BasicNameValuePair("desc", "qzw"));
+ UrlEncodedFormEntity formEntity = new UrlEncodedFormEntity(parameters);
+ httpPost.setEntity(formEntity);
+ CloseableHttpResponse response = null;
+ try {
+ // execute
+ response = httpclient.execute(httpPost);
+ // response status code 200
+ if (response.getStatusLine().getStatusCode() == 200) {
+ String content = EntityUtils.toString(response.getEntity(), "UTF-8");
+ System.out.println(content);
+ }
+ } finally {
+ if (response != null) {
+ response.close();
+ }
+ httpclient.close();
+ }
+ }
+```
+
+#### 5.6 Granted permission
+
+ * Granted permissions include project permissions, resource permissions, data source permissions, UDF function permissions.
+ * The administrator can authorize the projects, resources, data sources and UDF functions not created by ordinary users. Because the authorization methods for projects, resources, data sources and UDF functions are the same, we take project authorization as an example.
+ * Note: For projects created by users themselves, the user has all permissions. The project list and the selected project list will not be displayed.
+
+- The administrator enters the Security Center -> User Management page and clicks the "Authorize" button of the user who needs to be authorized, as shown in the figure below:
+ <p align="center">
+ <img src="/img/auth-en.png" width="80%" />
+</p>
+
+- Select the project to authorize the project.
+
+<p align="center">
+ <img src="/img/authproject-en.png" width="80%" />
+ </p>
+
+- Resources, data sources, and UDF function authorization are the same as project authorization.
+
+### 6. monitoring Center
+
+#### 6.1 Service management
+
+- Service management is mainly to monitor and display the health status and basic information of each service in the system
+
+#### 6.1.1 master monitoring
+
+- Mainly related to master information.
+<p align="center">
+ <img src="/img/master-jk-en.png" width="80%" />
+ </p>
+
+#### 6.1.2 worker monitoring
+
+- Mainly related to worker information.
+
+<p align="center">
+ <img src="/img/worker-jk-en.png" width="80%" />
+ </p>
+
+#### 6.1.3 Zookeeper monitoring
+
+- Mainly related configuration information of each worker and master in zookpeeper.
+
+<p align="center">
+ <img src="/img/zookeeper-monitor-en.png" width="80%" />
+ </p>
+
+#### 6.1.4 DB monitoring
+
+- Mainly the health of the DB
+
+<p align="center">
+ <img src="/img/mysql-jk-en.png" width="80%" />
+ </p>
+
+#### 6.2 Statistics management
+
+<p align="center">
+ <img src="/img/statistics-en.png" width="80%" />
+ </p>
+
+- Number of commands to be executed: statistics on the t_ds_command table
+- The number of failed commands: statistics on the t_ds_error_command table
+- Number of tasks to run: Count the data of task_queue in Zookeeper
+- Number of tasks to be killed: Count the data of task_kill in Zookeeper
+
+### 7. <span id=TaskParamers>Task node type and parameter settings</span>
+
+#### 7.1 Shell node
+
+> Shell node, when the worker is executed, a temporary shell script is generated, and the linux user with the same name as the tenant executes the script.
+
+- Click Project Management-Project Name-Workflow Definition, and click the "Create Workflow" button to enter the DAG editing page.
+- Drag <img src="/img/shell.png" width="35"/> from the toolbar to the drawing board, as shown in the figure below:
+
+ <p align="center">
+ <img src="/img/shell-en.png" width="80%" />
+ </p>
+
+- Node name: The node name in a workflow definition is unique.
+- Run flag: Identifies whether this node can be scheduled normally, if it does not need to be executed, you can turn on the prohibition switch.
+- Descriptive information: describe the function of the node.
+- Task priority: When the number of worker threads is insufficient, they are executed in order from high to low, and when the priority is the same, they are executed according to the first-in first-out principle.
+- Worker grouping: Tasks are assigned to the machines of the worker group to execute. If Default is selected, a worker machine will be randomly selected for execution.
+- Number of failed retry attempts: The number of times the task failed to be resubmitted. It supports drop-down and hand-filling.
+- Failed retry interval: The time interval for resubmitting the task after a failed task. It supports drop-down and hand-filling.
+- Timeout alarm: Check the timeout alarm and timeout failure. When the task exceeds the "timeout period", an alarm email will be sent and the task execution will fail.
+- Script: SHELL program developed by users.
+- Resource: Refers to the list of resource files that need to be called in the script, and the files uploaded or created by the resource center-file management.
+- User-defined parameters: It is a user-defined parameter that is part of SHELL, which will replace the content with \${variable} in the script.
+
+#### 7.2 Sub-process node
+
+- The sub-process node is to execute a certain external workflow definition as a task node.
+ > Drag the  task node in the toolbar to the drawing board, as shown in the following figure:
+
+<p align="center">
+ <img src="/img/sub-process-en.png" width="80%" />
+ </p>
+
+- Node name: The node name in a workflow definition is unique
+- Run flag: identify whether this node can be scheduled normally
+- Descriptive information: describe the function of the node
+- Timeout alarm: Check the timeout alarm and timeout failure. When the task exceeds the "timeout period", an alarm email will be sent and the task execution will fail.
+- Sub-node: It is the workflow definition of the selected sub-process. Enter the sub-node in the upper right corner to jump to the workflow definition of the selected sub-process
+
+#### 7.3 DEPENDENT node
+
+- Dependent nodes are **dependency check nodes**. For example, process A depends on the successful execution of process B yesterday, and the dependent node will check whether process B has a successful execution yesterday.
+
+> Drag the  task node in the toolbar to the drawing board, as shown in the following figure:
+
+<p align="center">
+ <img src="/img/dependent-nodes-en.png" width="80%" />
+ </p>
+
+> The dependent node provides a logical judgment function, such as checking whether the B process was successful yesterday, or whether the C process was executed successfully.
+
+ <p align="center">
+ <img src="/img/depend-node-en.png" width="80%" />
+ </p>
+
+> For example, process A is a weekly report task, processes B and C are daily tasks, and task A requires tasks B and C to be successfully executed every day of the last week, as shown in the figure:
+
+ <p align="center">
+ <img src="/img/depend-node1-en.png" width="80%" />
+ </p>
+
+> If the weekly report A also needs to be executed successfully last Tuesday:
+
+ <p align="center">
+ <img src="/img/depend-node3-en.png" width="80%" />
+ </p>
+
+#### 7.4 Stored procedure node
+
+- According to the selected data source, execute the stored procedure.
+ > Drag in the toolbarThe task node to the drawing board, as shown in the following figure:
+
+<p align="center">
+ <img src="/img/procedure-en.png" width="80%" />
+ </p>
+
+- Data source: The data source type of the stored procedure supports MySQL and POSTGRESQL, select the corresponding data source
+- Method: is the method name of the stored procedure
+- Custom parameters: The custom parameter types of the stored procedure support IN and OUT, and the data types support nine data types: VARCHAR, INTEGER, LONG, FLOAT, DOUBLE, DATE, TIME, TIMESTAMP, and BOOLEAN
+
+#### 7.5 SQL node
+
+- Drag in the toolbarTask node into the drawing board
+- Non-query SQL function: edit non-query SQL task information, select non-query for sql type, as shown in the figure below:
+ <p align="center">
+ <img src="/img/sql-en.png" width="80%" />
+</p>
+
+- Query SQL function: Edit and query SQL task information, sql type selection query, select form or attachment to send mail to the specified recipient, as shown in the figure below.
+
+<p align="center">
+ <img src="/img/sql-node-en.png" width="80%" />
+ </p>
+
+- Data source: select the corresponding data source
+- sql type: supports query and non-query. The query is a select type query, which is returned with a result set. You can specify three templates for email notification as form, attachment or form attachment. Non-queries are returned without a result set, and are for three types of operations: update, delete, and insert.
+- sql parameter: the input parameter format is key1=value1;key2=value2...
+- sql statement: SQL statement
+- UDF function: For data sources of type HIVE, you can refer to UDF functions created in the resource center. UDF functions are not supported for other types of data sources.
+- Custom parameters: SQL task type, and stored procedure is a custom parameter order to set values for the method. The custom parameter type and data type are the same as the stored procedure task type. The difference is that the SQL task type custom parameter will replace the \${variable} in the SQL statement.
+- Pre-sql: Pre-sql is executed before the sql statement.
+- Post-sql: Post-sql is executed after the sql statement.
+
+#### 7.6 SPARK node
+
+- Through the SPARK node, you can directly execute the SPARK program. For the spark node, the worker will use the `spark-submit` method to submit tasks
+
+> Drag in the toolbarThe task node to the drawing board, as shown in the following figure:
+
+<p align="center">
+ <img src="/img/spark-submit-en.png" width="80%" />
+ </p>
+
+- Program type: supports JAVA, Scala and Python three languages
+- The class of the main function: is the full path of the Spark program’s entry Main Class
+- Main jar package: Spark jar package
+- Deployment mode: support three modes of yarn-cluster, yarn-client and local
+- Driver core number: You can set the number of Driver cores and the number of memory
+- Number of Executors: You can set the number of Executors, the number of Executor memory, and the number of Executor cores
+- Command line parameters: Set the input parameters of the Spark program and support the substitution of custom parameter variables.
+- Other parameters: support --jars, --files, --archives, --conf format
+- Resource: If the resource file is referenced in other parameters, you need to select and specify in the resource
+- User-defined parameter: It is a user-defined parameter of the MR part, which will replace the content with \${variable} in the script
+
+Note: JAVA and Scala are only used for identification, there is no difference, if it is Spark developed by Python, there is no main function class, and the others are the same
+
+#### 7.7 MapReduce(MR) node
+
+- Using the MR node, you can directly execute the MR program. For the mr node, the worker will use the `hadoop jar` method to submit tasks
+
+> Drag the  task node in the toolbar to the drawing board, as shown in the following figure:
+
+1. JAVA program
+
+ <p align="center">
+ <img src="/img/mr_java_en.png" width="80%" />
+ </p>
+
+- The class of the main function: is the full path of the Main Class, the entry point of the MR program
+- Program type: select JAVA language
+- Main jar package: is the MR jar package
+- Command line parameters: set the input parameters of the MR program and support the substitution of custom parameter variables
+- Other parameters: support -D, -files, -libjars, -archives format
+- Resource: If the resource file is referenced in other parameters, you need to select and specify in the resource
+- User-defined parameter: It is a user-defined parameter of the MR part, which will replace the content with \${variable} in the script
+
+2. Python program
+
+<p align="center">
+ <img src="/img/mr_edit_en.png" width="80%" />
+ </p>
+
+- Program type: select Python language
+- Main jar package: is the Python jar package for running MR
+- Other parameters: support -D, -mapper, -reducer, -input -output format, here you can set the input of user-defined parameters, such as:
+- -mapper "mapper.py 1" -file mapper.py -reducer reducer.py -file reducer.py –input /journey/words.txt -output /journey/out/mr/\${currentTimeMillis}
+- The mapper.py 1 after -mapper is two parameters, the first parameter is mapper.py, and the second parameter is 1
+- Resource: If the resource file is referenced in other parameters, you need to select and specify in the resource
+- User-defined parameter: It is a user-defined parameter of the MR part, which will replace the content with \${variable} in the script
+
+#### 7.8 Python Node
+
+- Using python nodes, you can directly execute python scripts. For python nodes, workers will use `python **` to submit tasks.
+
+> Drag in the toolbarThe task node to the drawing board, as shown in the following figure:
+
+<p align="center">
+ <img src="/img/python-en.png" width="80%" />
+ </p>
+
+- Script: Python program developed by the user
+- Resources: refers to the list of resource files that need to be called in the script
+- User-defined parameter: It is a local user-defined parameter of Python, which will replace the content with \${variable} in the script
+
+#### 7.9 Flink Node
+
+- Drag in the toolbar<img src="/img/flink.png" width="35"/>The task node to the drawing board, as shown in the following figure:
Review comment:
```suggestion
- Drag in the toolbar<img src="/img/flink.png" width="35"/> task node to the drawing board, as shown in the following figure:
```
##########
File path: docs/en-us/1.3.2/user_doc/system-manual.md
##########
@@ -0,0 +1,886 @@
+# System User Manual
+
+## Get started quickly
+
+> Please refer to [Quick Start](quick-start.html)
+
+## Operation guide
+
+### 1. Home
+
+The home page contains task status statistics, process status statistics, and workflow definition statistics for all projects of the user.
+
+<p align="center">
+<img src="/img/home_en.png" width="80%" />
+</p>
+
+### 2. Project management
+
+#### 2.1 Create project
+
+- Click "Project Management" to enter the project management page, click the "Create Project" button, enter the project name, project description, and click "Submit" to create a new project.
+
+ <p align="center">
+ <img src="/img/create_project_en1.png" width="80%" />
+ </p>
+
+#### 2.2 Project home
+
+- Click the project name link on the project management page to enter the project home page, as shown in the figure below, the project home page contains the task status statistics, process status statistics, and workflow definition statistics of the project.
+ <p align="center">
+ <img src="/img/project_home_en.png" width="80%" />
+ </p>
+
+- Task status statistics: within the specified time range, count the number of task instances as successful submission, running, ready to pause, pause, ready to stop, stop, failure, success, fault tolerance, kill, and waiting threads
+- Process status statistics: within the specified time range, count the number of the status of the workflow instance as submission success, running, ready to pause, pause, ready to stop, stop, failure, success, fault tolerance, kill, and waiting threads
+- Workflow definition statistics: Count the workflow definitions created by this user and the workflow definitions granted to this user by the administrator
+
+#### 2.3 Workflow definition
+
+#### <span id=creatDag>2.3.1 Create workflow definition</span>
+
+- Click Project Management -> Workflow -> Workflow Definition to enter the workflow definition page, and click the "Create Workflow" button to enter the **workflow DAG edit** page, as shown in the following figure:
+ <p align="center">
+ <img src="/img/dag5.png" width="80%" />
+ </p>
+- Drag in the toolbar <img src="/img/shell.png" width="35"/> Add a Shell task to the drawing board, as shown in the figure below:
+ <p align="center">
+ <img src="/img/shell-en.png" width="80%" />
+ </p>
+- **Add parameter settings for this shell task:**
+
+1. Fill in the "Node Name", "Description", and "Script" fields;
+2. Check “Normal” for “Run Flag”. If “Prohibit Execution” is checked, the task will not be executed when the workflow runs;
+3. Select "Task Priority": When the number of worker threads is insufficient, high-level tasks will be executed first in the execution queue, and tasks with the same priority will be executed in the order of first in, first out;
+4. Timeout alarm (optional): Check the timeout alarm, timeout failure, and fill in the "timeout period". When the task execution time exceeds **timeout period**, an alert email will be sent and the task timeout fails;
+5. Resources (optional). Resource files are files created or uploaded on the Resource Center -> File Management page. For example, the file name is `test.sh`, and the command to call the resource in the script is `sh test.sh`;
+6. Custom parameters (optional), refer to [Custom Parameters](#UserDefinedParameters);
+7. Click the "Confirm Add" button to save the task settings.
+
+- **Increase the order of task execution:** Click the icon in the upper right corner <img src="/img/line.png" width="35"/> to connect the task; as shown in the figure below, task 2 and task 3 are executed in parallel, When task 1 finished execute, tasks 2 and 3 will be executed simultaneously.
+
+ <p align="center">
+ <img src="/img/dag6.png" width="80%" />
+ </p>
+
+- **Delete dependencies:** Click the "arrow" icon in the upper right corner <img src="/img/arrow.png" width="35"/>, select the connection line, and click the "Delete" icon in the upper right corner <img src= "/img/delete.png" width="35"/>, delete dependencies between tasks.
+ <p align="center">
+ <img src="/img/dag7.png" width="80%" />
+ </p>
+
+- **Save workflow definition:** Click the "Save" button, and the "Set DAG chart name" pop-up box will pop up, as shown in the figure below. Enter the workflow definition name, workflow definition description, and set global parameters (optional, refer to [ Custom parameters](#UserDefinedParameters)), click the "Add" button, and the workflow definition is created successfully.
+ <p align="center">
+ <img src="/img/dag8.png" width="80%" />
+ </p>
+> For other types of tasks, please refer to [Task Node Type and Parameter Settings](#TaskParamers).
+
+#### 2.3.2 Workflow definition operation function
+
+Click Project Management -> Workflow -> Workflow Definition to enter the workflow definition page, as shown below:
+
+<p align="center">
+<img src="/img/work_list_en.png" width="80%" />
+</p>
+The operation functions of the workflow definition list are as follows:
+
+- **Edit:** Only "offline" workflow definitions can be edited. Workflow DAG editing is the same as [Create Workflow Definition](#creatDag).
+- **Online:** When the workflow status is "Offline", used to online workflow. Only the workflow in the "Online" state can run, but cannot be edited.
+- **Offline:** When the workflow status is "Online", used to offline workflow. Only the workflow in the "Offline" state can be edited, but not run.
+- **Run:** Only workflow in the online state can run. See [2.3.3 Run Workflow](#runWorkflow) for the operation steps
+- **Timing:** Timing can only be set in online workflows, and the system automatically schedules the workflow to run on a regular basis. The status after creating a timing is "offline", and the timing must be online on the timing management page to take effect. See [2.3.4 Workflow Timing](#creatTiming) for timing operation steps.
+- **Timing Management:** The timing management page can be edited, online/offline, and deleted.
+- **Delete:** Delete the workflow definition.
+- **Download:** Download workflow definition to local.
+- **Tree Diagram:** Display the task node type and task status in a tree structure, as shown in the figure below:
+ <p align="center">
+ <img src="/img/tree_en.png" width="80%" />
+ </p>
+
+#### <span id=runWorkflow>2.3.3 Run the workflow</span>
+
+- Click Project Management -> Workflow -> Workflow Definition to enter the workflow definition page, as shown in the figure below, click the "Go Online" button <img src="/img/online.png" width="35"/>,Go online workflow.
+ <p align="center">
+ <img src="/img/work_list_en.png" width="80%" />
+ </p>
+
+- Click the "Run" button to pop up the startup parameter setting pop-up box, as shown in the figure below, set the startup parameters, click the "Run" button in the pop-up box, the workflow starts running, and the workflow instance page generates a workflow instance.
+ <p align="center">
+ <img src="/img/run_work_en.png" width="80%" />
+ </p>
+ <span id=runParamers>Description of workflow operating parameters:</span>
+
+ * Failure strategy: When a task node fails to execute, other parallel task nodes need to execute the strategy. "Continue" means: after a certain task fails, other task nodes execute normally; "End" means: terminate all tasks being executed, and terminate the entire process.
+ * Notification strategy: When the process is over, the process execution information notification email is sent according to the process status, including any status is not sent, successful sent, failed sent, successful or failed sent.
+ * Process priority: The priority of process operation, divided into five levels: highest (HIGHEST), high (HIGH), medium (MEDIUM), low (LOW), and lowest (LOWEST). When the number of master threads is insufficient, high-level processes will be executed first in the execution queue, and processes with the same priority will be executed in a first-in first-out order.
+ * Worker group: The process can only be executed in the specified worker machine group. The default is Default, which can be executed on any worker.
+ * Notification group: select notification strategy||timeout alarm||when fault tolerance occurs, process information or email will be sent to all members in the notification group.
+ * Recipient: Select notification policy||Timeout alarm||When fault tolerance occurs, process information or alarm email will be sent to the recipient list.
+ * Cc: Select the notification strategy||Timeout alarm||When fault tolerance occurs, the process information or warning email will be copied to the CC list.
+ * Complement: Two modes including serial complement and parallel complement. Serial complement: within the specified time range, the complement is executed sequentially from the start date to the end date, and only one process instance is generated; parallel complement: within the specified time range, multiple days are complemented at the same time to generate N process instances.
+ * For example, you need to fill in the data from May 1 to May 10.
+
+ <p align="center">
+ <img src="/img/complement_en1.png" width="80%" />
+ </p>
+
+ > Serial mode: The complement is executed sequentially from May 1 to May 10, and a process instance is generated on the process instance page;
+
+ > Parallel mode: The tasks from May 1 to may 10 are executed simultaneously, and 10 process instances are generated on the process instance page.
+
+#### <span id=creatTiming>2.3.4 Workflow timing</span>
+
+- Create timing: Click Project Management->Workflow->Workflow Definition, enter the workflow definition page, go online the workflow, click the "timing" button <img src="/img/timing.png" width="35"/> ,The timing parameter setting dialog box pops up, as shown in the figure below:
+ <p align="center">
+ <img src="/img/time_schedule_en.png" width="80%" />
+ </p>
+- Choose the start and end time. In the start and end time range, the workflow is run at regular intervals; not in the start and end time range, no more regular workflow instances are generated.
+- Add a timing that is executed once every day at 5 AM, as shown in the following figure:
+ <p align="center">
+ <img src="/img/timer-en.png" width="80%" />
+ </p>
+- Failure strategy, notification strategy, process priority, worker group, notification group, recipient, and CC are the same as [workflow running parameters](#runParamers).
+- Click the "Create" button to create the timing successfully. At this time, the timing status is "**Offline**" and the timing needs to be **Online** to take effect.
+- Timing online: Click the "timing management" button <img src="/img/timeManagement.png" width="35"/>, enter the timing management page, click the "online" button, the timing status will change to "online", as shown in the below figure, the workflow takes effect regularly.
+ <p align="center">
+ <img src="/img/time-manage-list-en.png" width="80%" />
+ </p>
+
+#### 2.3.5 Import workflow
+
+Click Project Management -> Workflow -> Workflow Definition to enter the workflow definition page, click the "Import Workflow" button to import the local workflow file, the workflow definition list displays the imported workflow, and the status is offline.
+
+#### 2.4 Workflow instance
+
+#### 2.4.1 View workflow instance
+
+- Click Project Management -> Workflow -> Workflow Instance to enter the Workflow Instance page, as shown in the figure below:
+ <p align="center">
+ <img src="/img/instance-list-en.png" width="80%" />
+ </p>
+- Click the workflow name to enter the DAG view page to view the task execution status, as shown in the figure below.
+ <p align="center">
+ <img src="/img/instance-runs-en.png" width="80%" />
+ </p>
+
+#### 2.4.2 View task log
+
+- Enter the workflow instance page, click the workflow name, enter the DAG view page, double-click the task node, as shown in the following figure:
+ <p align="center">
+ <img src="/img/instanceViewLog-en.png" width="80%" />
+ </p>
+- Click "View Log", a log pop-up box will pop up, as shown in the figure below, the task log can also be viewed on the task instance page, refer to [Task View Log](#taskLog)。
+ <p align="center">
+ <img src="/img/task-log-en.png" width="80%" />
+ </p>
+
+#### 2.4.3 View task history
+
+- Click Project Management -> Workflow -> Workflow Instance to enter the workflow instance page, and click the workflow name to enter the workflow DAG page;
+- Double-click the task node, as shown in the figure below, click "View History" to jump to the task instance page, and display a list of task instances running by the workflow instance
+ <p align="center">
+ <img src="/img/task_history_en.png" width="80%" />
+ </p>
+
+#### 2.4.4 View operating parameters
+
+- Click Project Management -> Workflow -> Workflow Instance to enter the workflow instance page, and click the workflow name to enter the workflow DAG page;
+- Click the icon in the upper left corner <img src="/img/run_params_button.png" width="35"/>,View the startup parameters of the workflow instance; click the icon <img src="/img/global_param.png" width="35"/>,View the global and local parameters of the workflow instance, as shown in the following figure:
+ <p align="center">
+ <img src="/img/run_params_en.png" width="80%" />
+ </p>
+
+#### 2.4.4 Workflow instance operation function
+
+Click Project Management -> Workflow -> Workflow Instance to enter the Workflow Instance page, as shown in the figure below:
+
+ <p align="center">
+ <img src="/img/instance-list-en.png" width="80%" />
+ </p>
+
+- **Edit:** Only terminated processes can be edited. Click the "Edit" button or the name of the workflow instance to enter the DAG edit page. After edit, click the "Save" button to pop up the Save DAG pop-up box, as shown in the figure below. In the pop-up box, check "Whether to update to workflow definition" and save After that, the workflow definition will be updated; if it is not checked, the workflow definition will not be updated.
+ <p align="center">
+ <img src="/img/editDag-en.png" width="80%" />
+ </p>
+- **Rerun:** Re-execute the terminated process.
+- **Recovery failed:** For failed processes, you can perform recovery operations, starting from the failed node.
+- **Stop:** To **stop** the running process, the background will first `kill`worker process, and then execute `kill -9` operation
+- **Pause:** Perform a **pause** operation on the running process, the system status will change to **waiting for execution**, it will wait for the end of the task being executed, and pause the next task to be executed.
+- **Resume pause:** To resume the paused process, start running directly from the **paused node**
+- **Delete:** Delete the workflow instance and the task instance under the workflow instance
+- **Gantt chart:** The vertical axis of the Gantt chart is the topological sorting of task instances under a certain workflow instance, and the horizontal axis is the running time of the task instances, as shown in the figure:
+ <p align="center">
+ <img src="/img/gantt-en.png" width="80%" />
+ </p>
+
+#### 2.5 Task instance
+
+- Click Project Management -> Workflow -> Task Instance to enter the task instance page, as shown in the figure below, click the name of the workflow instance, you can jump to the workflow instance DAG chart to view the task status.
+ <p align="center">
+ <img src="/img/task-list-en.png" width="80%" />
+ </p>
+
+- <span id=taskLog>View log:</span>Click the "view log" button in the operation column to view the log of task execution.
+ <p align="center">
+ <img src="/img/task-log2-en.png" width="80%" />
+ </p>
+
+### 3. Resource Center
+
+#### 3.1 hdfs resource configuration
+
+- Upload resource files and udf functions, all uploaded files and resources will be stored on hdfs, so the following configuration items are required:
+
+```
+
+conf/common/common.properties
+ # Users who have permission to create directories under the HDFS root path
+ hdfs.root.user=hdfs
+ # data base dir, resource file will store to this hadoop hdfs path, self configuration, please make sure the directory exists on hdfs and have read write permissions。"/escheduler" is recommended
+ data.store2hdfs.basepath=/dolphinscheduler
+ # resource upload startup type : HDFS,S3,NONE
+ res.upload.startup.type=HDFS
+ # whether kerberos starts
+ hadoop.security.authentication.startup.state=false
+ # java.security.krb5.conf path
+ java.security.krb5.conf.path=/opt/krb5.conf
+ # loginUserFromKeytab user
+ login.user.keytab.username=hdfs-mycluster@ESZ.COM
+ # loginUserFromKeytab path
+ login.user.keytab.path=/opt/hdfs.headless.keytab
+
+conf/common/hadoop.properties
+ # ha or single namenode,If namenode ha needs to copy core-site.xml and hdfs-site.xml
+ # to the conf directory,support s3,for example : s3a://dolphinscheduler
+ fs.defaultFS=hdfs://mycluster:8020
+ #resourcemanager ha note this need ips , this empty if single
+ yarn.resourcemanager.ha.rm.ids=192.168.xx.xx,192.168.xx.xx
+ # If it is a single resourcemanager, you only need to configure one host name. If it is resourcemanager HA, the default configuration is fine
+ yarn.application.status.address=http://xxxx:8088/ws/v1/cluster/apps/%s
+
+```
+
+- Only one address needs to be configured for yarn.resourcemanager.ha.rm.ids and yarn.application.status.address, and the other address is empty.
+- You need to copy core-site.xml and hdfs-site.xml from the conf directory of the Hadoop cluster to the conf directory of the dolphinscheduler project, and restart the api-server service.
+
+#### 3.2 File management
+
+> It is the management of various resource files, including creating basic txt/log/sh/conf/py/java and other files, uploading jar packages and other types of files, and can do edit, rename, download, delete and other operations.
+
+ <p align="center">
+ <img src="/img/file-manage-en.png" width="80%" />
+ </p>
+
+- Create a file
+ > The file format supports the following types: txt, log, sh, conf, cfg, py, java, sql, xml, hql, properties
+
+<p align="center">
+ <img src="/img/file_create_en.png" width="80%" />
+ </p>
+
+- upload files
+
+> Upload file: Click the "Upload File" button to upload, drag the file to the upload area, the file name will be automatically completed with the uploaded file name
+
+<p align="center">
+ <img src="/img/file-upload-en.png" width="80%" />
+ </p>
+
+- File View
+
+> For the file types that can be viewed, click the file name to view the file details
+
+<p align="center">
+ <img src="/img/file_detail_en.png" width="80%" />
+ </p>
+
+- download file
+
+> Click the "Download" button in the file list to download the file or click the "Download" button in the upper right corner of the file details to download the file
+
+- File rename
+
+<p align="center">
+ <img src="/img/file_rename_en.png" width="80%" />
+ </p>
+
+- delete
+ > File list -> Click the "Delete" button to delete the specified file
+
+#### 3.3 UDF management
+
+#### 3.3.1 Resource management
+
+> The resource management and file management functions are similar. The difference is that the resource management is the uploaded UDF function, and the file management uploads the user program, script and configuration file.
+> Operation function: rename, download, delete.
+
+- Upload udf resources
+ > Same as uploading files.
+
+#### 3.3.2 Function management
+
+- Create UDF function
+ > Click "Create UDF Function", enter the udf function parameters, select the udf resource, and click "Submit" to create the udf function.
+
+> Currently only supports temporary UDF functions of HIVE
+
+- UDF function name: the name when the UDF function is entered
+- Package name Class name: Enter the full path of the UDF function
+- UDF resource: Set the resource file corresponding to the created UDF
+
+<p align="center">
+ <img src="/img/udf_edit_en.png" width="80%" />
+ </p>
+
+### 4. Create data source
+
+> Data source center supports MySQL, POSTGRESQL, HIVE/IMPALA, SPARK, CLICKHOUSE, ORACLE, SQLSERVER and other data sources
+
+#### 4.1 Create/Edit MySQL data source
+
+- Click "Data Source Center -> Create Data Source" to create different types of data sources according to requirements.
+
+- Data source: select MYSQL
+- Data source name: enter the name of the data source
+- Description: Enter a description of the data source
+- IP hostname: enter the IP to connect to MySQL
+- Port: Enter the port to connect to MySQL
+- Username: Set the username for connecting to MySQL
+- Password: Set the password for connecting to MySQL
+- Database name: Enter the name of the database connected to MySQL
+- Jdbc connection parameters: parameter settings for MySQL connection, filled in in JSON form
+
+<p align="center">
+ <img src="/img/mysql-en.png" width="80%" />
+ </p>
+
+> Click "Test Connection" to test whether the data source can be successfully connected.
+
+#### 4.2 Create/Edit POSTGRESQL data source
+
+- Data source: select POSTGRESQL
+- Data source name: enter the name of the data source
+- Description: Enter a description of the data source
+- IP/Host Name: Enter the IP to connect to POSTGRESQL
+- Port: Enter the port to connect to POSTGRESQL
+- Username: Set the username for connecting to POSTGRESQL
+- Password: Set the password for connecting to POSTGRESQL
+- Database name: Enter the name of the database connected to POSTGRESQL
+- Jdbc connection parameters: parameter settings for POSTGRESQL connection, filled in in JSON form
+
+<p align="center">
+ <img src="/img/postgresql-en.png" width="80%" />
+ </p>
+
+#### 4.3 Create/Edit HIVE data source
+
+1.Use HiveServer2 to connect
+
+ <p align="center">
+ <img src="/img/hive-en.png" width="80%" />
+ </p>
+
+- Data source: select HIVE
+- Data source name: enter the name of the data source
+- Description: Enter a description of the data source
+- IP/Host Name: Enter the IP connected to HIVE
+- Port: Enter the port connected to HIVE
+- Username: Set the username for connecting to HIVE
+- Password: Set the password for connecting to HIVE
+- Database name: Enter the name of the database connected to HIVE
+- Jdbc connection parameters: parameter settings for HIVE connection, filled in in JSON form
+
+ 2.Use HiveServer2 HA Zookeeper to connect
+
+ <p align="center">
+ <img src="/img/hive1-en.png" width="80%" />
+ </p>
+
+Note: If you enable **kerberos**, you need to fill in **Principal**
+
+<p align="center">
+ <img src="/img/hive-en.png" width="80%" />
+ </p>
+
+#### 4.4 Create/Edit Spark data source
+
+<p align="center">
+ <img src="/img/spark-en.png" width="80%" />
+ </p>
+
+- Data source: select Spark
+- Data source name: enter the name of the data source
+- Description: Enter a description of the data source
+- IP/Hostname: Enter the IP connected to Spark
+- Port: Enter the port connected to Spark
+- Username: Set the username for connecting to Spark
+- Password: Set the password for connecting to Spark
+- Database name: Enter the name of the database connected to Spark
+- Jdbc connection parameters: parameter settings for Spark connection, filled in in JSON form
+
+### 5. Security Center (Permission System)
+
+ * Only the administrator account in the security center has the authority to operate. It has functions such as queue management, tenant management, user management, alarm group management, worker group management, token management, etc. In the user management module, resources, data sources, projects, etc. Authorization
+ * Administrator login, default user name and password: admin/dolphinscheduler123
+
+#### 5.1 Create queue
+
+- Queue is used when the "queue" parameter is needed to execute programs such as spark and mapreduce.
+- The administrator enters the Security Center->Queue Management page and clicks the "Create Queue" button to create a queue.
+<p align="center">
+ <img src="/img/create-queue-en.png" width="80%" />
+ </p>
+
+#### 5.2 Add tenant
+
+- The tenant corresponds to the Linux user, which is used by the worker to submit the job. If Linux does not have this user, the worker will create this user when executing the script.
+- Tenant Code: **Tenant Code is the only user on Linux and cannot be repeated**
+- The administrator enters the Security Center->Tenant Management page and clicks the "Create Tenant" button to create a tenant.
+
+ <p align="center">
+ <img src="/img/addtenant-en.png" width="80%" />
+ </p>
+
+#### 5.3 Create normal user
+
+- Users are divided into **administrator users** and **normal users**
+
+ - The administrator has authorization and user management authority, but does not have the authority to create project and workflow definition operations.
+ - Ordinary users can create projects and create, edit, and execute workflow definitions.
+ - Note: If the user switches tenants, all resources under the tenant where the user belongs will be copied to the new tenant that is switched.
+
+- The administrator enters the Security Center -> User Management page and clicks the "Create User" button to create a user.
+<p align="center">
+ <img src="/img/user-en.png" width="80%" />
+ </p>
+
+> **Edit user information**
+
+- The administrator enters the Security Center->User Management page and clicks the "Edit" button to edit user information.
+- After an ordinary user logs in, click the user information in the user name drop-down box to enter the user information page, and click the "Edit" button to edit the user information.
+
+> **Modify user password**
+
+- The administrator enters the Security Center->User Management page and clicks the "Edit" button. When editing user information, enter the new password to modify the user password.
+- After a normal user logs in, click the user information in the user name drop-down box to enter the password modification page, enter the password and confirm the password and click the "Edit" button, then the password modification is successful.
+
+#### 5.4 Create alarm group
+
+- The alarm group is a parameter set at startup. After the process ends, the status of the process and other information will be sent to the alarm group in the form of email.
+
+* The administrator enters the Security Center -> Alarm Group Management page and clicks the "Create Alarm Group" button to create an alarm group.
+
+ <p align="center">
+ <img src="/img/mail-en.png" width="80%" />
+
+#### 5.5 Token management
+
+> Since the back-end interface has login check, token management provides a way to perform various operations on the system by calling the interface.
+
+- The administrator enters the Security Center -> Token Management page, clicks the "Create Token" button, selects the expiration time and user, clicks the "Generate Token" button, and clicks the "Submit" button, then the selected user's token is created successfully.
+
+ <p align="center">
+ <img src="/img/create-token-en.png" width="80%" />
+ </p>
+
+ - After an ordinary user logs in, click the user information in the user name drop-down box, enter the token management page, select the expiration time, click the "generate token" button, and click the "submit" button, then the user creates a token successfully.
+ - Call example:
+
+```
+Token call example
+ /**
+ * test token
+ */
+ public void doPOSTParam()throws Exception{
+ // create HttpClient
+ CloseableHttpClient httpclient = HttpClients.createDefault();
+
+ // create http post request
+ HttpPost httpPost = new HttpPost("http://127.0.0.1:12345/escheduler/projects/create");
+ httpPost.setHeader("token", "123");
+ // set parameters
+ List<NameValuePair> parameters = new ArrayList<NameValuePair>();
+ parameters.add(new BasicNameValuePair("projectName", "qzw"));
+ parameters.add(new BasicNameValuePair("desc", "qzw"));
+ UrlEncodedFormEntity formEntity = new UrlEncodedFormEntity(parameters);
+ httpPost.setEntity(formEntity);
+ CloseableHttpResponse response = null;
+ try {
+ // execute
+ response = httpclient.execute(httpPost);
+ // response status code 200
+ if (response.getStatusLine().getStatusCode() == 200) {
+ String content = EntityUtils.toString(response.getEntity(), "UTF-8");
+ System.out.println(content);
+ }
+ } finally {
+ if (response != null) {
+ response.close();
+ }
+ httpclient.close();
+ }
+ }
+```
+
+#### 5.6 Granted permission
+
+ * Granted permissions include project permissions, resource permissions, data source permissions, UDF function permissions.
+ * The administrator can authorize the projects, resources, data sources and UDF functions not created by ordinary users. Because the authorization methods for projects, resources, data sources and UDF functions are the same, we take project authorization as an example.
+ * Note: For projects created by users themselves, the user has all permissions. The project list and the selected project list will not be displayed.
+
+- The administrator enters the Security Center -> User Management page and clicks the "Authorize" button of the user who needs to be authorized, as shown in the figure below:
+ <p align="center">
+ <img src="/img/auth-en.png" width="80%" />
+</p>
+
+- Select the project to authorize the project.
+
+<p align="center">
+ <img src="/img/authproject-en.png" width="80%" />
+ </p>
+
+- Resources, data sources, and UDF function authorization are the same as project authorization.
+
+### 6. monitoring Center
+
+#### 6.1 Service management
+
+- Service management is mainly to monitor and display the health status and basic information of each service in the system
+
+#### 6.1.1 master monitoring
+
+- Mainly related to master information.
+<p align="center">
+ <img src="/img/master-jk-en.png" width="80%" />
+ </p>
+
+#### 6.1.2 worker monitoring
+
+- Mainly related to worker information.
+
+<p align="center">
+ <img src="/img/worker-jk-en.png" width="80%" />
+ </p>
+
+#### 6.1.3 Zookeeper monitoring
+
+- Mainly related configuration information of each worker and master in zookpeeper.
+
+<p align="center">
+ <img src="/img/zookeeper-monitor-en.png" width="80%" />
+ </p>
+
+#### 6.1.4 DB monitoring
+
+- Mainly the health of the DB
+
+<p align="center">
+ <img src="/img/mysql-jk-en.png" width="80%" />
+ </p>
+
+#### 6.2 Statistics management
+
+<p align="center">
+ <img src="/img/statistics-en.png" width="80%" />
+ </p>
+
+- Number of commands to be executed: statistics on the t_ds_command table
+- The number of failed commands: statistics on the t_ds_error_command table
+- Number of tasks to run: Count the data of task_queue in Zookeeper
+- Number of tasks to be killed: Count the data of task_kill in Zookeeper
+
+### 7. <span id=TaskParamers>Task node type and parameter settings</span>
+
+#### 7.1 Shell node
+
+> Shell node, when the worker is executed, a temporary shell script is generated, and the linux user with the same name as the tenant executes the script.
+
+- Click Project Management-Project Name-Workflow Definition, and click the "Create Workflow" button to enter the DAG editing page.
+- Drag <img src="/img/shell.png" width="35"/> from the toolbar to the drawing board, as shown in the figure below:
+
+ <p align="center">
+ <img src="/img/shell-en.png" width="80%" />
+ </p>
+
+- Node name: The node name in a workflow definition is unique.
+- Run flag: Identifies whether this node can be scheduled normally, if it does not need to be executed, you can turn on the prohibition switch.
+- Descriptive information: describe the function of the node.
+- Task priority: When the number of worker threads is insufficient, they are executed in order from high to low, and when the priority is the same, they are executed according to the first-in first-out principle.
+- Worker grouping: Tasks are assigned to the machines of the worker group to execute. If Default is selected, a worker machine will be randomly selected for execution.
+- Number of failed retry attempts: The number of times the task failed to be resubmitted. It supports drop-down and hand-filling.
+- Failed retry interval: The time interval for resubmitting the task after a failed task. It supports drop-down and hand-filling.
+- Timeout alarm: Check the timeout alarm and timeout failure. When the task exceeds the "timeout period", an alarm email will be sent and the task execution will fail.
+- Script: SHELL program developed by users.
+- Resource: Refers to the list of resource files that need to be called in the script, and the files uploaded or created by the resource center-file management.
+- User-defined parameters: It is a user-defined parameter that is part of SHELL, which will replace the content with \${variable} in the script.
+
+#### 7.2 Sub-process node
+
+- The sub-process node is to execute a certain external workflow definition as a task node.
+ > Drag the  task node in the toolbar to the drawing board, as shown in the following figure:
+
+<p align="center">
+ <img src="/img/sub-process-en.png" width="80%" />
+ </p>
+
+- Node name: The node name in a workflow definition is unique
+- Run flag: identify whether this node can be scheduled normally
+- Descriptive information: describe the function of the node
+- Timeout alarm: Check the timeout alarm and timeout failure. When the task exceeds the "timeout period", an alarm email will be sent and the task execution will fail.
+- Sub-node: It is the workflow definition of the selected sub-process. Enter the sub-node in the upper right corner to jump to the workflow definition of the selected sub-process
+
+#### 7.3 DEPENDENT node
+
+- Dependent nodes are **dependency check nodes**. For example, process A depends on the successful execution of process B yesterday, and the dependent node will check whether process B has a successful execution yesterday.
+
+> Drag the  task node in the toolbar to the drawing board, as shown in the following figure:
+
+<p align="center">
+ <img src="/img/dependent-nodes-en.png" width="80%" />
+ </p>
+
+> The dependent node provides a logical judgment function, such as checking whether the B process was successful yesterday, or whether the C process was executed successfully.
+
+ <p align="center">
+ <img src="/img/depend-node-en.png" width="80%" />
+ </p>
+
+> For example, process A is a weekly report task, processes B and C are daily tasks, and task A requires tasks B and C to be successfully executed every day of the last week, as shown in the figure:
+
+ <p align="center">
+ <img src="/img/depend-node1-en.png" width="80%" />
+ </p>
+
+> If the weekly report A also needs to be executed successfully last Tuesday:
+
+ <p align="center">
+ <img src="/img/depend-node3-en.png" width="80%" />
+ </p>
+
+#### 7.4 Stored procedure node
+
+- According to the selected data source, execute the stored procedure.
+ > Drag in the toolbarThe task node to the drawing board, as shown in the following figure:
+
+<p align="center">
+ <img src="/img/procedure-en.png" width="80%" />
+ </p>
+
+- Data source: The data source type of the stored procedure supports MySQL and POSTGRESQL, select the corresponding data source
+- Method: is the method name of the stored procedure
+- Custom parameters: The custom parameter types of the stored procedure support IN and OUT, and the data types support nine data types: VARCHAR, INTEGER, LONG, FLOAT, DOUBLE, DATE, TIME, TIMESTAMP, and BOOLEAN
+
+#### 7.5 SQL node
+
+- Drag in the toolbarTask node into the drawing board
+- Non-query SQL function: edit non-query SQL task information, select non-query for sql type, as shown in the figure below:
+ <p align="center">
+ <img src="/img/sql-en.png" width="80%" />
+</p>
+
+- Query SQL function: Edit and query SQL task information, sql type selection query, select form or attachment to send mail to the specified recipient, as shown in the figure below.
+
+<p align="center">
+ <img src="/img/sql-node-en.png" width="80%" />
+ </p>
+
+- Data source: select the corresponding data source
+- sql type: supports query and non-query. The query is a select type query, which is returned with a result set. You can specify three templates for email notification as form, attachment or form attachment. Non-queries are returned without a result set, and are for three types of operations: update, delete, and insert.
+- sql parameter: the input parameter format is key1=value1;key2=value2...
+- sql statement: SQL statement
+- UDF function: For data sources of type HIVE, you can refer to UDF functions created in the resource center. UDF functions are not supported for other types of data sources.
+- Custom parameters: SQL task type, and stored procedure is a custom parameter order to set values for the method. The custom parameter type and data type are the same as the stored procedure task type. The difference is that the SQL task type custom parameter will replace the \${variable} in the SQL statement.
+- Pre-sql: Pre-sql is executed before the sql statement.
+- Post-sql: Post-sql is executed after the sql statement.
+
+#### 7.6 SPARK node
+
+- Through the SPARK node, you can directly execute the SPARK program. For the spark node, the worker will use the `spark-submit` method to submit tasks
+
+> Drag in the toolbarThe task node to the drawing board, as shown in the following figure:
+
+<p align="center">
+ <img src="/img/spark-submit-en.png" width="80%" />
+ </p>
+
+- Program type: supports JAVA, Scala and Python three languages
+- The class of the main function: is the full path of the Spark program’s entry Main Class
+- Main jar package: Spark jar package
+- Deployment mode: support three modes of yarn-cluster, yarn-client and local
+- Driver core number: You can set the number of Driver cores and the number of memory
+- Number of Executors: You can set the number of Executors, the number of Executor memory, and the number of Executor cores
+- Command line parameters: Set the input parameters of the Spark program and support the substitution of custom parameter variables.
+- Other parameters: support --jars, --files, --archives, --conf format
+- Resource: If the resource file is referenced in other parameters, you need to select and specify in the resource
+- User-defined parameter: It is a user-defined parameter of the MR part, which will replace the content with \${variable} in the script
+
+Note: JAVA and Scala are only used for identification, there is no difference, if it is Spark developed by Python, there is no main function class, and the others are the same
+
+#### 7.7 MapReduce(MR) node
+
+- Using the MR node, you can directly execute the MR program. For the mr node, the worker will use the `hadoop jar` method to submit tasks
+
+> Drag the  task node in the toolbar to the drawing board, as shown in the following figure:
+
+1. JAVA program
+
+ <p align="center">
+ <img src="/img/mr_java_en.png" width="80%" />
+ </p>
+
+- The class of the main function: is the full path of the Main Class, the entry point of the MR program
+- Program type: select JAVA language
+- Main jar package: is the MR jar package
+- Command line parameters: set the input parameters of the MR program and support the substitution of custom parameter variables
+- Other parameters: support -D, -files, -libjars, -archives format
+- Resource: If the resource file is referenced in other parameters, you need to select and specify in the resource
+- User-defined parameter: It is a user-defined parameter of the MR part, which will replace the content with \${variable} in the script
+
+2. Python program
+
+<p align="center">
+ <img src="/img/mr_edit_en.png" width="80%" />
+ </p>
+
+- Program type: select Python language
+- Main jar package: is the Python jar package for running MR
+- Other parameters: support -D, -mapper, -reducer, -input -output format, here you can set the input of user-defined parameters, such as:
+- -mapper "mapper.py 1" -file mapper.py -reducer reducer.py -file reducer.py –input /journey/words.txt -output /journey/out/mr/\${currentTimeMillis}
+- The mapper.py 1 after -mapper is two parameters, the first parameter is mapper.py, and the second parameter is 1
+- Resource: If the resource file is referenced in other parameters, you need to select and specify in the resource
+- User-defined parameter: It is a user-defined parameter of the MR part, which will replace the content with \${variable} in the script
+
+#### 7.8 Python Node
+
+- Using python nodes, you can directly execute python scripts. For python nodes, workers will use `python **` to submit tasks.
+
+> Drag in the toolbarThe task node to the drawing board, as shown in the following figure:
+
+<p align="center">
+ <img src="/img/python-en.png" width="80%" />
+ </p>
+
+- Script: Python program developed by the user
+- Resources: refers to the list of resource files that need to be called in the script
+- User-defined parameter: It is a local user-defined parameter of Python, which will replace the content with \${variable} in the script
+
+#### 7.9 Flink Node
+
+- Drag in the toolbar<img src="/img/flink.png" width="35"/>The task node to the drawing board, as shown in the following figure:
+
+<p align="center">
+ <img src="/img/flink-en.png" width="80%" />
+</p>
+
+- Program type: supports JAVA, Scala and Python three languages
+- The class of the main function: is the full path of the Main Class, the entry point of the Flink program
+- Main jar package: is the Flink jar package
+- Deployment mode: support three modes of cluster and local
+- Number of slots: You can set the number of slots
+- Number of taskManage: You can set the number of taskManage
+- JobManager memory number: You can set the jobManager memory number
+- TaskManager memory number: You can set the taskManager memory number
+- Command line parameters: Set the input parameters of the Spark program and support the substitution of custom parameter variables.
+- Other parameters: support --jars, --files, --archives, --conf format
+- Resource: If the resource file is referenced in other parameters, you need to select and specify in the resource
+- Custom parameter: It is a local user-defined parameter of Flink, which will replace the content with \${variable} in the script
+
+Note: JAVA and Scala are only used for identification, there is no difference, if it is Flink developed by Python, there is no class of the main function, the others are the same
+
+#### 7.10 http Node
+
+- Drag in the toolbar<img src="/img/http.png" width="35"/>The task node to the drawing board, as shown in the following figure:
Review comment:
```suggestion
- Drag in the toolbar<img src="/img/http.png" width="35"/> task node to the drawing board, as shown in the following figure:
```
##########
File path: docs/en-us/1.3.2/user_doc/system-manual.md
##########
@@ -0,0 +1,886 @@
+# System User Manual
+
+## Get started quickly
+
+> Please refer to [Quick Start](quick-start.html)
+
+## Operation guide
+
+### 1. Home
+
+The home page contains task status statistics, process status statistics, and workflow definition statistics for all projects of the user.
+
+<p align="center">
+<img src="/img/home_en.png" width="80%" />
+</p>
+
+### 2. Project management
+
+#### 2.1 Create project
+
+- Click "Project Management" to enter the project management page, click the "Create Project" button, enter the project name, project description, and click "Submit" to create a new project.
+
+ <p align="center">
+ <img src="/img/create_project_en1.png" width="80%" />
+ </p>
+
+#### 2.2 Project home
+
+- Click the project name link on the project management page to enter the project home page, as shown in the figure below, the project home page contains the task status statistics, process status statistics, and workflow definition statistics of the project.
+ <p align="center">
+ <img src="/img/project_home_en.png" width="80%" />
+ </p>
+
+- Task status statistics: within the specified time range, count the number of task instances as successful submission, running, ready to pause, pause, ready to stop, stop, failure, success, fault tolerance, kill, and waiting threads
+- Process status statistics: within the specified time range, count the number of the status of the workflow instance as submission success, running, ready to pause, pause, ready to stop, stop, failure, success, fault tolerance, kill, and waiting threads
+- Workflow definition statistics: Count the workflow definitions created by this user and the workflow definitions granted to this user by the administrator
+
+#### 2.3 Workflow definition
+
+#### <span id=creatDag>2.3.1 Create workflow definition</span>
+
+- Click Project Management -> Workflow -> Workflow Definition to enter the workflow definition page, and click the "Create Workflow" button to enter the **workflow DAG edit** page, as shown in the following figure:
+ <p align="center">
+ <img src="/img/dag5.png" width="80%" />
+ </p>
+- Drag in the toolbar <img src="/img/shell.png" width="35"/> Add a Shell task to the drawing board, as shown in the figure below:
+ <p align="center">
+ <img src="/img/shell-en.png" width="80%" />
+ </p>
+- **Add parameter settings for this shell task:**
+
+1. Fill in the "Node Name", "Description", and "Script" fields;
+2. Check “Normal” for “Run Flag”. If “Prohibit Execution” is checked, the task will not be executed when the workflow runs;
+3. Select "Task Priority": When the number of worker threads is insufficient, high-level tasks will be executed first in the execution queue, and tasks with the same priority will be executed in the order of first in, first out;
+4. Timeout alarm (optional): Check the timeout alarm, timeout failure, and fill in the "timeout period". When the task execution time exceeds **timeout period**, an alert email will be sent and the task timeout fails;
+5. Resources (optional). Resource files are files created or uploaded on the Resource Center -> File Management page. For example, the file name is `test.sh`, and the command to call the resource in the script is `sh test.sh`;
+6. Custom parameters (optional), refer to [Custom Parameters](#UserDefinedParameters);
+7. Click the "Confirm Add" button to save the task settings.
+
+- **Increase the order of task execution:** Click the icon in the upper right corner <img src="/img/line.png" width="35"/> to connect the task; as shown in the figure below, task 2 and task 3 are executed in parallel, When task 1 finished execute, tasks 2 and 3 will be executed simultaneously.
+
+ <p align="center">
+ <img src="/img/dag6.png" width="80%" />
+ </p>
+
+- **Delete dependencies:** Click the "arrow" icon in the upper right corner <img src="/img/arrow.png" width="35"/>, select the connection line, and click the "Delete" icon in the upper right corner <img src= "/img/delete.png" width="35"/>, delete dependencies between tasks.
+ <p align="center">
+ <img src="/img/dag7.png" width="80%" />
+ </p>
+
+- **Save workflow definition:** Click the "Save" button, and the "Set DAG chart name" pop-up box will pop up, as shown in the figure below. Enter the workflow definition name, workflow definition description, and set global parameters (optional, refer to [ Custom parameters](#UserDefinedParameters)), click the "Add" button, and the workflow definition is created successfully.
+ <p align="center">
+ <img src="/img/dag8.png" width="80%" />
+ </p>
+> For other types of tasks, please refer to [Task Node Type and Parameter Settings](#TaskParamers).
+
+#### 2.3.2 Workflow definition operation function
+
+Click Project Management -> Workflow -> Workflow Definition to enter the workflow definition page, as shown below:
+
+<p align="center">
+<img src="/img/work_list_en.png" width="80%" />
+</p>
+The operation functions of the workflow definition list are as follows:
+
+- **Edit:** Only "offline" workflow definitions can be edited. Workflow DAG editing is the same as [Create Workflow Definition](#creatDag).
+- **Online:** When the workflow status is "Offline", used to online workflow. Only the workflow in the "Online" state can run, but cannot be edited.
+- **Offline:** When the workflow status is "Online", used to offline workflow. Only the workflow in the "Offline" state can be edited, but not run.
+- **Run:** Only workflow in the online state can run. See [2.3.3 Run Workflow](#runWorkflow) for the operation steps
+- **Timing:** Timing can only be set in online workflows, and the system automatically schedules the workflow to run on a regular basis. The status after creating a timing is "offline", and the timing must be online on the timing management page to take effect. See [2.3.4 Workflow Timing](#creatTiming) for timing operation steps.
+- **Timing Management:** The timing management page can be edited, online/offline, and deleted.
+- **Delete:** Delete the workflow definition.
+- **Download:** Download workflow definition to local.
+- **Tree Diagram:** Display the task node type and task status in a tree structure, as shown in the figure below:
+ <p align="center">
+ <img src="/img/tree_en.png" width="80%" />
+ </p>
+
+#### <span id=runWorkflow>2.3.3 Run the workflow</span>
+
+- Click Project Management -> Workflow -> Workflow Definition to enter the workflow definition page, as shown in the figure below, click the "Go Online" button <img src="/img/online.png" width="35"/>,Go online workflow.
+ <p align="center">
+ <img src="/img/work_list_en.png" width="80%" />
+ </p>
+
+- Click the "Run" button to pop up the startup parameter setting pop-up box, as shown in the figure below, set the startup parameters, click the "Run" button in the pop-up box, the workflow starts running, and the workflow instance page generates a workflow instance.
+ <p align="center">
+ <img src="/img/run_work_en.png" width="80%" />
+ </p>
+ <span id=runParamers>Description of workflow operating parameters:</span>
+
+ * Failure strategy: When a task node fails to execute, other parallel task nodes need to execute the strategy. "Continue" means: after a certain task fails, other task nodes execute normally; "End" means: terminate all tasks being executed, and terminate the entire process.
+ * Notification strategy: When the process is over, the process execution information notification email is sent according to the process status, including any status is not sent, successful sent, failed sent, successful or failed sent.
+ * Process priority: The priority of process operation, divided into five levels: highest (HIGHEST), high (HIGH), medium (MEDIUM), low (LOW), and lowest (LOWEST). When the number of master threads is insufficient, high-level processes will be executed first in the execution queue, and processes with the same priority will be executed in a first-in first-out order.
+ * Worker group: The process can only be executed in the specified worker machine group. The default is Default, which can be executed on any worker.
+ * Notification group: select notification strategy||timeout alarm||when fault tolerance occurs, process information or email will be sent to all members in the notification group.
+ * Recipient: Select notification policy||Timeout alarm||When fault tolerance occurs, process information or alarm email will be sent to the recipient list.
+ * Cc: Select the notification strategy||Timeout alarm||When fault tolerance occurs, the process information or warning email will be copied to the CC list.
+ * Complement: Two modes including serial complement and parallel complement. Serial complement: within the specified time range, the complement is executed sequentially from the start date to the end date, and only one process instance is generated; parallel complement: within the specified time range, multiple days are complemented at the same time to generate N process instances.
+ * For example, you need to fill in the data from May 1 to May 10.
+
+ <p align="center">
+ <img src="/img/complement_en1.png" width="80%" />
+ </p>
+
+ > Serial mode: The complement is executed sequentially from May 1 to May 10, and a process instance is generated on the process instance page;
+
+ > Parallel mode: The tasks from May 1 to may 10 are executed simultaneously, and 10 process instances are generated on the process instance page.
+
+#### <span id=creatTiming>2.3.4 Workflow timing</span>
+
+- Create timing: Click Project Management->Workflow->Workflow Definition, enter the workflow definition page, go online the workflow, click the "timing" button <img src="/img/timing.png" width="35"/> ,The timing parameter setting dialog box pops up, as shown in the figure below:
+ <p align="center">
+ <img src="/img/time_schedule_en.png" width="80%" />
+ </p>
+- Choose the start and end time. In the start and end time range, the workflow is run at regular intervals; not in the start and end time range, no more regular workflow instances are generated.
+- Add a timing that is executed once every day at 5 AM, as shown in the following figure:
+ <p align="center">
+ <img src="/img/timer-en.png" width="80%" />
+ </p>
+- Failure strategy, notification strategy, process priority, worker group, notification group, recipient, and CC are the same as [workflow running parameters](#runParamers).
+- Click the "Create" button to create the timing successfully. At this time, the timing status is "**Offline**" and the timing needs to be **Online** to take effect.
+- Timing online: Click the "timing management" button <img src="/img/timeManagement.png" width="35"/>, enter the timing management page, click the "online" button, the timing status will change to "online", as shown in the below figure, the workflow takes effect regularly.
+ <p align="center">
+ <img src="/img/time-manage-list-en.png" width="80%" />
+ </p>
+
+#### 2.3.5 Import workflow
+
+Click Project Management -> Workflow -> Workflow Definition to enter the workflow definition page, click the "Import Workflow" button to import the local workflow file, the workflow definition list displays the imported workflow, and the status is offline.
+
+#### 2.4 Workflow instance
+
+#### 2.4.1 View workflow instance
+
+- Click Project Management -> Workflow -> Workflow Instance to enter the Workflow Instance page, as shown in the figure below:
+ <p align="center">
+ <img src="/img/instance-list-en.png" width="80%" />
+ </p>
+- Click the workflow name to enter the DAG view page to view the task execution status, as shown in the figure below.
+ <p align="center">
+ <img src="/img/instance-runs-en.png" width="80%" />
+ </p>
+
+#### 2.4.2 View task log
+
+- Enter the workflow instance page, click the workflow name, enter the DAG view page, double-click the task node, as shown in the following figure:
+ <p align="center">
+ <img src="/img/instanceViewLog-en.png" width="80%" />
+ </p>
+- Click "View Log", a log pop-up box will pop up, as shown in the figure below, the task log can also be viewed on the task instance page, refer to [Task View Log](#taskLog)。
+ <p align="center">
+ <img src="/img/task-log-en.png" width="80%" />
+ </p>
+
+#### 2.4.3 View task history
+
+- Click Project Management -> Workflow -> Workflow Instance to enter the workflow instance page, and click the workflow name to enter the workflow DAG page;
+- Double-click the task node, as shown in the figure below, click "View History" to jump to the task instance page, and display a list of task instances running by the workflow instance
+ <p align="center">
+ <img src="/img/task_history_en.png" width="80%" />
+ </p>
+
+#### 2.4.4 View operating parameters
+
+- Click Project Management -> Workflow -> Workflow Instance to enter the workflow instance page, and click the workflow name to enter the workflow DAG page;
+- Click the icon in the upper left corner <img src="/img/run_params_button.png" width="35"/>,View the startup parameters of the workflow instance; click the icon <img src="/img/global_param.png" width="35"/>,View the global and local parameters of the workflow instance, as shown in the following figure:
+ <p align="center">
+ <img src="/img/run_params_en.png" width="80%" />
+ </p>
+
+#### 2.4.4 Workflow instance operation function
+
+Click Project Management -> Workflow -> Workflow Instance to enter the Workflow Instance page, as shown in the figure below:
+
+ <p align="center">
+ <img src="/img/instance-list-en.png" width="80%" />
+ </p>
+
+- **Edit:** Only terminated processes can be edited. Click the "Edit" button or the name of the workflow instance to enter the DAG edit page. After edit, click the "Save" button to pop up the Save DAG pop-up box, as shown in the figure below. In the pop-up box, check "Whether to update to workflow definition" and save After that, the workflow definition will be updated; if it is not checked, the workflow definition will not be updated.
+ <p align="center">
+ <img src="/img/editDag-en.png" width="80%" />
+ </p>
+- **Rerun:** Re-execute the terminated process.
+- **Recovery failed:** For failed processes, you can perform recovery operations, starting from the failed node.
+- **Stop:** To **stop** the running process, the background will first `kill`worker process, and then execute `kill -9` operation
+- **Pause:** Perform a **pause** operation on the running process, the system status will change to **waiting for execution**, it will wait for the end of the task being executed, and pause the next task to be executed.
+- **Resume pause:** To resume the paused process, start running directly from the **paused node**
+- **Delete:** Delete the workflow instance and the task instance under the workflow instance
+- **Gantt chart:** The vertical axis of the Gantt chart is the topological sorting of task instances under a certain workflow instance, and the horizontal axis is the running time of the task instances, as shown in the figure:
+ <p align="center">
+ <img src="/img/gantt-en.png" width="80%" />
+ </p>
+
+#### 2.5 Task instance
+
+- Click Project Management -> Workflow -> Task Instance to enter the task instance page, as shown in the figure below, click the name of the workflow instance, you can jump to the workflow instance DAG chart to view the task status.
+ <p align="center">
+ <img src="/img/task-list-en.png" width="80%" />
+ </p>
+
+- <span id=taskLog>View log:</span>Click the "view log" button in the operation column to view the log of task execution.
+ <p align="center">
+ <img src="/img/task-log2-en.png" width="80%" />
+ </p>
+
+### 3. Resource Center
+
+#### 3.1 hdfs resource configuration
+
+- Upload resource files and udf functions, all uploaded files and resources will be stored on hdfs, so the following configuration items are required:
+
+```
+
+conf/common/common.properties
+ # Users who have permission to create directories under the HDFS root path
+ hdfs.root.user=hdfs
+ # data base dir, resource file will store to this hadoop hdfs path, self configuration, please make sure the directory exists on hdfs and have read write permissions。"/escheduler" is recommended
+ data.store2hdfs.basepath=/dolphinscheduler
+ # resource upload startup type : HDFS,S3,NONE
+ res.upload.startup.type=HDFS
+ # whether kerberos starts
+ hadoop.security.authentication.startup.state=false
+ # java.security.krb5.conf path
+ java.security.krb5.conf.path=/opt/krb5.conf
+ # loginUserFromKeytab user
+ login.user.keytab.username=hdfs-mycluster@ESZ.COM
+ # loginUserFromKeytab path
+ login.user.keytab.path=/opt/hdfs.headless.keytab
+
+conf/common/hadoop.properties
+ # ha or single namenode,If namenode ha needs to copy core-site.xml and hdfs-site.xml
+ # to the conf directory,support s3,for example : s3a://dolphinscheduler
+ fs.defaultFS=hdfs://mycluster:8020
+ #resourcemanager ha note this need ips , this empty if single
+ yarn.resourcemanager.ha.rm.ids=192.168.xx.xx,192.168.xx.xx
+ # If it is a single resourcemanager, you only need to configure one host name. If it is resourcemanager HA, the default configuration is fine
+ yarn.application.status.address=http://xxxx:8088/ws/v1/cluster/apps/%s
+
+```
+
+- Only one address needs to be configured for yarn.resourcemanager.ha.rm.ids and yarn.application.status.address, and the other address is empty.
+- You need to copy core-site.xml and hdfs-site.xml from the conf directory of the Hadoop cluster to the conf directory of the dolphinscheduler project, and restart the api-server service.
+
+#### 3.2 File management
+
+> It is the management of various resource files, including creating basic txt/log/sh/conf/py/java and other files, uploading jar packages and other types of files, and can do edit, rename, download, delete and other operations.
+
+ <p align="center">
+ <img src="/img/file-manage-en.png" width="80%" />
+ </p>
+
+- Create a file
+ > The file format supports the following types: txt, log, sh, conf, cfg, py, java, sql, xml, hql, properties
+
+<p align="center">
+ <img src="/img/file_create_en.png" width="80%" />
+ </p>
+
+- upload files
+
+> Upload file: Click the "Upload File" button to upload, drag the file to the upload area, the file name will be automatically completed with the uploaded file name
+
+<p align="center">
+ <img src="/img/file-upload-en.png" width="80%" />
+ </p>
+
+- File View
+
+> For the file types that can be viewed, click the file name to view the file details
+
+<p align="center">
+ <img src="/img/file_detail_en.png" width="80%" />
+ </p>
+
+- download file
+
+> Click the "Download" button in the file list to download the file or click the "Download" button in the upper right corner of the file details to download the file
+
+- File rename
+
+<p align="center">
+ <img src="/img/file_rename_en.png" width="80%" />
+ </p>
+
+- delete
+ > File list -> Click the "Delete" button to delete the specified file
+
+#### 3.3 UDF management
+
+#### 3.3.1 Resource management
+
+> The resource management and file management functions are similar. The difference is that the resource management is the uploaded UDF function, and the file management uploads the user program, script and configuration file.
+> Operation function: rename, download, delete.
+
+- Upload udf resources
+ > Same as uploading files.
+
+#### 3.3.2 Function management
+
+- Create UDF function
+ > Click "Create UDF Function", enter the udf function parameters, select the udf resource, and click "Submit" to create the udf function.
+
+> Currently only supports temporary UDF functions of HIVE
+
+- UDF function name: the name when the UDF function is entered
+- Package name Class name: Enter the full path of the UDF function
+- UDF resource: Set the resource file corresponding to the created UDF
+
+<p align="center">
+ <img src="/img/udf_edit_en.png" width="80%" />
+ </p>
+
+### 4. Create data source
+
+> Data source center supports MySQL, POSTGRESQL, HIVE/IMPALA, SPARK, CLICKHOUSE, ORACLE, SQLSERVER and other data sources
+
+#### 4.1 Create/Edit MySQL data source
+
+- Click "Data Source Center -> Create Data Source" to create different types of data sources according to requirements.
+
+- Data source: select MYSQL
+- Data source name: enter the name of the data source
+- Description: Enter a description of the data source
+- IP hostname: enter the IP to connect to MySQL
+- Port: Enter the port to connect to MySQL
+- Username: Set the username for connecting to MySQL
+- Password: Set the password for connecting to MySQL
+- Database name: Enter the name of the database connected to MySQL
+- Jdbc connection parameters: parameter settings for MySQL connection, filled in in JSON form
+
+<p align="center">
+ <img src="/img/mysql-en.png" width="80%" />
+ </p>
+
+> Click "Test Connection" to test whether the data source can be successfully connected.
+
+#### 4.2 Create/Edit POSTGRESQL data source
+
+- Data source: select POSTGRESQL
+- Data source name: enter the name of the data source
+- Description: Enter a description of the data source
+- IP/Host Name: Enter the IP to connect to POSTGRESQL
+- Port: Enter the port to connect to POSTGRESQL
+- Username: Set the username for connecting to POSTGRESQL
+- Password: Set the password for connecting to POSTGRESQL
+- Database name: Enter the name of the database connected to POSTGRESQL
+- Jdbc connection parameters: parameter settings for POSTGRESQL connection, filled in in JSON form
+
+<p align="center">
+ <img src="/img/postgresql-en.png" width="80%" />
+ </p>
+
+#### 4.3 Create/Edit HIVE data source
+
+1.Use HiveServer2 to connect
+
+ <p align="center">
+ <img src="/img/hive-en.png" width="80%" />
+ </p>
+
+- Data source: select HIVE
+- Data source name: enter the name of the data source
+- Description: Enter a description of the data source
+- IP/Host Name: Enter the IP connected to HIVE
+- Port: Enter the port connected to HIVE
+- Username: Set the username for connecting to HIVE
+- Password: Set the password for connecting to HIVE
+- Database name: Enter the name of the database connected to HIVE
+- Jdbc connection parameters: parameter settings for HIVE connection, filled in in JSON form
+
+ 2.Use HiveServer2 HA Zookeeper to connect
+
+ <p align="center">
+ <img src="/img/hive1-en.png" width="80%" />
+ </p>
+
+Note: If you enable **kerberos**, you need to fill in **Principal**
+
+<p align="center">
+ <img src="/img/hive-en.png" width="80%" />
+ </p>
+
+#### 4.4 Create/Edit Spark data source
+
+<p align="center">
+ <img src="/img/spark-en.png" width="80%" />
+ </p>
+
+- Data source: select Spark
+- Data source name: enter the name of the data source
+- Description: Enter a description of the data source
+- IP/Hostname: Enter the IP connected to Spark
+- Port: Enter the port connected to Spark
+- Username: Set the username for connecting to Spark
+- Password: Set the password for connecting to Spark
+- Database name: Enter the name of the database connected to Spark
+- Jdbc connection parameters: parameter settings for Spark connection, filled in in JSON form
+
+### 5. Security Center (Permission System)
+
+ * Only the administrator account in the security center has the authority to operate. It has functions such as queue management, tenant management, user management, alarm group management, worker group management, token management, etc. In the user management module, resources, data sources, projects, etc. Authorization
+ * Administrator login, default user name and password: admin/dolphinscheduler123
+
+#### 5.1 Create queue
+
+- Queue is used when the "queue" parameter is needed to execute programs such as spark and mapreduce.
+- The administrator enters the Security Center->Queue Management page and clicks the "Create Queue" button to create a queue.
+<p align="center">
+ <img src="/img/create-queue-en.png" width="80%" />
+ </p>
+
+#### 5.2 Add tenant
+
+- The tenant corresponds to the Linux user, which is used by the worker to submit the job. If Linux does not have this user, the worker will create this user when executing the script.
+- Tenant Code: **Tenant Code is the only user on Linux and cannot be repeated**
+- The administrator enters the Security Center->Tenant Management page and clicks the "Create Tenant" button to create a tenant.
+
+ <p align="center">
+ <img src="/img/addtenant-en.png" width="80%" />
+ </p>
+
+#### 5.3 Create normal user
+
+- Users are divided into **administrator users** and **normal users**
+
+ - The administrator has authorization and user management authority, but does not have the authority to create project and workflow definition operations.
+ - Ordinary users can create projects and create, edit, and execute workflow definitions.
+ - Note: If the user switches tenants, all resources under the tenant where the user belongs will be copied to the new tenant that is switched.
+
+- The administrator enters the Security Center -> User Management page and clicks the "Create User" button to create a user.
+<p align="center">
+ <img src="/img/user-en.png" width="80%" />
+ </p>
+
+> **Edit user information**
+
+- The administrator enters the Security Center->User Management page and clicks the "Edit" button to edit user information.
+- After an ordinary user logs in, click the user information in the user name drop-down box to enter the user information page, and click the "Edit" button to edit the user information.
+
+> **Modify user password**
+
+- The administrator enters the Security Center->User Management page and clicks the "Edit" button. When editing user information, enter the new password to modify the user password.
+- After a normal user logs in, click the user information in the user name drop-down box to enter the password modification page, enter the password and confirm the password and click the "Edit" button, then the password modification is successful.
+
+#### 5.4 Create alarm group
+
+- The alarm group is a parameter set at startup. After the process ends, the status of the process and other information will be sent to the alarm group in the form of email.
+
+* The administrator enters the Security Center -> Alarm Group Management page and clicks the "Create Alarm Group" button to create an alarm group.
+
+ <p align="center">
+ <img src="/img/mail-en.png" width="80%" />
+
+#### 5.5 Token management
+
+> Since the back-end interface has login check, token management provides a way to perform various operations on the system by calling the interface.
+
+- The administrator enters the Security Center -> Token Management page, clicks the "Create Token" button, selects the expiration time and user, clicks the "Generate Token" button, and clicks the "Submit" button, then the selected user's token is created successfully.
+
+ <p align="center">
+ <img src="/img/create-token-en.png" width="80%" />
+ </p>
+
+ - After an ordinary user logs in, click the user information in the user name drop-down box, enter the token management page, select the expiration time, click the "generate token" button, and click the "submit" button, then the user creates a token successfully.
+ - Call example:
+
+```
+Token call example
+ /**
+ * test token
+ */
+ public void doPOSTParam()throws Exception{
+ // create HttpClient
+ CloseableHttpClient httpclient = HttpClients.createDefault();
+
+ // create http post request
+ HttpPost httpPost = new HttpPost("http://127.0.0.1:12345/escheduler/projects/create");
+ httpPost.setHeader("token", "123");
+ // set parameters
+ List<NameValuePair> parameters = new ArrayList<NameValuePair>();
+ parameters.add(new BasicNameValuePair("projectName", "qzw"));
+ parameters.add(new BasicNameValuePair("desc", "qzw"));
+ UrlEncodedFormEntity formEntity = new UrlEncodedFormEntity(parameters);
+ httpPost.setEntity(formEntity);
+ CloseableHttpResponse response = null;
+ try {
+ // execute
+ response = httpclient.execute(httpPost);
+ // response status code 200
+ if (response.getStatusLine().getStatusCode() == 200) {
+ String content = EntityUtils.toString(response.getEntity(), "UTF-8");
+ System.out.println(content);
+ }
+ } finally {
+ if (response != null) {
+ response.close();
+ }
+ httpclient.close();
+ }
+ }
+```
+
+#### 5.6 Granted permission
+
+ * Granted permissions include project permissions, resource permissions, data source permissions, UDF function permissions.
+ * The administrator can authorize the projects, resources, data sources and UDF functions not created by ordinary users. Because the authorization methods for projects, resources, data sources and UDF functions are the same, we take project authorization as an example.
+ * Note: For projects created by users themselves, the user has all permissions. The project list and the selected project list will not be displayed.
+
+- The administrator enters the Security Center -> User Management page and clicks the "Authorize" button of the user who needs to be authorized, as shown in the figure below:
+ <p align="center">
+ <img src="/img/auth-en.png" width="80%" />
+</p>
+
+- Select the project to authorize the project.
+
+<p align="center">
+ <img src="/img/authproject-en.png" width="80%" />
+ </p>
+
+- Resources, data sources, and UDF function authorization are the same as project authorization.
+
+### 6. monitoring Center
+
+#### 6.1 Service management
+
+- Service management is mainly to monitor and display the health status and basic information of each service in the system
+
+#### 6.1.1 master monitoring
+
+- Mainly related to master information.
+<p align="center">
+ <img src="/img/master-jk-en.png" width="80%" />
+ </p>
+
+#### 6.1.2 worker monitoring
+
+- Mainly related to worker information.
+
+<p align="center">
+ <img src="/img/worker-jk-en.png" width="80%" />
+ </p>
+
+#### 6.1.3 Zookeeper monitoring
+
+- Mainly related configuration information of each worker and master in zookpeeper.
+
+<p align="center">
+ <img src="/img/zookeeper-monitor-en.png" width="80%" />
+ </p>
+
+#### 6.1.4 DB monitoring
+
+- Mainly the health of the DB
+
+<p align="center">
+ <img src="/img/mysql-jk-en.png" width="80%" />
+ </p>
+
+#### 6.2 Statistics management
+
+<p align="center">
+ <img src="/img/statistics-en.png" width="80%" />
+ </p>
+
+- Number of commands to be executed: statistics on the t_ds_command table
+- The number of failed commands: statistics on the t_ds_error_command table
+- Number of tasks to run: Count the data of task_queue in Zookeeper
+- Number of tasks to be killed: Count the data of task_kill in Zookeeper
+
+### 7. <span id=TaskParamers>Task node type and parameter settings</span>
+
+#### 7.1 Shell node
+
+> Shell node, when the worker is executed, a temporary shell script is generated, and the linux user with the same name as the tenant executes the script.
+
+- Click Project Management-Project Name-Workflow Definition, and click the "Create Workflow" button to enter the DAG editing page.
+- Drag <img src="/img/shell.png" width="35"/> from the toolbar to the drawing board, as shown in the figure below:
+
+ <p align="center">
+ <img src="/img/shell-en.png" width="80%" />
+ </p>
+
+- Node name: The node name in a workflow definition is unique.
+- Run flag: Identifies whether this node can be scheduled normally, if it does not need to be executed, you can turn on the prohibition switch.
+- Descriptive information: describe the function of the node.
+- Task priority: When the number of worker threads is insufficient, they are executed in order from high to low, and when the priority is the same, they are executed according to the first-in first-out principle.
+- Worker grouping: Tasks are assigned to the machines of the worker group to execute. If Default is selected, a worker machine will be randomly selected for execution.
+- Number of failed retry attempts: The number of times the task failed to be resubmitted. It supports drop-down and hand-filling.
+- Failed retry interval: The time interval for resubmitting the task after a failed task. It supports drop-down and hand-filling.
+- Timeout alarm: Check the timeout alarm and timeout failure. When the task exceeds the "timeout period", an alarm email will be sent and the task execution will fail.
+- Script: SHELL program developed by users.
+- Resource: Refers to the list of resource files that need to be called in the script, and the files uploaded or created by the resource center-file management.
+- User-defined parameters: It is a user-defined parameter that is part of SHELL, which will replace the content with \${variable} in the script.
+
+#### 7.2 Sub-process node
+
+- The sub-process node is to execute a certain external workflow definition as a task node.
+ > Drag the  task node in the toolbar to the drawing board, as shown in the following figure:
+
+<p align="center">
+ <img src="/img/sub-process-en.png" width="80%" />
+ </p>
+
+- Node name: The node name in a workflow definition is unique
+- Run flag: identify whether this node can be scheduled normally
+- Descriptive information: describe the function of the node
+- Timeout alarm: Check the timeout alarm and timeout failure. When the task exceeds the "timeout period", an alarm email will be sent and the task execution will fail.
+- Sub-node: It is the workflow definition of the selected sub-process. Enter the sub-node in the upper right corner to jump to the workflow definition of the selected sub-process
+
+#### 7.3 DEPENDENT node
+
+- Dependent nodes are **dependency check nodes**. For example, process A depends on the successful execution of process B yesterday, and the dependent node will check whether process B has a successful execution yesterday.
+
+> Drag the  task node in the toolbar to the drawing board, as shown in the following figure:
+
+<p align="center">
+ <img src="/img/dependent-nodes-en.png" width="80%" />
+ </p>
+
+> The dependent node provides a logical judgment function, such as checking whether the B process was successful yesterday, or whether the C process was executed successfully.
+
+ <p align="center">
+ <img src="/img/depend-node-en.png" width="80%" />
+ </p>
+
+> For example, process A is a weekly report task, processes B and C are daily tasks, and task A requires tasks B and C to be successfully executed every day of the last week, as shown in the figure:
+
+ <p align="center">
+ <img src="/img/depend-node1-en.png" width="80%" />
+ </p>
+
+> If the weekly report A also needs to be executed successfully last Tuesday:
+
+ <p align="center">
+ <img src="/img/depend-node3-en.png" width="80%" />
+ </p>
+
+#### 7.4 Stored procedure node
+
+- According to the selected data source, execute the stored procedure.
+ > Drag in the toolbarThe task node to the drawing board, as shown in the following figure:
+
+<p align="center">
+ <img src="/img/procedure-en.png" width="80%" />
+ </p>
+
+- Data source: The data source type of the stored procedure supports MySQL and POSTGRESQL, select the corresponding data source
+- Method: is the method name of the stored procedure
+- Custom parameters: The custom parameter types of the stored procedure support IN and OUT, and the data types support nine data types: VARCHAR, INTEGER, LONG, FLOAT, DOUBLE, DATE, TIME, TIMESTAMP, and BOOLEAN
+
+#### 7.5 SQL node
+
+- Drag in the toolbarTask node into the drawing board
+- Non-query SQL function: edit non-query SQL task information, select non-query for sql type, as shown in the figure below:
+ <p align="center">
+ <img src="/img/sql-en.png" width="80%" />
+</p>
+
+- Query SQL function: Edit and query SQL task information, sql type selection query, select form or attachment to send mail to the specified recipient, as shown in the figure below.
+
+<p align="center">
+ <img src="/img/sql-node-en.png" width="80%" />
+ </p>
+
+- Data source: select the corresponding data source
+- sql type: supports query and non-query. The query is a select type query, which is returned with a result set. You can specify three templates for email notification as form, attachment or form attachment. Non-queries are returned without a result set, and are for three types of operations: update, delete, and insert.
+- sql parameter: the input parameter format is key1=value1;key2=value2...
+- sql statement: SQL statement
+- UDF function: For data sources of type HIVE, you can refer to UDF functions created in the resource center. UDF functions are not supported for other types of data sources.
+- Custom parameters: SQL task type, and stored procedure is a custom parameter order to set values for the method. The custom parameter type and data type are the same as the stored procedure task type. The difference is that the SQL task type custom parameter will replace the \${variable} in the SQL statement.
+- Pre-sql: Pre-sql is executed before the sql statement.
+- Post-sql: Post-sql is executed after the sql statement.
+
+#### 7.6 SPARK node
+
+- Through the SPARK node, you can directly execute the SPARK program. For the spark node, the worker will use the `spark-submit` method to submit tasks
+
+> Drag in the toolbarThe task node to the drawing board, as shown in the following figure:
+
+<p align="center">
+ <img src="/img/spark-submit-en.png" width="80%" />
+ </p>
+
+- Program type: supports JAVA, Scala and Python three languages
+- The class of the main function: is the full path of the Spark program’s entry Main Class
+- Main jar package: Spark jar package
+- Deployment mode: support three modes of yarn-cluster, yarn-client and local
+- Driver core number: You can set the number of Driver cores and the number of memory
+- Number of Executors: You can set the number of Executors, the number of Executor memory, and the number of Executor cores
+- Command line parameters: Set the input parameters of the Spark program and support the substitution of custom parameter variables.
+- Other parameters: support --jars, --files, --archives, --conf format
+- Resource: If the resource file is referenced in other parameters, you need to select and specify in the resource
+- User-defined parameter: It is a user-defined parameter of the MR part, which will replace the content with \${variable} in the script
+
+Note: JAVA and Scala are only used for identification, there is no difference, if it is Spark developed by Python, there is no main function class, and the others are the same
+
+#### 7.7 MapReduce(MR) node
+
+- Using the MR node, you can directly execute the MR program. For the mr node, the worker will use the `hadoop jar` method to submit tasks
+
+> Drag the  task node in the toolbar to the drawing board, as shown in the following figure:
+
+1. JAVA program
+
+ <p align="center">
+ <img src="/img/mr_java_en.png" width="80%" />
+ </p>
+
+- The class of the main function: is the full path of the Main Class, the entry point of the MR program
+- Program type: select JAVA language
+- Main jar package: is the MR jar package
+- Command line parameters: set the input parameters of the MR program and support the substitution of custom parameter variables
+- Other parameters: support -D, -files, -libjars, -archives format
+- Resource: If the resource file is referenced in other parameters, you need to select and specify in the resource
+- User-defined parameter: It is a user-defined parameter of the MR part, which will replace the content with \${variable} in the script
+
+2. Python program
+
+<p align="center">
+ <img src="/img/mr_edit_en.png" width="80%" />
+ </p>
+
+- Program type: select Python language
+- Main jar package: is the Python jar package for running MR
+- Other parameters: support -D, -mapper, -reducer, -input -output format, here you can set the input of user-defined parameters, such as:
+- -mapper "mapper.py 1" -file mapper.py -reducer reducer.py -file reducer.py –input /journey/words.txt -output /journey/out/mr/\${currentTimeMillis}
+- The mapper.py 1 after -mapper is two parameters, the first parameter is mapper.py, and the second parameter is 1
+- Resource: If the resource file is referenced in other parameters, you need to select and specify in the resource
+- User-defined parameter: It is a user-defined parameter of the MR part, which will replace the content with \${variable} in the script
+
+#### 7.8 Python Node
+
+- Using python nodes, you can directly execute python scripts. For python nodes, workers will use `python **` to submit tasks.
+
+> Drag in the toolbarThe task node to the drawing board, as shown in the following figure:
+
+<p align="center">
+ <img src="/img/python-en.png" width="80%" />
+ </p>
+
+- Script: Python program developed by the user
+- Resources: refers to the list of resource files that need to be called in the script
+- User-defined parameter: It is a local user-defined parameter of Python, which will replace the content with \${variable} in the script
+
+#### 7.9 Flink Node
+
+- Drag in the toolbar<img src="/img/flink.png" width="35"/>The task node to the drawing board, as shown in the following figure:
+
+<p align="center">
+ <img src="/img/flink-en.png" width="80%" />
+</p>
+
+- Program type: supports JAVA, Scala and Python three languages
+- The class of the main function: is the full path of the Main Class, the entry point of the Flink program
+- Main jar package: is the Flink jar package
+- Deployment mode: support three modes of cluster and local
+- Number of slots: You can set the number of slots
+- Number of taskManage: You can set the number of taskManage
+- JobManager memory number: You can set the jobManager memory number
+- TaskManager memory number: You can set the taskManager memory number
+- Command line parameters: Set the input parameters of the Spark program and support the substitution of custom parameter variables.
+- Other parameters: support --jars, --files, --archives, --conf format
+- Resource: If the resource file is referenced in other parameters, you need to select and specify in the resource
+- Custom parameter: It is a local user-defined parameter of Flink, which will replace the content with \${variable} in the script
+
+Note: JAVA and Scala are only used for identification, there is no difference, if it is Flink developed by Python, there is no class of the main function, the others are the same
+
+#### 7.10 http Node
+
+- Drag in the toolbar<img src="/img/http.png" width="35"/>The task node to the drawing board, as shown in the following figure:
+
+<p align="center">
+ <img src="/img/http-en.png" width="80%" />
+ </p>
+
+- Node name: The node name in a workflow definition is unique.
+- Run flag: Identifies whether this node can be scheduled normally, if it does not need to be executed, you can turn on the prohibition switch.
+- Descriptive information: describe the function of the node.
+- Task priority: When the number of worker threads is insufficient, they are executed in order from high to low, and when the priority is the same, they are executed according to the first-in first-out principle.
+- Worker grouping: Tasks are assigned to the machines of the worker group to execute. If Default is selected, a worker machine will be randomly selected for execution.
+- Number of failed retry attempts: The number of times the task failed to be resubmitted. It supports drop-down and hand-filling.
+- Failed retry interval: The time interval for resubmitting the task after a failed task. It supports drop-down and hand-filling.
+- Timeout alarm: Check the timeout alarm and timeout failure. When the task exceeds the "timeout period", an alarm email will be sent and the task execution will fail.
+- Request address: http request URL.
+- Request type: support GET, POSt, HEAD, PUT, DELETE.
+- Request parameters: Support Parameter, Body, Headers.
+- Verification conditions: support default response code, custom response code, content included, content not included.
+- Verification content: When the verification condition selects a custom response code, the content contains, and the content does not contain, the verification content is required.
+- Custom parameter: It is a user-defined parameter of http part, which will replace the content with \${variable} in the script.
+
+#### 7.11 DATAX Node
+
+- Drag in the toolbar<img src="/img/datax.png" width="35"/>Task node into the drawing board
+
+ <p align="center">
+ <img src="/img/datax-en.png" width="80%" />
+ </p>
+
+- Custom template: When you turn on the custom template switch, you can customize the content of the json configuration file of the datax node (applicable when the control configuration does not meet the requirements)
+- Data source: select the data source to extract the data
+- sql statement: the sql statement used to extract data from the target database, the sql query column name is automatically parsed when the node is executed, and mapped to the target table synchronization column name. When the source table and target table column names are inconsistent, they can be converted by column alias (as)
+- Target library: select the target library for data synchronization
+- Target table: the name of the target table for data synchronization
+- Pre-sql: Pre-sql is executed before the sql statement (executed by the target library).
+- Post-sql: Post-sql is executed after the sql statement (executed by the target library).
+- json: json configuration file for datax synchronization
+- Custom parameters: SQL task type, and stored procedure is a custom parameter order to set values for the method. The custom parameter type and data type are the same as the stored procedure task type. The difference is that the SQL task type custom parameter will replace the \${variable} in the SQL statement.
+
+#### 8. parameter
+
+#### 8.1 System parameters
+
+<table>
+ <tr><th>variable</th><th>meaning</th></tr>
+ <tr>
+ <td>${system.biz.date}</td>
+ <td>The day before the scheduled time of the daily scheduling instance, the format is yyyyMMdd, when the data is supplemented, the date is +1</td>
+ </tr>
+ <tr>
+ <td>${system.biz.curdate}</td>
+ <td>The timing time of the daily scheduling instance, the format is yyyyMMdd, when the data is supplemented, the date is +1</td>
+ </tr>
+ <tr>
+ <td>${system.datetime}</td>
+ <td>The timing time of the daily scheduling instance, the format is yyyyMMddHHmmss, when the data is supplemented, the date is +1</td>
+ </tr>
+</table>
+
+#### 8.2 Time custom parameters
+
+- Support custom variable names in the code, declaration method: \${variable name}. It can refer to "system parameters" or specify "constants".
+
+- We define this benchmark variable as $[...] format, $[yyyyMMddHHmmss] can be decomposed and combined arbitrarily, such as: $[yyyyMMdd], $[HHmmss], \$[yyyy-MM-dd], etc.
+
+- The following format can also be used:
+
+ * Next N years:$[add_months(yyyyMMdd,12*N)]
+ * N years before:$[add_months(yyyyMMdd,-12*N)]
+ * Next N months:$[add_months(yyyyMMdd,N)]
+ * N months before:$[add_months(yyyyMMdd,-N)]
+ * Next N weeks:$[yyyyMMdd+7*N]
+ * First N weeks:$[yyyyMMdd-7*N]
+ * Next N days:$[yyyyMMdd+N]
+ * N days before:$[yyyyMMdd-N]
+ * Next N hours:$[HHmmss+N/24]
+ * First N hours:$[HHmmss-N/24]
+ * Next N minutes:$[HHmmss+N/24/60]
+ * First N minutes:$[HHmmss-N/24/60]
+
+#### 8.3 <span id=UserDefinedParameters>User-defined parameters</span>
+
+- User-defined parameters are divided into global parameters and local parameters. Global parameters are global parameters passed when saving workflow definitions and workflow instances. Global parameters can be referenced in the local parameters of any task node in the entire process.
+ example:
Review comment:
```suggestion
For example:
```
##########
File path: docs/en-us/1.3.2/user_doc/system-manual.md
##########
@@ -0,0 +1,886 @@
+# System User Manual
+
+## Get started quickly
+
+> Please refer to [Quick Start](quick-start.html)
+
+## Operation guide
+
+### 1. Home
+
+The home page contains task status statistics, process status statistics, and workflow definition statistics for all projects of the user.
+
+<p align="center">
+<img src="/img/home_en.png" width="80%" />
+</p>
+
+### 2. Project management
+
+#### 2.1 Create project
+
+- Click "Project Management" to enter the project management page, click the "Create Project" button, enter the project name, project description, and click "Submit" to create a new project.
+
+ <p align="center">
+ <img src="/img/create_project_en1.png" width="80%" />
+ </p>
+
+#### 2.2 Project home
+
+- Click the project name link on the project management page to enter the project home page, as shown in the figure below, the project home page contains the task status statistics, process status statistics, and workflow definition statistics of the project.
+ <p align="center">
+ <img src="/img/project_home_en.png" width="80%" />
+ </p>
+
+- Task status statistics: within the specified time range, count the number of task instances as successful submission, running, ready to pause, pause, ready to stop, stop, failure, success, fault tolerance, kill, and waiting threads
+- Process status statistics: within the specified time range, count the number of the status of the workflow instance as submission success, running, ready to pause, pause, ready to stop, stop, failure, success, fault tolerance, kill, and waiting threads
+- Workflow definition statistics: Count the workflow definitions created by this user and the workflow definitions granted to this user by the administrator
+
+#### 2.3 Workflow definition
+
+#### <span id=creatDag>2.3.1 Create workflow definition</span>
+
+- Click Project Management -> Workflow -> Workflow Definition to enter the workflow definition page, and click the "Create Workflow" button to enter the **workflow DAG edit** page, as shown in the following figure:
+ <p align="center">
+ <img src="/img/dag5.png" width="80%" />
+ </p>
+- Drag in the toolbar <img src="/img/shell.png" width="35"/> Add a Shell task to the drawing board, as shown in the figure below:
+ <p align="center">
+ <img src="/img/shell-en.png" width="80%" />
+ </p>
+- **Add parameter settings for this shell task:**
+
+1. Fill in the "Node Name", "Description", and "Script" fields;
+2. Check “Normal” for “Run Flag”. If “Prohibit Execution” is checked, the task will not be executed when the workflow runs;
+3. Select "Task Priority": When the number of worker threads is insufficient, high-level tasks will be executed first in the execution queue, and tasks with the same priority will be executed in the order of first in, first out;
+4. Timeout alarm (optional): Check the timeout alarm, timeout failure, and fill in the "timeout period". When the task execution time exceeds **timeout period**, an alert email will be sent and the task timeout fails;
+5. Resources (optional). Resource files are files created or uploaded on the Resource Center -> File Management page. For example, the file name is `test.sh`, and the command to call the resource in the script is `sh test.sh`;
+6. Custom parameters (optional), refer to [Custom Parameters](#UserDefinedParameters);
+7. Click the "Confirm Add" button to save the task settings.
+
+- **Increase the order of task execution:** Click the icon in the upper right corner <img src="/img/line.png" width="35"/> to connect the task; as shown in the figure below, task 2 and task 3 are executed in parallel, When task 1 finished execute, tasks 2 and 3 will be executed simultaneously.
+
+ <p align="center">
+ <img src="/img/dag6.png" width="80%" />
+ </p>
+
+- **Delete dependencies:** Click the "arrow" icon in the upper right corner <img src="/img/arrow.png" width="35"/>, select the connection line, and click the "Delete" icon in the upper right corner <img src= "/img/delete.png" width="35"/>, delete dependencies between tasks.
+ <p align="center">
+ <img src="/img/dag7.png" width="80%" />
+ </p>
+
+- **Save workflow definition:** Click the "Save" button, and the "Set DAG chart name" pop-up box will pop up, as shown in the figure below. Enter the workflow definition name, workflow definition description, and set global parameters (optional, refer to [ Custom parameters](#UserDefinedParameters)), click the "Add" button, and the workflow definition is created successfully.
+ <p align="center">
+ <img src="/img/dag8.png" width="80%" />
+ </p>
+> For other types of tasks, please refer to [Task Node Type and Parameter Settings](#TaskParamers).
+
+#### 2.3.2 Workflow definition operation function
+
+Click Project Management -> Workflow -> Workflow Definition to enter the workflow definition page, as shown below:
+
+<p align="center">
+<img src="/img/work_list_en.png" width="80%" />
+</p>
+The operation functions of the workflow definition list are as follows:
+
+- **Edit:** Only "offline" workflow definitions can be edited. Workflow DAG editing is the same as [Create Workflow Definition](#creatDag).
+- **Online:** When the workflow status is "Offline", used to online workflow. Only the workflow in the "Online" state can run, but cannot be edited.
+- **Offline:** When the workflow status is "Online", used to offline workflow. Only the workflow in the "Offline" state can be edited, but not run.
+- **Run:** Only workflow in the online state can run. See [2.3.3 Run Workflow](#runWorkflow) for the operation steps
+- **Timing:** Timing can only be set in online workflows, and the system automatically schedules the workflow to run on a regular basis. The status after creating a timing is "offline", and the timing must be online on the timing management page to take effect. See [2.3.4 Workflow Timing](#creatTiming) for timing operation steps.
+- **Timing Management:** The timing management page can be edited, online/offline, and deleted.
+- **Delete:** Delete the workflow definition.
+- **Download:** Download workflow definition to local.
+- **Tree Diagram:** Display the task node type and task status in a tree structure, as shown in the figure below:
+ <p align="center">
+ <img src="/img/tree_en.png" width="80%" />
+ </p>
+
+#### <span id=runWorkflow>2.3.3 Run the workflow</span>
+
+- Click Project Management -> Workflow -> Workflow Definition to enter the workflow definition page, as shown in the figure below, click the "Go Online" button <img src="/img/online.png" width="35"/>,Go online workflow.
+ <p align="center">
+ <img src="/img/work_list_en.png" width="80%" />
+ </p>
+
+- Click the "Run" button to pop up the startup parameter setting pop-up box, as shown in the figure below, set the startup parameters, click the "Run" button in the pop-up box, the workflow starts running, and the workflow instance page generates a workflow instance.
+ <p align="center">
+ <img src="/img/run_work_en.png" width="80%" />
+ </p>
+ <span id=runParamers>Description of workflow operating parameters:</span>
+
+ * Failure strategy: When a task node fails to execute, other parallel task nodes need to execute the strategy. "Continue" means: after a certain task fails, other task nodes execute normally; "End" means: terminate all tasks being executed, and terminate the entire process.
+ * Notification strategy: When the process is over, the process execution information notification email is sent according to the process status, including any status is not sent, successful sent, failed sent, successful or failed sent.
+ * Process priority: The priority of process operation, divided into five levels: highest (HIGHEST), high (HIGH), medium (MEDIUM), low (LOW), and lowest (LOWEST). When the number of master threads is insufficient, high-level processes will be executed first in the execution queue, and processes with the same priority will be executed in a first-in first-out order.
+ * Worker group: The process can only be executed in the specified worker machine group. The default is Default, which can be executed on any worker.
+ * Notification group: select notification strategy||timeout alarm||when fault tolerance occurs, process information or email will be sent to all members in the notification group.
+ * Recipient: Select notification policy||Timeout alarm||When fault tolerance occurs, process information or alarm email will be sent to the recipient list.
+ * Cc: Select the notification strategy||Timeout alarm||When fault tolerance occurs, the process information or warning email will be copied to the CC list.
+ * Complement: Two modes including serial complement and parallel complement. Serial complement: within the specified time range, the complement is executed sequentially from the start date to the end date, and only one process instance is generated; parallel complement: within the specified time range, multiple days are complemented at the same time to generate N process instances.
+ * For example, you need to fill in the data from May 1 to May 10.
+
+ <p align="center">
+ <img src="/img/complement_en1.png" width="80%" />
+ </p>
+
+ > Serial mode: The complement is executed sequentially from May 1 to May 10, and a process instance is generated on the process instance page;
+
+ > Parallel mode: The tasks from May 1 to may 10 are executed simultaneously, and 10 process instances are generated on the process instance page.
+
+#### <span id=creatTiming>2.3.4 Workflow timing</span>
+
+- Create timing: Click Project Management->Workflow->Workflow Definition, enter the workflow definition page, go online the workflow, click the "timing" button <img src="/img/timing.png" width="35"/> ,The timing parameter setting dialog box pops up, as shown in the figure below:
+ <p align="center">
+ <img src="/img/time_schedule_en.png" width="80%" />
+ </p>
+- Choose the start and end time. In the start and end time range, the workflow is run at regular intervals; not in the start and end time range, no more regular workflow instances are generated.
+- Add a timing that is executed once every day at 5 AM, as shown in the following figure:
+ <p align="center">
+ <img src="/img/timer-en.png" width="80%" />
+ </p>
+- Failure strategy, notification strategy, process priority, worker group, notification group, recipient, and CC are the same as [workflow running parameters](#runParamers).
+- Click the "Create" button to create the timing successfully. At this time, the timing status is "**Offline**" and the timing needs to be **Online** to take effect.
+- Timing online: Click the "timing management" button <img src="/img/timeManagement.png" width="35"/>, enter the timing management page, click the "online" button, the timing status will change to "online", as shown in the below figure, the workflow takes effect regularly.
+ <p align="center">
+ <img src="/img/time-manage-list-en.png" width="80%" />
+ </p>
+
+#### 2.3.5 Import workflow
+
+Click Project Management -> Workflow -> Workflow Definition to enter the workflow definition page, click the "Import Workflow" button to import the local workflow file, the workflow definition list displays the imported workflow, and the status is offline.
+
+#### 2.4 Workflow instance
+
+#### 2.4.1 View workflow instance
+
+- Click Project Management -> Workflow -> Workflow Instance to enter the Workflow Instance page, as shown in the figure below:
+ <p align="center">
+ <img src="/img/instance-list-en.png" width="80%" />
+ </p>
+- Click the workflow name to enter the DAG view page to view the task execution status, as shown in the figure below.
+ <p align="center">
+ <img src="/img/instance-runs-en.png" width="80%" />
+ </p>
+
+#### 2.4.2 View task log
+
+- Enter the workflow instance page, click the workflow name, enter the DAG view page, double-click the task node, as shown in the following figure:
+ <p align="center">
+ <img src="/img/instanceViewLog-en.png" width="80%" />
+ </p>
+- Click "View Log", a log pop-up box will pop up, as shown in the figure below, the task log can also be viewed on the task instance page, refer to [Task View Log](#taskLog)。
+ <p align="center">
+ <img src="/img/task-log-en.png" width="80%" />
+ </p>
+
+#### 2.4.3 View task history
+
+- Click Project Management -> Workflow -> Workflow Instance to enter the workflow instance page, and click the workflow name to enter the workflow DAG page;
+- Double-click the task node, as shown in the figure below, click "View History" to jump to the task instance page, and display a list of task instances running by the workflow instance
+ <p align="center">
+ <img src="/img/task_history_en.png" width="80%" />
+ </p>
+
+#### 2.4.4 View operating parameters
+
+- Click Project Management -> Workflow -> Workflow Instance to enter the workflow instance page, and click the workflow name to enter the workflow DAG page;
+- Click the icon in the upper left corner <img src="/img/run_params_button.png" width="35"/>,View the startup parameters of the workflow instance; click the icon <img src="/img/global_param.png" width="35"/>,View the global and local parameters of the workflow instance, as shown in the following figure:
+ <p align="center">
+ <img src="/img/run_params_en.png" width="80%" />
+ </p>
+
+#### 2.4.4 Workflow instance operation function
+
+Click Project Management -> Workflow -> Workflow Instance to enter the Workflow Instance page, as shown in the figure below:
+
+ <p align="center">
+ <img src="/img/instance-list-en.png" width="80%" />
+ </p>
+
+- **Edit:** Only terminated processes can be edited. Click the "Edit" button or the name of the workflow instance to enter the DAG edit page. After edit, click the "Save" button to pop up the Save DAG pop-up box, as shown in the figure below. In the pop-up box, check "Whether to update to workflow definition" and save After that, the workflow definition will be updated; if it is not checked, the workflow definition will not be updated.
+ <p align="center">
+ <img src="/img/editDag-en.png" width="80%" />
+ </p>
+- **Rerun:** Re-execute the terminated process.
+- **Recovery failed:** For failed processes, you can perform recovery operations, starting from the failed node.
+- **Stop:** To **stop** the running process, the background will first `kill`worker process, and then execute `kill -9` operation
+- **Pause:** Perform a **pause** operation on the running process, the system status will change to **waiting for execution**, it will wait for the end of the task being executed, and pause the next task to be executed.
+- **Resume pause:** To resume the paused process, start running directly from the **paused node**
+- **Delete:** Delete the workflow instance and the task instance under the workflow instance
+- **Gantt chart:** The vertical axis of the Gantt chart is the topological sorting of task instances under a certain workflow instance, and the horizontal axis is the running time of the task instances, as shown in the figure:
+ <p align="center">
+ <img src="/img/gantt-en.png" width="80%" />
+ </p>
+
+#### 2.5 Task instance
+
+- Click Project Management -> Workflow -> Task Instance to enter the task instance page, as shown in the figure below, click the name of the workflow instance, you can jump to the workflow instance DAG chart to view the task status.
+ <p align="center">
+ <img src="/img/task-list-en.png" width="80%" />
+ </p>
+
+- <span id=taskLog>View log:</span>Click the "view log" button in the operation column to view the log of task execution.
+ <p align="center">
+ <img src="/img/task-log2-en.png" width="80%" />
+ </p>
+
+### 3. Resource Center
+
+#### 3.1 hdfs resource configuration
+
+- Upload resource files and udf functions, all uploaded files and resources will be stored on hdfs, so the following configuration items are required:
+
+```
+
+conf/common/common.properties
+ # Users who have permission to create directories under the HDFS root path
+ hdfs.root.user=hdfs
+ # data base dir, resource file will store to this hadoop hdfs path, self configuration, please make sure the directory exists on hdfs and have read write permissions。"/escheduler" is recommended
+ data.store2hdfs.basepath=/dolphinscheduler
+ # resource upload startup type : HDFS,S3,NONE
+ res.upload.startup.type=HDFS
+ # whether kerberos starts
+ hadoop.security.authentication.startup.state=false
+ # java.security.krb5.conf path
+ java.security.krb5.conf.path=/opt/krb5.conf
+ # loginUserFromKeytab user
+ login.user.keytab.username=hdfs-mycluster@ESZ.COM
+ # loginUserFromKeytab path
+ login.user.keytab.path=/opt/hdfs.headless.keytab
+
+conf/common/hadoop.properties
+ # ha or single namenode,If namenode ha needs to copy core-site.xml and hdfs-site.xml
+ # to the conf directory,support s3,for example : s3a://dolphinscheduler
+ fs.defaultFS=hdfs://mycluster:8020
+ #resourcemanager ha note this need ips , this empty if single
+ yarn.resourcemanager.ha.rm.ids=192.168.xx.xx,192.168.xx.xx
+ # If it is a single resourcemanager, you only need to configure one host name. If it is resourcemanager HA, the default configuration is fine
+ yarn.application.status.address=http://xxxx:8088/ws/v1/cluster/apps/%s
+
+```
+
+- Only one address needs to be configured for yarn.resourcemanager.ha.rm.ids and yarn.application.status.address, and the other address is empty.
+- You need to copy core-site.xml and hdfs-site.xml from the conf directory of the Hadoop cluster to the conf directory of the dolphinscheduler project, and restart the api-server service.
+
+#### 3.2 File management
+
+> It is the management of various resource files, including creating basic txt/log/sh/conf/py/java and other files, uploading jar packages and other types of files, and can do edit, rename, download, delete and other operations.
+
+ <p align="center">
+ <img src="/img/file-manage-en.png" width="80%" />
+ </p>
+
+- Create a file
+ > The file format supports the following types: txt, log, sh, conf, cfg, py, java, sql, xml, hql, properties
+
+<p align="center">
+ <img src="/img/file_create_en.png" width="80%" />
+ </p>
+
+- upload files
+
+> Upload file: Click the "Upload File" button to upload, drag the file to the upload area, the file name will be automatically completed with the uploaded file name
+
+<p align="center">
+ <img src="/img/file-upload-en.png" width="80%" />
+ </p>
+
+- File View
+
+> For the file types that can be viewed, click the file name to view the file details
+
+<p align="center">
+ <img src="/img/file_detail_en.png" width="80%" />
+ </p>
+
+- download file
+
+> Click the "Download" button in the file list to download the file or click the "Download" button in the upper right corner of the file details to download the file
+
+- File rename
+
+<p align="center">
+ <img src="/img/file_rename_en.png" width="80%" />
+ </p>
+
+- delete
+ > File list -> Click the "Delete" button to delete the specified file
+
+#### 3.3 UDF management
+
+#### 3.3.1 Resource management
+
+> The resource management and file management functions are similar. The difference is that the resource management is the uploaded UDF function, and the file management uploads the user program, script and configuration file.
+> Operation function: rename, download, delete.
+
+- Upload udf resources
+ > Same as uploading files.
+
+#### 3.3.2 Function management
+
+- Create UDF function
+ > Click "Create UDF Function", enter the udf function parameters, select the udf resource, and click "Submit" to create the udf function.
+
+> Currently only supports temporary UDF functions of HIVE
+
+- UDF function name: the name when the UDF function is entered
+- Package name Class name: Enter the full path of the UDF function
+- UDF resource: Set the resource file corresponding to the created UDF
+
+<p align="center">
+ <img src="/img/udf_edit_en.png" width="80%" />
+ </p>
+
+### 4. Create data source
+
+> Data source center supports MySQL, POSTGRESQL, HIVE/IMPALA, SPARK, CLICKHOUSE, ORACLE, SQLSERVER and other data sources
+
+#### 4.1 Create/Edit MySQL data source
+
+- Click "Data Source Center -> Create Data Source" to create different types of data sources according to requirements.
+
+- Data source: select MYSQL
+- Data source name: enter the name of the data source
+- Description: Enter a description of the data source
+- IP hostname: enter the IP to connect to MySQL
+- Port: Enter the port to connect to MySQL
+- Username: Set the username for connecting to MySQL
+- Password: Set the password for connecting to MySQL
+- Database name: Enter the name of the database connected to MySQL
+- Jdbc connection parameters: parameter settings for MySQL connection, filled in in JSON form
+
+<p align="center">
+ <img src="/img/mysql-en.png" width="80%" />
+ </p>
+
+> Click "Test Connection" to test whether the data source can be successfully connected.
+
+#### 4.2 Create/Edit POSTGRESQL data source
+
+- Data source: select POSTGRESQL
+- Data source name: enter the name of the data source
+- Description: Enter a description of the data source
+- IP/Host Name: Enter the IP to connect to POSTGRESQL
+- Port: Enter the port to connect to POSTGRESQL
+- Username: Set the username for connecting to POSTGRESQL
+- Password: Set the password for connecting to POSTGRESQL
+- Database name: Enter the name of the database connected to POSTGRESQL
+- Jdbc connection parameters: parameter settings for POSTGRESQL connection, filled in in JSON form
+
+<p align="center">
+ <img src="/img/postgresql-en.png" width="80%" />
+ </p>
+
+#### 4.3 Create/Edit HIVE data source
+
+1.Use HiveServer2 to connect
+
+ <p align="center">
+ <img src="/img/hive-en.png" width="80%" />
+ </p>
+
+- Data source: select HIVE
+- Data source name: enter the name of the data source
+- Description: Enter a description of the data source
+- IP/Host Name: Enter the IP connected to HIVE
+- Port: Enter the port connected to HIVE
+- Username: Set the username for connecting to HIVE
+- Password: Set the password for connecting to HIVE
+- Database name: Enter the name of the database connected to HIVE
+- Jdbc connection parameters: parameter settings for HIVE connection, filled in in JSON form
+
+ 2.Use HiveServer2 HA Zookeeper to connect
+
+ <p align="center">
+ <img src="/img/hive1-en.png" width="80%" />
+ </p>
+
+Note: If you enable **kerberos**, you need to fill in **Principal**
+
+<p align="center">
+ <img src="/img/hive-en.png" width="80%" />
+ </p>
+
+#### 4.4 Create/Edit Spark data source
+
+<p align="center">
+ <img src="/img/spark-en.png" width="80%" />
+ </p>
+
+- Data source: select Spark
+- Data source name: enter the name of the data source
+- Description: Enter a description of the data source
+- IP/Hostname: Enter the IP connected to Spark
+- Port: Enter the port connected to Spark
+- Username: Set the username for connecting to Spark
+- Password: Set the password for connecting to Spark
+- Database name: Enter the name of the database connected to Spark
+- Jdbc connection parameters: parameter settings for Spark connection, filled in in JSON form
+
+### 5. Security Center (Permission System)
+
+ * Only the administrator account in the security center has the authority to operate. It has functions such as queue management, tenant management, user management, alarm group management, worker group management, token management, etc. In the user management module, resources, data sources, projects, etc. Authorization
+ * Administrator login, default user name and password: admin/dolphinscheduler123
+
+#### 5.1 Create queue
+
+- Queue is used when the "queue" parameter is needed to execute programs such as spark and mapreduce.
+- The administrator enters the Security Center->Queue Management page and clicks the "Create Queue" button to create a queue.
+<p align="center">
+ <img src="/img/create-queue-en.png" width="80%" />
+ </p>
+
+#### 5.2 Add tenant
+
+- The tenant corresponds to the Linux user, which is used by the worker to submit the job. If Linux does not have this user, the worker will create this user when executing the script.
+- Tenant Code: **Tenant Code is the only user on Linux and cannot be repeated**
+- The administrator enters the Security Center->Tenant Management page and clicks the "Create Tenant" button to create a tenant.
+
+ <p align="center">
+ <img src="/img/addtenant-en.png" width="80%" />
+ </p>
+
+#### 5.3 Create normal user
+
+- Users are divided into **administrator users** and **normal users**
+
+ - The administrator has authorization and user management authority, but does not have the authority to create project and workflow definition operations.
+ - Ordinary users can create projects and create, edit, and execute workflow definitions.
+ - Note: If the user switches tenants, all resources under the tenant where the user belongs will be copied to the new tenant that is switched.
+
+- The administrator enters the Security Center -> User Management page and clicks the "Create User" button to create a user.
+<p align="center">
+ <img src="/img/user-en.png" width="80%" />
+ </p>
+
+> **Edit user information**
+
+- The administrator enters the Security Center->User Management page and clicks the "Edit" button to edit user information.
+- After an ordinary user logs in, click the user information in the user name drop-down box to enter the user information page, and click the "Edit" button to edit the user information.
+
+> **Modify user password**
+
+- The administrator enters the Security Center->User Management page and clicks the "Edit" button. When editing user information, enter the new password to modify the user password.
+- After a normal user logs in, click the user information in the user name drop-down box to enter the password modification page, enter the password and confirm the password and click the "Edit" button, then the password modification is successful.
+
+#### 5.4 Create alarm group
+
+- The alarm group is a parameter set at startup. After the process ends, the status of the process and other information will be sent to the alarm group in the form of email.
+
+* The administrator enters the Security Center -> Alarm Group Management page and clicks the "Create Alarm Group" button to create an alarm group.
+
+ <p align="center">
+ <img src="/img/mail-en.png" width="80%" />
+
+#### 5.5 Token management
+
+> Since the back-end interface has login check, token management provides a way to perform various operations on the system by calling the interface.
+
+- The administrator enters the Security Center -> Token Management page, clicks the "Create Token" button, selects the expiration time and user, clicks the "Generate Token" button, and clicks the "Submit" button, then the selected user's token is created successfully.
+
+ <p align="center">
+ <img src="/img/create-token-en.png" width="80%" />
+ </p>
+
+ - After an ordinary user logs in, click the user information in the user name drop-down box, enter the token management page, select the expiration time, click the "generate token" button, and click the "submit" button, then the user creates a token successfully.
+ - Call example:
+
+```
+Token call example
+ /**
+ * test token
+ */
+ public void doPOSTParam()throws Exception{
+ // create HttpClient
+ CloseableHttpClient httpclient = HttpClients.createDefault();
+
+ // create http post request
+ HttpPost httpPost = new HttpPost("http://127.0.0.1:12345/escheduler/projects/create");
+ httpPost.setHeader("token", "123");
+ // set parameters
+ List<NameValuePair> parameters = new ArrayList<NameValuePair>();
+ parameters.add(new BasicNameValuePair("projectName", "qzw"));
+ parameters.add(new BasicNameValuePair("desc", "qzw"));
+ UrlEncodedFormEntity formEntity = new UrlEncodedFormEntity(parameters);
+ httpPost.setEntity(formEntity);
+ CloseableHttpResponse response = null;
+ try {
+ // execute
+ response = httpclient.execute(httpPost);
+ // response status code 200
+ if (response.getStatusLine().getStatusCode() == 200) {
+ String content = EntityUtils.toString(response.getEntity(), "UTF-8");
+ System.out.println(content);
+ }
+ } finally {
+ if (response != null) {
+ response.close();
+ }
+ httpclient.close();
+ }
+ }
+```
+
+#### 5.6 Granted permission
+
+ * Granted permissions include project permissions, resource permissions, data source permissions, UDF function permissions.
+ * The administrator can authorize the projects, resources, data sources and UDF functions not created by ordinary users. Because the authorization methods for projects, resources, data sources and UDF functions are the same, we take project authorization as an example.
+ * Note: For projects created by users themselves, the user has all permissions. The project list and the selected project list will not be displayed.
+
+- The administrator enters the Security Center -> User Management page and clicks the "Authorize" button of the user who needs to be authorized, as shown in the figure below:
+ <p align="center">
+ <img src="/img/auth-en.png" width="80%" />
+</p>
+
+- Select the project to authorize the project.
+
+<p align="center">
+ <img src="/img/authproject-en.png" width="80%" />
+ </p>
+
+- Resources, data sources, and UDF function authorization are the same as project authorization.
+
+### 6. monitoring Center
+
+#### 6.1 Service management
+
+- Service management is mainly to monitor and display the health status and basic information of each service in the system
+
+#### 6.1.1 master monitoring
+
+- Mainly related to master information.
+<p align="center">
+ <img src="/img/master-jk-en.png" width="80%" />
+ </p>
+
+#### 6.1.2 worker monitoring
+
+- Mainly related to worker information.
+
+<p align="center">
+ <img src="/img/worker-jk-en.png" width="80%" />
+ </p>
+
+#### 6.1.3 Zookeeper monitoring
+
+- Mainly related configuration information of each worker and master in zookpeeper.
+
+<p align="center">
+ <img src="/img/zookeeper-monitor-en.png" width="80%" />
+ </p>
+
+#### 6.1.4 DB monitoring
+
+- Mainly the health of the DB
+
+<p align="center">
+ <img src="/img/mysql-jk-en.png" width="80%" />
+ </p>
+
+#### 6.2 Statistics management
+
+<p align="center">
+ <img src="/img/statistics-en.png" width="80%" />
+ </p>
+
+- Number of commands to be executed: statistics on the t_ds_command table
+- The number of failed commands: statistics on the t_ds_error_command table
+- Number of tasks to run: Count the data of task_queue in Zookeeper
+- Number of tasks to be killed: Count the data of task_kill in Zookeeper
+
+### 7. <span id=TaskParamers>Task node type and parameter settings</span>
+
+#### 7.1 Shell node
+
+> Shell node, when the worker is executed, a temporary shell script is generated, and the linux user with the same name as the tenant executes the script.
+
+- Click Project Management-Project Name-Workflow Definition, and click the "Create Workflow" button to enter the DAG editing page.
+- Drag <img src="/img/shell.png" width="35"/> from the toolbar to the drawing board, as shown in the figure below:
+
+ <p align="center">
+ <img src="/img/shell-en.png" width="80%" />
+ </p>
+
+- Node name: The node name in a workflow definition is unique.
+- Run flag: Identifies whether this node can be scheduled normally, if it does not need to be executed, you can turn on the prohibition switch.
+- Descriptive information: describe the function of the node.
+- Task priority: When the number of worker threads is insufficient, they are executed in order from high to low, and when the priority is the same, they are executed according to the first-in first-out principle.
+- Worker grouping: Tasks are assigned to the machines of the worker group to execute. If Default is selected, a worker machine will be randomly selected for execution.
+- Number of failed retry attempts: The number of times the task failed to be resubmitted. It supports drop-down and hand-filling.
+- Failed retry interval: The time interval for resubmitting the task after a failed task. It supports drop-down and hand-filling.
+- Timeout alarm: Check the timeout alarm and timeout failure. When the task exceeds the "timeout period", an alarm email will be sent and the task execution will fail.
+- Script: SHELL program developed by users.
+- Resource: Refers to the list of resource files that need to be called in the script, and the files uploaded or created by the resource center-file management.
+- User-defined parameters: It is a user-defined parameter that is part of SHELL, which will replace the content with \${variable} in the script.
+
+#### 7.2 Sub-process node
+
+- The sub-process node is to execute a certain external workflow definition as a task node.
+ > Drag the  task node in the toolbar to the drawing board, as shown in the following figure:
+
+<p align="center">
+ <img src="/img/sub-process-en.png" width="80%" />
+ </p>
+
+- Node name: The node name in a workflow definition is unique
+- Run flag: identify whether this node can be scheduled normally
+- Descriptive information: describe the function of the node
+- Timeout alarm: Check the timeout alarm and timeout failure. When the task exceeds the "timeout period", an alarm email will be sent and the task execution will fail.
+- Sub-node: It is the workflow definition of the selected sub-process. Enter the sub-node in the upper right corner to jump to the workflow definition of the selected sub-process
+
+#### 7.3 DEPENDENT node
+
+- Dependent nodes are **dependency check nodes**. For example, process A depends on the successful execution of process B yesterday, and the dependent node will check whether process B has a successful execution yesterday.
+
+> Drag the  task node in the toolbar to the drawing board, as shown in the following figure:
+
+<p align="center">
+ <img src="/img/dependent-nodes-en.png" width="80%" />
+ </p>
+
+> The dependent node provides a logical judgment function, such as checking whether the B process was successful yesterday, or whether the C process was executed successfully.
+
+ <p align="center">
+ <img src="/img/depend-node-en.png" width="80%" />
+ </p>
+
+> For example, process A is a weekly report task, processes B and C are daily tasks, and task A requires tasks B and C to be successfully executed every day of the last week, as shown in the figure:
+
+ <p align="center">
+ <img src="/img/depend-node1-en.png" width="80%" />
+ </p>
+
+> If the weekly report A also needs to be executed successfully last Tuesday:
+
+ <p align="center">
+ <img src="/img/depend-node3-en.png" width="80%" />
+ </p>
+
+#### 7.4 Stored procedure node
+
+- According to the selected data source, execute the stored procedure.
+ > Drag in the toolbarThe task node to the drawing board, as shown in the following figure:
+
+<p align="center">
+ <img src="/img/procedure-en.png" width="80%" />
+ </p>
+
+- Data source: The data source type of the stored procedure supports MySQL and POSTGRESQL, select the corresponding data source
+- Method: is the method name of the stored procedure
+- Custom parameters: The custom parameter types of the stored procedure support IN and OUT, and the data types support nine data types: VARCHAR, INTEGER, LONG, FLOAT, DOUBLE, DATE, TIME, TIMESTAMP, and BOOLEAN
+
+#### 7.5 SQL node
+
+- Drag in the toolbarTask node into the drawing board
+- Non-query SQL function: edit non-query SQL task information, select non-query for sql type, as shown in the figure below:
+ <p align="center">
+ <img src="/img/sql-en.png" width="80%" />
+</p>
+
+- Query SQL function: Edit and query SQL task information, sql type selection query, select form or attachment to send mail to the specified recipient, as shown in the figure below.
+
+<p align="center">
+ <img src="/img/sql-node-en.png" width="80%" />
+ </p>
+
+- Data source: select the corresponding data source
+- sql type: supports query and non-query. The query is a select type query, which is returned with a result set. You can specify three templates for email notification as form, attachment or form attachment. Non-queries are returned without a result set, and are for three types of operations: update, delete, and insert.
+- sql parameter: the input parameter format is key1=value1;key2=value2...
+- sql statement: SQL statement
+- UDF function: For data sources of type HIVE, you can refer to UDF functions created in the resource center. UDF functions are not supported for other types of data sources.
+- Custom parameters: SQL task type, and stored procedure is a custom parameter order to set values for the method. The custom parameter type and data type are the same as the stored procedure task type. The difference is that the SQL task type custom parameter will replace the \${variable} in the SQL statement.
+- Pre-sql: Pre-sql is executed before the sql statement.
+- Post-sql: Post-sql is executed after the sql statement.
+
+#### 7.6 SPARK node
+
+- Through the SPARK node, you can directly execute the SPARK program. For the spark node, the worker will use the `spark-submit` method to submit tasks
+
+> Drag in the toolbarThe task node to the drawing board, as shown in the following figure:
+
+<p align="center">
+ <img src="/img/spark-submit-en.png" width="80%" />
+ </p>
+
+- Program type: supports JAVA, Scala and Python three languages
+- The class of the main function: is the full path of the Spark program’s entry Main Class
+- Main jar package: Spark jar package
+- Deployment mode: support three modes of yarn-cluster, yarn-client and local
+- Driver core number: You can set the number of Driver cores and the number of memory
+- Number of Executors: You can set the number of Executors, the number of Executor memory, and the number of Executor cores
+- Command line parameters: Set the input parameters of the Spark program and support the substitution of custom parameter variables.
+- Other parameters: support --jars, --files, --archives, --conf format
+- Resource: If the resource file is referenced in other parameters, you need to select and specify in the resource
+- User-defined parameter: It is a user-defined parameter of the MR part, which will replace the content with \${variable} in the script
+
+Note: JAVA and Scala are only used for identification, there is no difference, if it is Spark developed by Python, there is no main function class, and the others are the same
+
+#### 7.7 MapReduce(MR) node
+
+- Using the MR node, you can directly execute the MR program. For the mr node, the worker will use the `hadoop jar` method to submit tasks
+
+> Drag the  task node in the toolbar to the drawing board, as shown in the following figure:
+
+1. JAVA program
+
+ <p align="center">
+ <img src="/img/mr_java_en.png" width="80%" />
+ </p>
+
+- The class of the main function: is the full path of the Main Class, the entry point of the MR program
+- Program type: select JAVA language
+- Main jar package: is the MR jar package
+- Command line parameters: set the input parameters of the MR program and support the substitution of custom parameter variables
+- Other parameters: support -D, -files, -libjars, -archives format
+- Resource: If the resource file is referenced in other parameters, you need to select and specify in the resource
+- User-defined parameter: It is a user-defined parameter of the MR part, which will replace the content with \${variable} in the script
+
+2. Python program
+
+<p align="center">
+ <img src="/img/mr_edit_en.png" width="80%" />
+ </p>
+
+- Program type: select Python language
+- Main jar package: is the Python jar package for running MR
+- Other parameters: support -D, -mapper, -reducer, -input -output format, here you can set the input of user-defined parameters, such as:
+- -mapper "mapper.py 1" -file mapper.py -reducer reducer.py -file reducer.py –input /journey/words.txt -output /journey/out/mr/\${currentTimeMillis}
+- The mapper.py 1 after -mapper is two parameters, the first parameter is mapper.py, and the second parameter is 1
+- Resource: If the resource file is referenced in other parameters, you need to select and specify in the resource
+- User-defined parameter: It is a user-defined parameter of the MR part, which will replace the content with \${variable} in the script
+
+#### 7.8 Python Node
+
+- Using python nodes, you can directly execute python scripts. For python nodes, workers will use `python **` to submit tasks.
+
+> Drag in the toolbarThe task node to the drawing board, as shown in the following figure:
+
+<p align="center">
+ <img src="/img/python-en.png" width="80%" />
+ </p>
+
+- Script: Python program developed by the user
+- Resources: refers to the list of resource files that need to be called in the script
+- User-defined parameter: It is a local user-defined parameter of Python, which will replace the content with \${variable} in the script
+
+#### 7.9 Flink Node
+
+- Drag in the toolbar<img src="/img/flink.png" width="35"/>The task node to the drawing board, as shown in the following figure:
+
+<p align="center">
+ <img src="/img/flink-en.png" width="80%" />
+</p>
+
+- Program type: supports JAVA, Scala and Python three languages
+- The class of the main function: is the full path of the Main Class, the entry point of the Flink program
+- Main jar package: is the Flink jar package
+- Deployment mode: support three modes of cluster and local
+- Number of slots: You can set the number of slots
+- Number of taskManage: You can set the number of taskManage
+- JobManager memory number: You can set the jobManager memory number
+- TaskManager memory number: You can set the taskManager memory number
+- Command line parameters: Set the input parameters of the Spark program and support the substitution of custom parameter variables.
+- Other parameters: support --jars, --files, --archives, --conf format
+- Resource: If the resource file is referenced in other parameters, you need to select and specify in the resource
+- Custom parameter: It is a local user-defined parameter of Flink, which will replace the content with \${variable} in the script
+
+Note: JAVA and Scala are only used for identification, there is no difference, if it is Flink developed by Python, there is no class of the main function, the others are the same
+
+#### 7.10 http Node
+
+- Drag in the toolbar<img src="/img/http.png" width="35"/>The task node to the drawing board, as shown in the following figure:
+
+<p align="center">
+ <img src="/img/http-en.png" width="80%" />
+ </p>
+
+- Node name: The node name in a workflow definition is unique.
+- Run flag: Identifies whether this node can be scheduled normally, if it does not need to be executed, you can turn on the prohibition switch.
+- Descriptive information: describe the function of the node.
+- Task priority: When the number of worker threads is insufficient, they are executed in order from high to low, and when the priority is the same, they are executed according to the first-in first-out principle.
+- Worker grouping: Tasks are assigned to the machines of the worker group to execute. If Default is selected, a worker machine will be randomly selected for execution.
+- Number of failed retry attempts: The number of times the task failed to be resubmitted. It supports drop-down and hand-filling.
+- Failed retry interval: The time interval for resubmitting the task after a failed task. It supports drop-down and hand-filling.
+- Timeout alarm: Check the timeout alarm and timeout failure. When the task exceeds the "timeout period", an alarm email will be sent and the task execution will fail.
+- Request address: http request URL.
+- Request type: support GET, POSt, HEAD, PUT, DELETE.
+- Request parameters: Support Parameter, Body, Headers.
+- Verification conditions: support default response code, custom response code, content included, content not included.
+- Verification content: When the verification condition selects a custom response code, the content contains, and the content does not contain, the verification content is required.
+- Custom parameter: It is a user-defined parameter of http part, which will replace the content with \${variable} in the script.
+
+#### 7.11 DATAX Node
+
+- Drag in the toolbar<img src="/img/datax.png" width="35"/>Task node into the drawing board
+
+ <p align="center">
+ <img src="/img/datax-en.png" width="80%" />
+ </p>
+
+- Custom template: When you turn on the custom template switch, you can customize the content of the json configuration file of the datax node (applicable when the control configuration does not meet the requirements)
+- Data source: select the data source to extract the data
+- sql statement: the sql statement used to extract data from the target database, the sql query column name is automatically parsed when the node is executed, and mapped to the target table synchronization column name. When the source table and target table column names are inconsistent, they can be converted by column alias (as)
+- Target library: select the target library for data synchronization
+- Target table: the name of the target table for data synchronization
+- Pre-sql: Pre-sql is executed before the sql statement (executed by the target library).
+- Post-sql: Post-sql is executed after the sql statement (executed by the target library).
Review comment:
```suggestion
- Post-sql: Post-sql is executed after the sql statement (executed by the target database).
```
##########
File path: docs/en-us/1.3.2/user_doc/system-manual.md
##########
@@ -0,0 +1,886 @@
+# System User Manual
+
+## Get started quickly
+
+> Please refer to [Quick Start](quick-start.html)
+
+## Operation guide
+
+### 1. Home
+
+The home page contains task status statistics, process status statistics, and workflow definition statistics for all projects of the user.
+
+<p align="center">
+<img src="/img/home_en.png" width="80%" />
+</p>
+
+### 2. Project management
+
+#### 2.1 Create project
+
+- Click "Project Management" to enter the project management page, click the "Create Project" button, enter the project name, project description, and click "Submit" to create a new project.
+
+ <p align="center">
+ <img src="/img/create_project_en1.png" width="80%" />
+ </p>
+
+#### 2.2 Project home
+
+- Click the project name link on the project management page to enter the project home page, as shown in the figure below, the project home page contains the task status statistics, process status statistics, and workflow definition statistics of the project.
+ <p align="center">
+ <img src="/img/project_home_en.png" width="80%" />
+ </p>
+
+- Task status statistics: within the specified time range, count the number of task instances as successful submission, running, ready to pause, pause, ready to stop, stop, failure, success, fault tolerance, kill, and waiting threads
+- Process status statistics: within the specified time range, count the number of the status of the workflow instance as submission success, running, ready to pause, pause, ready to stop, stop, failure, success, fault tolerance, kill, and waiting threads
+- Workflow definition statistics: Count the workflow definitions created by this user and the workflow definitions granted to this user by the administrator
+
+#### 2.3 Workflow definition
+
+#### <span id=creatDag>2.3.1 Create workflow definition</span>
+
+- Click Project Management -> Workflow -> Workflow Definition to enter the workflow definition page, and click the "Create Workflow" button to enter the **workflow DAG edit** page, as shown in the following figure:
+ <p align="center">
+ <img src="/img/dag5.png" width="80%" />
+ </p>
+- Drag in the toolbar <img src="/img/shell.png" width="35"/> Add a Shell task to the drawing board, as shown in the figure below:
+ <p align="center">
+ <img src="/img/shell-en.png" width="80%" />
+ </p>
+- **Add parameter settings for this shell task:**
+
+1. Fill in the "Node Name", "Description", and "Script" fields;
+2. Check “Normal” for “Run Flag”. If “Prohibit Execution” is checked, the task will not be executed when the workflow runs;
+3. Select "Task Priority": When the number of worker threads is insufficient, high-level tasks will be executed first in the execution queue, and tasks with the same priority will be executed in the order of first in, first out;
+4. Timeout alarm (optional): Check the timeout alarm, timeout failure, and fill in the "timeout period". When the task execution time exceeds **timeout period**, an alert email will be sent and the task timeout fails;
+5. Resources (optional). Resource files are files created or uploaded on the Resource Center -> File Management page. For example, the file name is `test.sh`, and the command to call the resource in the script is `sh test.sh`;
+6. Custom parameters (optional), refer to [Custom Parameters](#UserDefinedParameters);
+7. Click the "Confirm Add" button to save the task settings.
+
+- **Increase the order of task execution:** Click the icon in the upper right corner <img src="/img/line.png" width="35"/> to connect the task; as shown in the figure below, task 2 and task 3 are executed in parallel, When task 1 finished execute, tasks 2 and 3 will be executed simultaneously.
+
+ <p align="center">
+ <img src="/img/dag6.png" width="80%" />
+ </p>
+
+- **Delete dependencies:** Click the "arrow" icon in the upper right corner <img src="/img/arrow.png" width="35"/>, select the connection line, and click the "Delete" icon in the upper right corner <img src= "/img/delete.png" width="35"/>, delete dependencies between tasks.
+ <p align="center">
+ <img src="/img/dag7.png" width="80%" />
+ </p>
+
+- **Save workflow definition:** Click the "Save" button, and the "Set DAG chart name" pop-up box will pop up, as shown in the figure below. Enter the workflow definition name, workflow definition description, and set global parameters (optional, refer to [ Custom parameters](#UserDefinedParameters)), click the "Add" button, and the workflow definition is created successfully.
+ <p align="center">
+ <img src="/img/dag8.png" width="80%" />
+ </p>
+> For other types of tasks, please refer to [Task Node Type and Parameter Settings](#TaskParamers).
+
+#### 2.3.2 Workflow definition operation function
+
+Click Project Management -> Workflow -> Workflow Definition to enter the workflow definition page, as shown below:
+
+<p align="center">
+<img src="/img/work_list_en.png" width="80%" />
+</p>
+The operation functions of the workflow definition list are as follows:
+
+- **Edit:** Only "offline" workflow definitions can be edited. Workflow DAG editing is the same as [Create Workflow Definition](#creatDag).
+- **Online:** When the workflow status is "Offline", used to online workflow. Only the workflow in the "Online" state can run, but cannot be edited.
+- **Offline:** When the workflow status is "Online", used to offline workflow. Only the workflow in the "Offline" state can be edited, but not run.
+- **Run:** Only workflow in the online state can run. See [2.3.3 Run Workflow](#runWorkflow) for the operation steps
+- **Timing:** Timing can only be set in online workflows, and the system automatically schedules the workflow to run on a regular basis. The status after creating a timing is "offline", and the timing must be online on the timing management page to take effect. See [2.3.4 Workflow Timing](#creatTiming) for timing operation steps.
+- **Timing Management:** The timing management page can be edited, online/offline, and deleted.
+- **Delete:** Delete the workflow definition.
+- **Download:** Download workflow definition to local.
+- **Tree Diagram:** Display the task node type and task status in a tree structure, as shown in the figure below:
+ <p align="center">
+ <img src="/img/tree_en.png" width="80%" />
+ </p>
+
+#### <span id=runWorkflow>2.3.3 Run the workflow</span>
+
+- Click Project Management -> Workflow -> Workflow Definition to enter the workflow definition page, as shown in the figure below, click the "Go Online" button <img src="/img/online.png" width="35"/>,Go online workflow.
+ <p align="center">
+ <img src="/img/work_list_en.png" width="80%" />
+ </p>
+
+- Click the "Run" button to pop up the startup parameter setting pop-up box, as shown in the figure below, set the startup parameters, click the "Run" button in the pop-up box, the workflow starts running, and the workflow instance page generates a workflow instance.
+ <p align="center">
+ <img src="/img/run_work_en.png" width="80%" />
+ </p>
+ <span id=runParamers>Description of workflow operating parameters:</span>
+
+ * Failure strategy: When a task node fails to execute, other parallel task nodes need to execute the strategy. "Continue" means: after a certain task fails, other task nodes execute normally; "End" means: terminate all tasks being executed, and terminate the entire process.
+ * Notification strategy: When the process is over, the process execution information notification email is sent according to the process status, including any status is not sent, successful sent, failed sent, successful or failed sent.
+ * Process priority: The priority of process operation, divided into five levels: highest (HIGHEST), high (HIGH), medium (MEDIUM), low (LOW), and lowest (LOWEST). When the number of master threads is insufficient, high-level processes will be executed first in the execution queue, and processes with the same priority will be executed in a first-in first-out order.
+ * Worker group: The process can only be executed in the specified worker machine group. The default is Default, which can be executed on any worker.
+ * Notification group: select notification strategy||timeout alarm||when fault tolerance occurs, process information or email will be sent to all members in the notification group.
+ * Recipient: Select notification policy||Timeout alarm||When fault tolerance occurs, process information or alarm email will be sent to the recipient list.
+ * Cc: Select the notification strategy||Timeout alarm||When fault tolerance occurs, the process information or warning email will be copied to the CC list.
+ * Complement: Two modes including serial complement and parallel complement. Serial complement: within the specified time range, the complement is executed sequentially from the start date to the end date, and only one process instance is generated; parallel complement: within the specified time range, multiple days are complemented at the same time to generate N process instances.
+ * For example, you need to fill in the data from May 1 to May 10.
+
+ <p align="center">
+ <img src="/img/complement_en1.png" width="80%" />
+ </p>
+
+ > Serial mode: The complement is executed sequentially from May 1 to May 10, and a process instance is generated on the process instance page;
+
+ > Parallel mode: The tasks from May 1 to may 10 are executed simultaneously, and 10 process instances are generated on the process instance page.
+
+#### <span id=creatTiming>2.3.4 Workflow timing</span>
+
+- Create timing: Click Project Management->Workflow->Workflow Definition, enter the workflow definition page, go online the workflow, click the "timing" button <img src="/img/timing.png" width="35"/> ,The timing parameter setting dialog box pops up, as shown in the figure below:
+ <p align="center">
+ <img src="/img/time_schedule_en.png" width="80%" />
+ </p>
+- Choose the start and end time. In the start and end time range, the workflow is run at regular intervals; not in the start and end time range, no more regular workflow instances are generated.
+- Add a timing that is executed once every day at 5 AM, as shown in the following figure:
+ <p align="center">
+ <img src="/img/timer-en.png" width="80%" />
+ </p>
+- Failure strategy, notification strategy, process priority, worker group, notification group, recipient, and CC are the same as [workflow running parameters](#runParamers).
+- Click the "Create" button to create the timing successfully. At this time, the timing status is "**Offline**" and the timing needs to be **Online** to take effect.
+- Timing online: Click the "timing management" button <img src="/img/timeManagement.png" width="35"/>, enter the timing management page, click the "online" button, the timing status will change to "online", as shown in the below figure, the workflow takes effect regularly.
+ <p align="center">
+ <img src="/img/time-manage-list-en.png" width="80%" />
+ </p>
+
+#### 2.3.5 Import workflow
+
+Click Project Management -> Workflow -> Workflow Definition to enter the workflow definition page, click the "Import Workflow" button to import the local workflow file, the workflow definition list displays the imported workflow, and the status is offline.
+
+#### 2.4 Workflow instance
+
+#### 2.4.1 View workflow instance
+
+- Click Project Management -> Workflow -> Workflow Instance to enter the Workflow Instance page, as shown in the figure below:
+ <p align="center">
+ <img src="/img/instance-list-en.png" width="80%" />
+ </p>
+- Click the workflow name to enter the DAG view page to view the task execution status, as shown in the figure below.
+ <p align="center">
+ <img src="/img/instance-runs-en.png" width="80%" />
+ </p>
+
+#### 2.4.2 View task log
+
+- Enter the workflow instance page, click the workflow name, enter the DAG view page, double-click the task node, as shown in the following figure:
+ <p align="center">
+ <img src="/img/instanceViewLog-en.png" width="80%" />
+ </p>
+- Click "View Log", a log pop-up box will pop up, as shown in the figure below, the task log can also be viewed on the task instance page, refer to [Task View Log](#taskLog)。
+ <p align="center">
+ <img src="/img/task-log-en.png" width="80%" />
+ </p>
+
+#### 2.4.3 View task history
+
+- Click Project Management -> Workflow -> Workflow Instance to enter the workflow instance page, and click the workflow name to enter the workflow DAG page;
+- Double-click the task node, as shown in the figure below, click "View History" to jump to the task instance page, and display a list of task instances running by the workflow instance
+ <p align="center">
+ <img src="/img/task_history_en.png" width="80%" />
+ </p>
+
+#### 2.4.4 View operating parameters
+
+- Click Project Management -> Workflow -> Workflow Instance to enter the workflow instance page, and click the workflow name to enter the workflow DAG page;
+- Click the icon in the upper left corner <img src="/img/run_params_button.png" width="35"/>,View the startup parameters of the workflow instance; click the icon <img src="/img/global_param.png" width="35"/>,View the global and local parameters of the workflow instance, as shown in the following figure:
+ <p align="center">
+ <img src="/img/run_params_en.png" width="80%" />
+ </p>
+
+#### 2.4.4 Workflow instance operation function
+
+Click Project Management -> Workflow -> Workflow Instance to enter the Workflow Instance page, as shown in the figure below:
+
+ <p align="center">
+ <img src="/img/instance-list-en.png" width="80%" />
+ </p>
+
+- **Edit:** Only terminated processes can be edited. Click the "Edit" button or the name of the workflow instance to enter the DAG edit page. After edit, click the "Save" button to pop up the Save DAG pop-up box, as shown in the figure below. In the pop-up box, check "Whether to update to workflow definition" and save After that, the workflow definition will be updated; if it is not checked, the workflow definition will not be updated.
+ <p align="center">
+ <img src="/img/editDag-en.png" width="80%" />
+ </p>
+- **Rerun:** Re-execute the terminated process.
+- **Recovery failed:** For failed processes, you can perform recovery operations, starting from the failed node.
+- **Stop:** To **stop** the running process, the background will first `kill`worker process, and then execute `kill -9` operation
+- **Pause:** Perform a **pause** operation on the running process, the system status will change to **waiting for execution**, it will wait for the end of the task being executed, and pause the next task to be executed.
+- **Resume pause:** To resume the paused process, start running directly from the **paused node**
+- **Delete:** Delete the workflow instance and the task instance under the workflow instance
+- **Gantt chart:** The vertical axis of the Gantt chart is the topological sorting of task instances under a certain workflow instance, and the horizontal axis is the running time of the task instances, as shown in the figure:
+ <p align="center">
+ <img src="/img/gantt-en.png" width="80%" />
+ </p>
+
+#### 2.5 Task instance
+
+- Click Project Management -> Workflow -> Task Instance to enter the task instance page, as shown in the figure below, click the name of the workflow instance, you can jump to the workflow instance DAG chart to view the task status.
+ <p align="center">
+ <img src="/img/task-list-en.png" width="80%" />
+ </p>
+
+- <span id=taskLog>View log:</span>Click the "view log" button in the operation column to view the log of task execution.
+ <p align="center">
+ <img src="/img/task-log2-en.png" width="80%" />
+ </p>
+
+### 3. Resource Center
+
+#### 3.1 hdfs resource configuration
+
+- Upload resource files and udf functions, all uploaded files and resources will be stored on hdfs, so the following configuration items are required:
+
+```
+
+conf/common/common.properties
+ # Users who have permission to create directories under the HDFS root path
+ hdfs.root.user=hdfs
+ # data base dir, resource file will store to this hadoop hdfs path, self configuration, please make sure the directory exists on hdfs and have read write permissions。"/escheduler" is recommended
+ data.store2hdfs.basepath=/dolphinscheduler
+ # resource upload startup type : HDFS,S3,NONE
+ res.upload.startup.type=HDFS
+ # whether kerberos starts
+ hadoop.security.authentication.startup.state=false
+ # java.security.krb5.conf path
+ java.security.krb5.conf.path=/opt/krb5.conf
+ # loginUserFromKeytab user
+ login.user.keytab.username=hdfs-mycluster@ESZ.COM
+ # loginUserFromKeytab path
+ login.user.keytab.path=/opt/hdfs.headless.keytab
+
+conf/common/hadoop.properties
+ # ha or single namenode,If namenode ha needs to copy core-site.xml and hdfs-site.xml
+ # to the conf directory,support s3,for example : s3a://dolphinscheduler
+ fs.defaultFS=hdfs://mycluster:8020
+ #resourcemanager ha note this need ips , this empty if single
+ yarn.resourcemanager.ha.rm.ids=192.168.xx.xx,192.168.xx.xx
+ # If it is a single resourcemanager, you only need to configure one host name. If it is resourcemanager HA, the default configuration is fine
+ yarn.application.status.address=http://xxxx:8088/ws/v1/cluster/apps/%s
+
+```
+
+- Only one address needs to be configured for yarn.resourcemanager.ha.rm.ids and yarn.application.status.address, and the other address is empty.
+- You need to copy core-site.xml and hdfs-site.xml from the conf directory of the Hadoop cluster to the conf directory of the dolphinscheduler project, and restart the api-server service.
+
+#### 3.2 File management
+
+> It is the management of various resource files, including creating basic txt/log/sh/conf/py/java and other files, uploading jar packages and other types of files, and can do edit, rename, download, delete and other operations.
+
+ <p align="center">
+ <img src="/img/file-manage-en.png" width="80%" />
+ </p>
+
+- Create a file
+ > The file format supports the following types: txt, log, sh, conf, cfg, py, java, sql, xml, hql, properties
+
+<p align="center">
+ <img src="/img/file_create_en.png" width="80%" />
+ </p>
+
+- upload files
+
+> Upload file: Click the "Upload File" button to upload, drag the file to the upload area, the file name will be automatically completed with the uploaded file name
+
+<p align="center">
+ <img src="/img/file-upload-en.png" width="80%" />
+ </p>
+
+- File View
+
+> For the file types that can be viewed, click the file name to view the file details
+
+<p align="center">
+ <img src="/img/file_detail_en.png" width="80%" />
+ </p>
+
+- download file
+
+> Click the "Download" button in the file list to download the file or click the "Download" button in the upper right corner of the file details to download the file
+
+- File rename
+
+<p align="center">
+ <img src="/img/file_rename_en.png" width="80%" />
+ </p>
+
+- delete
+ > File list -> Click the "Delete" button to delete the specified file
+
+#### 3.3 UDF management
+
+#### 3.3.1 Resource management
+
+> The resource management and file management functions are similar. The difference is that the resource management is the uploaded UDF function, and the file management uploads the user program, script and configuration file.
+> Operation function: rename, download, delete.
+
+- Upload udf resources
+ > Same as uploading files.
+
+#### 3.3.2 Function management
+
+- Create UDF function
+ > Click "Create UDF Function", enter the udf function parameters, select the udf resource, and click "Submit" to create the udf function.
+
+> Currently only supports temporary UDF functions of HIVE
+
+- UDF function name: the name when the UDF function is entered
+- Package name Class name: Enter the full path of the UDF function
+- UDF resource: Set the resource file corresponding to the created UDF
+
+<p align="center">
+ <img src="/img/udf_edit_en.png" width="80%" />
+ </p>
+
+### 4. Create data source
+
+> Data source center supports MySQL, POSTGRESQL, HIVE/IMPALA, SPARK, CLICKHOUSE, ORACLE, SQLSERVER and other data sources
+
+#### 4.1 Create/Edit MySQL data source
+
+- Click "Data Source Center -> Create Data Source" to create different types of data sources according to requirements.
+
+- Data source: select MYSQL
+- Data source name: enter the name of the data source
+- Description: Enter a description of the data source
+- IP hostname: enter the IP to connect to MySQL
+- Port: Enter the port to connect to MySQL
+- Username: Set the username for connecting to MySQL
+- Password: Set the password for connecting to MySQL
+- Database name: Enter the name of the database connected to MySQL
+- Jdbc connection parameters: parameter settings for MySQL connection, filled in in JSON form
+
+<p align="center">
+ <img src="/img/mysql-en.png" width="80%" />
+ </p>
+
+> Click "Test Connection" to test whether the data source can be successfully connected.
+
+#### 4.2 Create/Edit POSTGRESQL data source
+
+- Data source: select POSTGRESQL
+- Data source name: enter the name of the data source
+- Description: Enter a description of the data source
+- IP/Host Name: Enter the IP to connect to POSTGRESQL
+- Port: Enter the port to connect to POSTGRESQL
+- Username: Set the username for connecting to POSTGRESQL
+- Password: Set the password for connecting to POSTGRESQL
+- Database name: Enter the name of the database connected to POSTGRESQL
+- Jdbc connection parameters: parameter settings for POSTGRESQL connection, filled in in JSON form
+
+<p align="center">
+ <img src="/img/postgresql-en.png" width="80%" />
+ </p>
+
+#### 4.3 Create/Edit HIVE data source
+
+1.Use HiveServer2 to connect
+
+ <p align="center">
+ <img src="/img/hive-en.png" width="80%" />
+ </p>
+
+- Data source: select HIVE
+- Data source name: enter the name of the data source
+- Description: Enter a description of the data source
+- IP/Host Name: Enter the IP connected to HIVE
+- Port: Enter the port connected to HIVE
+- Username: Set the username for connecting to HIVE
+- Password: Set the password for connecting to HIVE
+- Database name: Enter the name of the database connected to HIVE
+- Jdbc connection parameters: parameter settings for HIVE connection, filled in in JSON form
+
+ 2.Use HiveServer2 HA Zookeeper to connect
+
+ <p align="center">
+ <img src="/img/hive1-en.png" width="80%" />
+ </p>
+
+Note: If you enable **kerberos**, you need to fill in **Principal**
+
+<p align="center">
+ <img src="/img/hive-en.png" width="80%" />
+ </p>
+
+#### 4.4 Create/Edit Spark data source
+
+<p align="center">
+ <img src="/img/spark-en.png" width="80%" />
+ </p>
+
+- Data source: select Spark
+- Data source name: enter the name of the data source
+- Description: Enter a description of the data source
+- IP/Hostname: Enter the IP connected to Spark
+- Port: Enter the port connected to Spark
+- Username: Set the username for connecting to Spark
+- Password: Set the password for connecting to Spark
+- Database name: Enter the name of the database connected to Spark
+- Jdbc connection parameters: parameter settings for Spark connection, filled in in JSON form
+
+### 5. Security Center (Permission System)
+
+ * Only the administrator account in the security center has the authority to operate. It has functions such as queue management, tenant management, user management, alarm group management, worker group management, token management, etc. In the user management module, resources, data sources, projects, etc. Authorization
+ * Administrator login, default user name and password: admin/dolphinscheduler123
+
+#### 5.1 Create queue
+
+- Queue is used when the "queue" parameter is needed to execute programs such as spark and mapreduce.
+- The administrator enters the Security Center->Queue Management page and clicks the "Create Queue" button to create a queue.
+<p align="center">
+ <img src="/img/create-queue-en.png" width="80%" />
+ </p>
+
+#### 5.2 Add tenant
+
+- The tenant corresponds to the Linux user, which is used by the worker to submit the job. If Linux does not have this user, the worker will create this user when executing the script.
+- Tenant Code: **Tenant Code is the only user on Linux and cannot be repeated**
+- The administrator enters the Security Center->Tenant Management page and clicks the "Create Tenant" button to create a tenant.
+
+ <p align="center">
+ <img src="/img/addtenant-en.png" width="80%" />
+ </p>
+
+#### 5.3 Create normal user
+
+- Users are divided into **administrator users** and **normal users**
+
+ - The administrator has authorization and user management authority, but does not have the authority to create project and workflow definition operations.
+ - Ordinary users can create projects and create, edit, and execute workflow definitions.
+ - Note: If the user switches tenants, all resources under the tenant where the user belongs will be copied to the new tenant that is switched.
+
+- The administrator enters the Security Center -> User Management page and clicks the "Create User" button to create a user.
+<p align="center">
+ <img src="/img/user-en.png" width="80%" />
+ </p>
+
+> **Edit user information**
+
+- The administrator enters the Security Center->User Management page and clicks the "Edit" button to edit user information.
+- After an ordinary user logs in, click the user information in the user name drop-down box to enter the user information page, and click the "Edit" button to edit the user information.
+
+> **Modify user password**
+
+- The administrator enters the Security Center->User Management page and clicks the "Edit" button. When editing user information, enter the new password to modify the user password.
+- After a normal user logs in, click the user information in the user name drop-down box to enter the password modification page, enter the password and confirm the password and click the "Edit" button, then the password modification is successful.
+
+#### 5.4 Create alarm group
+
+- The alarm group is a parameter set at startup. After the process ends, the status of the process and other information will be sent to the alarm group in the form of email.
+
+* The administrator enters the Security Center -> Alarm Group Management page and clicks the "Create Alarm Group" button to create an alarm group.
+
+ <p align="center">
+ <img src="/img/mail-en.png" width="80%" />
+
+#### 5.5 Token management
+
+> Since the back-end interface has login check, token management provides a way to perform various operations on the system by calling the interface.
+
+- The administrator enters the Security Center -> Token Management page, clicks the "Create Token" button, selects the expiration time and user, clicks the "Generate Token" button, and clicks the "Submit" button, then the selected user's token is created successfully.
+
+ <p align="center">
+ <img src="/img/create-token-en.png" width="80%" />
+ </p>
+
+ - After an ordinary user logs in, click the user information in the user name drop-down box, enter the token management page, select the expiration time, click the "generate token" button, and click the "submit" button, then the user creates a token successfully.
+ - Call example:
+
+```
+Token call example
+ /**
+ * test token
+ */
+ public void doPOSTParam()throws Exception{
+ // create HttpClient
+ CloseableHttpClient httpclient = HttpClients.createDefault();
+
+ // create http post request
+ HttpPost httpPost = new HttpPost("http://127.0.0.1:12345/escheduler/projects/create");
+ httpPost.setHeader("token", "123");
+ // set parameters
+ List<NameValuePair> parameters = new ArrayList<NameValuePair>();
+ parameters.add(new BasicNameValuePair("projectName", "qzw"));
+ parameters.add(new BasicNameValuePair("desc", "qzw"));
+ UrlEncodedFormEntity formEntity = new UrlEncodedFormEntity(parameters);
+ httpPost.setEntity(formEntity);
+ CloseableHttpResponse response = null;
+ try {
+ // execute
+ response = httpclient.execute(httpPost);
+ // response status code 200
+ if (response.getStatusLine().getStatusCode() == 200) {
+ String content = EntityUtils.toString(response.getEntity(), "UTF-8");
+ System.out.println(content);
+ }
+ } finally {
+ if (response != null) {
+ response.close();
+ }
+ httpclient.close();
+ }
+ }
+```
+
+#### 5.6 Granted permission
+
+ * Granted permissions include project permissions, resource permissions, data source permissions, UDF function permissions.
+ * The administrator can authorize the projects, resources, data sources and UDF functions not created by ordinary users. Because the authorization methods for projects, resources, data sources and UDF functions are the same, we take project authorization as an example.
+ * Note: For projects created by users themselves, the user has all permissions. The project list and the selected project list will not be displayed.
+
+- The administrator enters the Security Center -> User Management page and clicks the "Authorize" button of the user who needs to be authorized, as shown in the figure below:
+ <p align="center">
+ <img src="/img/auth-en.png" width="80%" />
+</p>
+
+- Select the project to authorize the project.
+
+<p align="center">
+ <img src="/img/authproject-en.png" width="80%" />
+ </p>
+
+- Resources, data sources, and UDF function authorization are the same as project authorization.
+
+### 6. monitoring Center
+
+#### 6.1 Service management
+
+- Service management is mainly to monitor and display the health status and basic information of each service in the system
+
+#### 6.1.1 master monitoring
+
+- Mainly related to master information.
+<p align="center">
+ <img src="/img/master-jk-en.png" width="80%" />
+ </p>
+
+#### 6.1.2 worker monitoring
+
+- Mainly related to worker information.
+
+<p align="center">
+ <img src="/img/worker-jk-en.png" width="80%" />
+ </p>
+
+#### 6.1.3 Zookeeper monitoring
+
+- Mainly related configuration information of each worker and master in zookpeeper.
+
+<p align="center">
+ <img src="/img/zookeeper-monitor-en.png" width="80%" />
+ </p>
+
+#### 6.1.4 DB monitoring
+
+- Mainly the health of the DB
+
+<p align="center">
+ <img src="/img/mysql-jk-en.png" width="80%" />
+ </p>
+
+#### 6.2 Statistics management
+
+<p align="center">
+ <img src="/img/statistics-en.png" width="80%" />
+ </p>
+
+- Number of commands to be executed: statistics on the t_ds_command table
+- The number of failed commands: statistics on the t_ds_error_command table
+- Number of tasks to run: Count the data of task_queue in Zookeeper
+- Number of tasks to be killed: Count the data of task_kill in Zookeeper
+
+### 7. <span id=TaskParamers>Task node type and parameter settings</span>
+
+#### 7.1 Shell node
+
+> Shell node, when the worker is executed, a temporary shell script is generated, and the linux user with the same name as the tenant executes the script.
+
+- Click Project Management-Project Name-Workflow Definition, and click the "Create Workflow" button to enter the DAG editing page.
+- Drag <img src="/img/shell.png" width="35"/> from the toolbar to the drawing board, as shown in the figure below:
+
+ <p align="center">
+ <img src="/img/shell-en.png" width="80%" />
+ </p>
+
+- Node name: The node name in a workflow definition is unique.
+- Run flag: Identifies whether this node can be scheduled normally, if it does not need to be executed, you can turn on the prohibition switch.
+- Descriptive information: describe the function of the node.
+- Task priority: When the number of worker threads is insufficient, they are executed in order from high to low, and when the priority is the same, they are executed according to the first-in first-out principle.
+- Worker grouping: Tasks are assigned to the machines of the worker group to execute. If Default is selected, a worker machine will be randomly selected for execution.
+- Number of failed retry attempts: The number of times the task failed to be resubmitted. It supports drop-down and hand-filling.
+- Failed retry interval: The time interval for resubmitting the task after a failed task. It supports drop-down and hand-filling.
+- Timeout alarm: Check the timeout alarm and timeout failure. When the task exceeds the "timeout period", an alarm email will be sent and the task execution will fail.
+- Script: SHELL program developed by users.
+- Resource: Refers to the list of resource files that need to be called in the script, and the files uploaded or created by the resource center-file management.
+- User-defined parameters: It is a user-defined parameter that is part of SHELL, which will replace the content with \${variable} in the script.
+
+#### 7.2 Sub-process node
+
+- The sub-process node is to execute a certain external workflow definition as a task node.
+ > Drag the  task node in the toolbar to the drawing board, as shown in the following figure:
+
+<p align="center">
+ <img src="/img/sub-process-en.png" width="80%" />
+ </p>
+
+- Node name: The node name in a workflow definition is unique
+- Run flag: identify whether this node can be scheduled normally
+- Descriptive information: describe the function of the node
+- Timeout alarm: Check the timeout alarm and timeout failure. When the task exceeds the "timeout period", an alarm email will be sent and the task execution will fail.
+- Sub-node: It is the workflow definition of the selected sub-process. Enter the sub-node in the upper right corner to jump to the workflow definition of the selected sub-process
+
+#### 7.3 DEPENDENT node
+
+- Dependent nodes are **dependency check nodes**. For example, process A depends on the successful execution of process B yesterday, and the dependent node will check whether process B has a successful execution yesterday.
+
+> Drag the  task node in the toolbar to the drawing board, as shown in the following figure:
+
+<p align="center">
+ <img src="/img/dependent-nodes-en.png" width="80%" />
+ </p>
+
+> The dependent node provides a logical judgment function, such as checking whether the B process was successful yesterday, or whether the C process was executed successfully.
+
+ <p align="center">
+ <img src="/img/depend-node-en.png" width="80%" />
+ </p>
+
+> For example, process A is a weekly report task, processes B and C are daily tasks, and task A requires tasks B and C to be successfully executed every day of the last week, as shown in the figure:
+
+ <p align="center">
+ <img src="/img/depend-node1-en.png" width="80%" />
+ </p>
+
+> If the weekly report A also needs to be executed successfully last Tuesday:
+
+ <p align="center">
+ <img src="/img/depend-node3-en.png" width="80%" />
+ </p>
+
+#### 7.4 Stored procedure node
+
+- According to the selected data source, execute the stored procedure.
+ > Drag in the toolbarThe task node to the drawing board, as shown in the following figure:
+
+<p align="center">
+ <img src="/img/procedure-en.png" width="80%" />
+ </p>
+
+- Data source: The data source type of the stored procedure supports MySQL and POSTGRESQL, select the corresponding data source
+- Method: is the method name of the stored procedure
+- Custom parameters: The custom parameter types of the stored procedure support IN and OUT, and the data types support nine data types: VARCHAR, INTEGER, LONG, FLOAT, DOUBLE, DATE, TIME, TIMESTAMP, and BOOLEAN
+
+#### 7.5 SQL node
+
+- Drag in the toolbarTask node into the drawing board
+- Non-query SQL function: edit non-query SQL task information, select non-query for sql type, as shown in the figure below:
+ <p align="center">
+ <img src="/img/sql-en.png" width="80%" />
+</p>
+
+- Query SQL function: Edit and query SQL task information, sql type selection query, select form or attachment to send mail to the specified recipient, as shown in the figure below.
+
+<p align="center">
+ <img src="/img/sql-node-en.png" width="80%" />
+ </p>
+
+- Data source: select the corresponding data source
+- sql type: supports query and non-query. The query is a select type query, which is returned with a result set. You can specify three templates for email notification as form, attachment or form attachment. Non-queries are returned without a result set, and are for three types of operations: update, delete, and insert.
+- sql parameter: the input parameter format is key1=value1;key2=value2...
+- sql statement: SQL statement
+- UDF function: For data sources of type HIVE, you can refer to UDF functions created in the resource center. UDF functions are not supported for other types of data sources.
+- Custom parameters: SQL task type, and stored procedure is a custom parameter order to set values for the method. The custom parameter type and data type are the same as the stored procedure task type. The difference is that the SQL task type custom parameter will replace the \${variable} in the SQL statement.
+- Pre-sql: Pre-sql is executed before the sql statement.
+- Post-sql: Post-sql is executed after the sql statement.
+
+#### 7.6 SPARK node
+
+- Through the SPARK node, you can directly execute the SPARK program. For the spark node, the worker will use the `spark-submit` method to submit tasks
+
+> Drag in the toolbarThe task node to the drawing board, as shown in the following figure:
+
+<p align="center">
+ <img src="/img/spark-submit-en.png" width="80%" />
+ </p>
+
+- Program type: supports JAVA, Scala and Python three languages
+- The class of the main function: is the full path of the Spark program’s entry Main Class
+- Main jar package: Spark jar package
+- Deployment mode: support three modes of yarn-cluster, yarn-client and local
+- Driver core number: You can set the number of Driver cores and the number of memory
+- Number of Executors: You can set the number of Executors, the number of Executor memory, and the number of Executor cores
+- Command line parameters: Set the input parameters of the Spark program and support the substitution of custom parameter variables.
+- Other parameters: support --jars, --files, --archives, --conf format
+- Resource: If the resource file is referenced in other parameters, you need to select and specify in the resource
+- User-defined parameter: It is a user-defined parameter of the MR part, which will replace the content with \${variable} in the script
+
+Note: JAVA and Scala are only used for identification, there is no difference, if it is Spark developed by Python, there is no main function class, and the others are the same
+
+#### 7.7 MapReduce(MR) node
+
+- Using the MR node, you can directly execute the MR program. For the mr node, the worker will use the `hadoop jar` method to submit tasks
+
+> Drag the  task node in the toolbar to the drawing board, as shown in the following figure:
+
+1. JAVA program
+
+ <p align="center">
+ <img src="/img/mr_java_en.png" width="80%" />
+ </p>
+
+- The class of the main function: is the full path of the Main Class, the entry point of the MR program
+- Program type: select JAVA language
+- Main jar package: is the MR jar package
+- Command line parameters: set the input parameters of the MR program and support the substitution of custom parameter variables
+- Other parameters: support -D, -files, -libjars, -archives format
+- Resource: If the resource file is referenced in other parameters, you need to select and specify in the resource
+- User-defined parameter: It is a user-defined parameter of the MR part, which will replace the content with \${variable} in the script
+
+2. Python program
+
+<p align="center">
+ <img src="/img/mr_edit_en.png" width="80%" />
+ </p>
+
+- Program type: select Python language
+- Main jar package: is the Python jar package for running MR
+- Other parameters: support -D, -mapper, -reducer, -input -output format, here you can set the input of user-defined parameters, such as:
+- -mapper "mapper.py 1" -file mapper.py -reducer reducer.py -file reducer.py –input /journey/words.txt -output /journey/out/mr/\${currentTimeMillis}
+- The mapper.py 1 after -mapper is two parameters, the first parameter is mapper.py, and the second parameter is 1
+- Resource: If the resource file is referenced in other parameters, you need to select and specify in the resource
+- User-defined parameter: It is a user-defined parameter of the MR part, which will replace the content with \${variable} in the script
+
+#### 7.8 Python Node
+
+- Using python nodes, you can directly execute python scripts. For python nodes, workers will use `python **` to submit tasks.
+
+> Drag in the toolbarThe task node to the drawing board, as shown in the following figure:
+
+<p align="center">
+ <img src="/img/python-en.png" width="80%" />
+ </p>
+
+- Script: Python program developed by the user
+- Resources: refers to the list of resource files that need to be called in the script
+- User-defined parameter: It is a local user-defined parameter of Python, which will replace the content with \${variable} in the script
+
+#### 7.9 Flink Node
+
+- Drag in the toolbar<img src="/img/flink.png" width="35"/>The task node to the drawing board, as shown in the following figure:
+
+<p align="center">
+ <img src="/img/flink-en.png" width="80%" />
+</p>
+
+- Program type: supports JAVA, Scala and Python three languages
+- The class of the main function: is the full path of the Main Class, the entry point of the Flink program
+- Main jar package: is the Flink jar package
+- Deployment mode: support three modes of cluster and local
+- Number of slots: You can set the number of slots
+- Number of taskManage: You can set the number of taskManage
+- JobManager memory number: You can set the jobManager memory number
+- TaskManager memory number: You can set the taskManager memory number
+- Command line parameters: Set the input parameters of the Spark program and support the substitution of custom parameter variables.
+- Other parameters: support --jars, --files, --archives, --conf format
+- Resource: If the resource file is referenced in other parameters, you need to select and specify in the resource
+- Custom parameter: It is a local user-defined parameter of Flink, which will replace the content with \${variable} in the script
+
+Note: JAVA and Scala are only used for identification, there is no difference, if it is Flink developed by Python, there is no class of the main function, the others are the same
+
+#### 7.10 http Node
+
+- Drag in the toolbar<img src="/img/http.png" width="35"/>The task node to the drawing board, as shown in the following figure:
+
+<p align="center">
+ <img src="/img/http-en.png" width="80%" />
+ </p>
+
+- Node name: The node name in a workflow definition is unique.
+- Run flag: Identifies whether this node can be scheduled normally, if it does not need to be executed, you can turn on the prohibition switch.
+- Descriptive information: describe the function of the node.
+- Task priority: When the number of worker threads is insufficient, they are executed in order from high to low, and when the priority is the same, they are executed according to the first-in first-out principle.
+- Worker grouping: Tasks are assigned to the machines of the worker group to execute. If Default is selected, a worker machine will be randomly selected for execution.
+- Number of failed retry attempts: The number of times the task failed to be resubmitted. It supports drop-down and hand-filling.
+- Failed retry interval: The time interval for resubmitting the task after a failed task. It supports drop-down and hand-filling.
+- Timeout alarm: Check the timeout alarm and timeout failure. When the task exceeds the "timeout period", an alarm email will be sent and the task execution will fail.
+- Request address: http request URL.
+- Request type: support GET, POSt, HEAD, PUT, DELETE.
+- Request parameters: Support Parameter, Body, Headers.
+- Verification conditions: support default response code, custom response code, content included, content not included.
+- Verification content: When the verification condition selects a custom response code, the content contains, and the content does not contain, the verification content is required.
+- Custom parameter: It is a user-defined parameter of http part, which will replace the content with \${variable} in the script.
+
+#### 7.11 DATAX Node
+
+- Drag in the toolbar<img src="/img/datax.png" width="35"/>Task node into the drawing board
+
+ <p align="center">
+ <img src="/img/datax-en.png" width="80%" />
+ </p>
+
+- Custom template: When you turn on the custom template switch, you can customize the content of the json configuration file of the datax node (applicable when the control configuration does not meet the requirements)
+- Data source: select the data source to extract the data
+- sql statement: the sql statement used to extract data from the target database, the sql query column name is automatically parsed when the node is executed, and mapped to the target table synchronization column name. When the source table and target table column names are inconsistent, they can be converted by column alias (as)
+- Target library: select the target library for data synchronization
+- Target table: the name of the target table for data synchronization
+- Pre-sql: Pre-sql is executed before the sql statement (executed by the target library).
Review comment:
```suggestion
- Pre-sql: Pre-sql is executed before the sql statement (executed by the target database).
```
##########
File path: docs/en-us/1.3.2/user_doc/system-manual.md
##########
@@ -0,0 +1,886 @@
+# System User Manual
+
+## Get started quickly
+
+> Please refer to [Quick Start](quick-start.html)
+
+## Operation guide
+
+### 1. Home
+
+The home page contains task status statistics, process status statistics, and workflow definition statistics for all projects of the user.
+
+<p align="center">
+<img src="/img/home_en.png" width="80%" />
+</p>
+
+### 2. Project management
+
+#### 2.1 Create project
+
+- Click "Project Management" to enter the project management page, click the "Create Project" button, enter the project name, project description, and click "Submit" to create a new project.
+
+ <p align="center">
+ <img src="/img/create_project_en1.png" width="80%" />
+ </p>
+
+#### 2.2 Project home
+
+- Click the project name link on the project management page to enter the project home page, as shown in the figure below, the project home page contains the task status statistics, process status statistics, and workflow definition statistics of the project.
+ <p align="center">
+ <img src="/img/project_home_en.png" width="80%" />
+ </p>
+
+- Task status statistics: within the specified time range, count the number of task instances as successful submission, running, ready to pause, pause, ready to stop, stop, failure, success, fault tolerance, kill, and waiting threads
+- Process status statistics: within the specified time range, count the number of the status of the workflow instance as submission success, running, ready to pause, pause, ready to stop, stop, failure, success, fault tolerance, kill, and waiting threads
+- Workflow definition statistics: Count the workflow definitions created by this user and the workflow definitions granted to this user by the administrator
+
+#### 2.3 Workflow definition
+
+#### <span id=creatDag>2.3.1 Create workflow definition</span>
+
+- Click Project Management -> Workflow -> Workflow Definition to enter the workflow definition page, and click the "Create Workflow" button to enter the **workflow DAG edit** page, as shown in the following figure:
+ <p align="center">
+ <img src="/img/dag5.png" width="80%" />
+ </p>
+- Drag in the toolbar <img src="/img/shell.png" width="35"/> Add a Shell task to the drawing board, as shown in the figure below:
+ <p align="center">
+ <img src="/img/shell-en.png" width="80%" />
+ </p>
+- **Add parameter settings for this shell task:**
+
+1. Fill in the "Node Name", "Description", and "Script" fields;
+2. Check “Normal” for “Run Flag”. If “Prohibit Execution” is checked, the task will not be executed when the workflow runs;
+3. Select "Task Priority": When the number of worker threads is insufficient, high-level tasks will be executed first in the execution queue, and tasks with the same priority will be executed in the order of first in, first out;
+4. Timeout alarm (optional): Check the timeout alarm, timeout failure, and fill in the "timeout period". When the task execution time exceeds **timeout period**, an alert email will be sent and the task timeout fails;
+5. Resources (optional). Resource files are files created or uploaded on the Resource Center -> File Management page. For example, the file name is `test.sh`, and the command to call the resource in the script is `sh test.sh`;
+6. Custom parameters (optional), refer to [Custom Parameters](#UserDefinedParameters);
+7. Click the "Confirm Add" button to save the task settings.
+
+- **Increase the order of task execution:** Click the icon in the upper right corner <img src="/img/line.png" width="35"/> to connect the task; as shown in the figure below, task 2 and task 3 are executed in parallel, When task 1 finished execute, tasks 2 and 3 will be executed simultaneously.
+
+ <p align="center">
+ <img src="/img/dag6.png" width="80%" />
+ </p>
+
+- **Delete dependencies:** Click the "arrow" icon in the upper right corner <img src="/img/arrow.png" width="35"/>, select the connection line, and click the "Delete" icon in the upper right corner <img src= "/img/delete.png" width="35"/>, delete dependencies between tasks.
+ <p align="center">
+ <img src="/img/dag7.png" width="80%" />
+ </p>
+
+- **Save workflow definition:** Click the "Save" button, and the "Set DAG chart name" pop-up box will pop up, as shown in the figure below. Enter the workflow definition name, workflow definition description, and set global parameters (optional, refer to [ Custom parameters](#UserDefinedParameters)), click the "Add" button, and the workflow definition is created successfully.
+ <p align="center">
+ <img src="/img/dag8.png" width="80%" />
+ </p>
+> For other types of tasks, please refer to [Task Node Type and Parameter Settings](#TaskParamers).
+
+#### 2.3.2 Workflow definition operation function
+
+Click Project Management -> Workflow -> Workflow Definition to enter the workflow definition page, as shown below:
+
+<p align="center">
+<img src="/img/work_list_en.png" width="80%" />
+</p>
+The operation functions of the workflow definition list are as follows:
+
+- **Edit:** Only "offline" workflow definitions can be edited. Workflow DAG editing is the same as [Create Workflow Definition](#creatDag).
+- **Online:** When the workflow status is "Offline", used to online workflow. Only the workflow in the "Online" state can run, but cannot be edited.
+- **Offline:** When the workflow status is "Online", used to offline workflow. Only the workflow in the "Offline" state can be edited, but not run.
+- **Run:** Only workflow in the online state can run. See [2.3.3 Run Workflow](#runWorkflow) for the operation steps
+- **Timing:** Timing can only be set in online workflows, and the system automatically schedules the workflow to run on a regular basis. The status after creating a timing is "offline", and the timing must be online on the timing management page to take effect. See [2.3.4 Workflow Timing](#creatTiming) for timing operation steps.
+- **Timing Management:** The timing management page can be edited, online/offline, and deleted.
+- **Delete:** Delete the workflow definition.
+- **Download:** Download workflow definition to local.
+- **Tree Diagram:** Display the task node type and task status in a tree structure, as shown in the figure below:
+ <p align="center">
+ <img src="/img/tree_en.png" width="80%" />
+ </p>
+
+#### <span id=runWorkflow>2.3.3 Run the workflow</span>
+
+- Click Project Management -> Workflow -> Workflow Definition to enter the workflow definition page, as shown in the figure below, click the "Go Online" button <img src="/img/online.png" width="35"/>,Go online workflow.
+ <p align="center">
+ <img src="/img/work_list_en.png" width="80%" />
+ </p>
+
+- Click the "Run" button to pop up the startup parameter setting pop-up box, as shown in the figure below, set the startup parameters, click the "Run" button in the pop-up box, the workflow starts running, and the workflow instance page generates a workflow instance.
+ <p align="center">
+ <img src="/img/run_work_en.png" width="80%" />
+ </p>
+ <span id=runParamers>Description of workflow operating parameters:</span>
+
+ * Failure strategy: When a task node fails to execute, other parallel task nodes need to execute the strategy. "Continue" means: after a certain task fails, other task nodes execute normally; "End" means: terminate all tasks being executed, and terminate the entire process.
+ * Notification strategy: When the process is over, the process execution information notification email is sent according to the process status, including any status is not sent, successful sent, failed sent, successful or failed sent.
+ * Process priority: The priority of process operation, divided into five levels: highest (HIGHEST), high (HIGH), medium (MEDIUM), low (LOW), and lowest (LOWEST). When the number of master threads is insufficient, high-level processes will be executed first in the execution queue, and processes with the same priority will be executed in a first-in first-out order.
+ * Worker group: The process can only be executed in the specified worker machine group. The default is Default, which can be executed on any worker.
+ * Notification group: select notification strategy||timeout alarm||when fault tolerance occurs, process information or email will be sent to all members in the notification group.
+ * Recipient: Select notification policy||Timeout alarm||When fault tolerance occurs, process information or alarm email will be sent to the recipient list.
+ * Cc: Select the notification strategy||Timeout alarm||When fault tolerance occurs, the process information or warning email will be copied to the CC list.
+ * Complement: Two modes including serial complement and parallel complement. Serial complement: within the specified time range, the complement is executed sequentially from the start date to the end date, and only one process instance is generated; parallel complement: within the specified time range, multiple days are complemented at the same time to generate N process instances.
+ * For example, you need to fill in the data from May 1 to May 10.
+
+ <p align="center">
+ <img src="/img/complement_en1.png" width="80%" />
+ </p>
+
+ > Serial mode: The complement is executed sequentially from May 1 to May 10, and a process instance is generated on the process instance page;
+
+ > Parallel mode: The tasks from May 1 to may 10 are executed simultaneously, and 10 process instances are generated on the process instance page.
+
+#### <span id=creatTiming>2.3.4 Workflow timing</span>
+
+- Create timing: Click Project Management->Workflow->Workflow Definition, enter the workflow definition page, go online the workflow, click the "timing" button <img src="/img/timing.png" width="35"/> ,The timing parameter setting dialog box pops up, as shown in the figure below:
+ <p align="center">
+ <img src="/img/time_schedule_en.png" width="80%" />
+ </p>
+- Choose the start and end time. In the start and end time range, the workflow is run at regular intervals; not in the start and end time range, no more regular workflow instances are generated.
+- Add a timing that is executed once every day at 5 AM, as shown in the following figure:
+ <p align="center">
+ <img src="/img/timer-en.png" width="80%" />
+ </p>
+- Failure strategy, notification strategy, process priority, worker group, notification group, recipient, and CC are the same as [workflow running parameters](#runParamers).
+- Click the "Create" button to create the timing successfully. At this time, the timing status is "**Offline**" and the timing needs to be **Online** to take effect.
+- Timing online: Click the "timing management" button <img src="/img/timeManagement.png" width="35"/>, enter the timing management page, click the "online" button, the timing status will change to "online", as shown in the below figure, the workflow takes effect regularly.
+ <p align="center">
+ <img src="/img/time-manage-list-en.png" width="80%" />
+ </p>
+
+#### 2.3.5 Import workflow
+
+Click Project Management -> Workflow -> Workflow Definition to enter the workflow definition page, click the "Import Workflow" button to import the local workflow file, the workflow definition list displays the imported workflow, and the status is offline.
+
+#### 2.4 Workflow instance
+
+#### 2.4.1 View workflow instance
+
+- Click Project Management -> Workflow -> Workflow Instance to enter the Workflow Instance page, as shown in the figure below:
+ <p align="center">
+ <img src="/img/instance-list-en.png" width="80%" />
+ </p>
+- Click the workflow name to enter the DAG view page to view the task execution status, as shown in the figure below.
+ <p align="center">
+ <img src="/img/instance-runs-en.png" width="80%" />
+ </p>
+
+#### 2.4.2 View task log
+
+- Enter the workflow instance page, click the workflow name, enter the DAG view page, double-click the task node, as shown in the following figure:
+ <p align="center">
+ <img src="/img/instanceViewLog-en.png" width="80%" />
+ </p>
+- Click "View Log", a log pop-up box will pop up, as shown in the figure below, the task log can also be viewed on the task instance page, refer to [Task View Log](#taskLog)。
+ <p align="center">
+ <img src="/img/task-log-en.png" width="80%" />
+ </p>
+
+#### 2.4.3 View task history
+
+- Click Project Management -> Workflow -> Workflow Instance to enter the workflow instance page, and click the workflow name to enter the workflow DAG page;
+- Double-click the task node, as shown in the figure below, click "View History" to jump to the task instance page, and display a list of task instances running by the workflow instance
+ <p align="center">
+ <img src="/img/task_history_en.png" width="80%" />
+ </p>
+
+#### 2.4.4 View operating parameters
+
+- Click Project Management -> Workflow -> Workflow Instance to enter the workflow instance page, and click the workflow name to enter the workflow DAG page;
+- Click the icon in the upper left corner <img src="/img/run_params_button.png" width="35"/>,View the startup parameters of the workflow instance; click the icon <img src="/img/global_param.png" width="35"/>,View the global and local parameters of the workflow instance, as shown in the following figure:
+ <p align="center">
+ <img src="/img/run_params_en.png" width="80%" />
+ </p>
+
+#### 2.4.4 Workflow instance operation function
+
+Click Project Management -> Workflow -> Workflow Instance to enter the Workflow Instance page, as shown in the figure below:
+
+ <p align="center">
+ <img src="/img/instance-list-en.png" width="80%" />
+ </p>
+
+- **Edit:** Only terminated processes can be edited. Click the "Edit" button or the name of the workflow instance to enter the DAG edit page. After edit, click the "Save" button to pop up the Save DAG pop-up box, as shown in the figure below. In the pop-up box, check "Whether to update to workflow definition" and save After that, the workflow definition will be updated; if it is not checked, the workflow definition will not be updated.
+ <p align="center">
+ <img src="/img/editDag-en.png" width="80%" />
+ </p>
+- **Rerun:** Re-execute the terminated process.
+- **Recovery failed:** For failed processes, you can perform recovery operations, starting from the failed node.
+- **Stop:** To **stop** the running process, the background will first `kill`worker process, and then execute `kill -9` operation
+- **Pause:** Perform a **pause** operation on the running process, the system status will change to **waiting for execution**, it will wait for the end of the task being executed, and pause the next task to be executed.
+- **Resume pause:** To resume the paused process, start running directly from the **paused node**
+- **Delete:** Delete the workflow instance and the task instance under the workflow instance
+- **Gantt chart:** The vertical axis of the Gantt chart is the topological sorting of task instances under a certain workflow instance, and the horizontal axis is the running time of the task instances, as shown in the figure:
+ <p align="center">
+ <img src="/img/gantt-en.png" width="80%" />
+ </p>
+
+#### 2.5 Task instance
+
+- Click Project Management -> Workflow -> Task Instance to enter the task instance page, as shown in the figure below, click the name of the workflow instance, you can jump to the workflow instance DAG chart to view the task status.
+ <p align="center">
+ <img src="/img/task-list-en.png" width="80%" />
+ </p>
+
+- <span id=taskLog>View log:</span>Click the "view log" button in the operation column to view the log of task execution.
+ <p align="center">
+ <img src="/img/task-log2-en.png" width="80%" />
+ </p>
+
+### 3. Resource Center
+
+#### 3.1 hdfs resource configuration
+
+- Upload resource files and udf functions, all uploaded files and resources will be stored on hdfs, so the following configuration items are required:
+
+```
+
+conf/common/common.properties
+ # Users who have permission to create directories under the HDFS root path
+ hdfs.root.user=hdfs
+ # data base dir, resource file will store to this hadoop hdfs path, self configuration, please make sure the directory exists on hdfs and have read write permissions。"/escheduler" is recommended
+ data.store2hdfs.basepath=/dolphinscheduler
+ # resource upload startup type : HDFS,S3,NONE
+ res.upload.startup.type=HDFS
+ # whether kerberos starts
+ hadoop.security.authentication.startup.state=false
+ # java.security.krb5.conf path
+ java.security.krb5.conf.path=/opt/krb5.conf
+ # loginUserFromKeytab user
+ login.user.keytab.username=hdfs-mycluster@ESZ.COM
+ # loginUserFromKeytab path
+ login.user.keytab.path=/opt/hdfs.headless.keytab
+
+conf/common/hadoop.properties
+ # ha or single namenode,If namenode ha needs to copy core-site.xml and hdfs-site.xml
+ # to the conf directory,support s3,for example : s3a://dolphinscheduler
+ fs.defaultFS=hdfs://mycluster:8020
+ #resourcemanager ha note this need ips , this empty if single
+ yarn.resourcemanager.ha.rm.ids=192.168.xx.xx,192.168.xx.xx
+ # If it is a single resourcemanager, you only need to configure one host name. If it is resourcemanager HA, the default configuration is fine
+ yarn.application.status.address=http://xxxx:8088/ws/v1/cluster/apps/%s
+
+```
+
+- Only one address needs to be configured for yarn.resourcemanager.ha.rm.ids and yarn.application.status.address, and the other address is empty.
+- You need to copy core-site.xml and hdfs-site.xml from the conf directory of the Hadoop cluster to the conf directory of the dolphinscheduler project, and restart the api-server service.
+
+#### 3.2 File management
+
+> It is the management of various resource files, including creating basic txt/log/sh/conf/py/java and other files, uploading jar packages and other types of files, and can do edit, rename, download, delete and other operations.
+
+ <p align="center">
+ <img src="/img/file-manage-en.png" width="80%" />
+ </p>
+
+- Create a file
+ > The file format supports the following types: txt, log, sh, conf, cfg, py, java, sql, xml, hql, properties
+
+<p align="center">
+ <img src="/img/file_create_en.png" width="80%" />
+ </p>
+
+- upload files
+
+> Upload file: Click the "Upload File" button to upload, drag the file to the upload area, the file name will be automatically completed with the uploaded file name
+
+<p align="center">
+ <img src="/img/file-upload-en.png" width="80%" />
+ </p>
+
+- File View
+
+> For the file types that can be viewed, click the file name to view the file details
+
+<p align="center">
+ <img src="/img/file_detail_en.png" width="80%" />
+ </p>
+
+- download file
+
+> Click the "Download" button in the file list to download the file or click the "Download" button in the upper right corner of the file details to download the file
+
+- File rename
+
+<p align="center">
+ <img src="/img/file_rename_en.png" width="80%" />
+ </p>
+
+- delete
+ > File list -> Click the "Delete" button to delete the specified file
+
+#### 3.3 UDF management
+
+#### 3.3.1 Resource management
+
+> The resource management and file management functions are similar. The difference is that the resource management is the uploaded UDF function, and the file management uploads the user program, script and configuration file.
+> Operation function: rename, download, delete.
+
+- Upload udf resources
+ > Same as uploading files.
+
+#### 3.3.2 Function management
+
+- Create UDF function
+ > Click "Create UDF Function", enter the udf function parameters, select the udf resource, and click "Submit" to create the udf function.
+
+> Currently only supports temporary UDF functions of HIVE
+
+- UDF function name: the name when the UDF function is entered
+- Package name Class name: Enter the full path of the UDF function
+- UDF resource: Set the resource file corresponding to the created UDF
+
+<p align="center">
+ <img src="/img/udf_edit_en.png" width="80%" />
+ </p>
+
+### 4. Create data source
+
+> Data source center supports MySQL, POSTGRESQL, HIVE/IMPALA, SPARK, CLICKHOUSE, ORACLE, SQLSERVER and other data sources
+
+#### 4.1 Create/Edit MySQL data source
+
+- Click "Data Source Center -> Create Data Source" to create different types of data sources according to requirements.
+
+- Data source: select MYSQL
+- Data source name: enter the name of the data source
+- Description: Enter a description of the data source
+- IP hostname: enter the IP to connect to MySQL
+- Port: Enter the port to connect to MySQL
+- Username: Set the username for connecting to MySQL
+- Password: Set the password for connecting to MySQL
+- Database name: Enter the name of the database connected to MySQL
+- Jdbc connection parameters: parameter settings for MySQL connection, filled in in JSON form
+
+<p align="center">
+ <img src="/img/mysql-en.png" width="80%" />
+ </p>
+
+> Click "Test Connection" to test whether the data source can be successfully connected.
+
+#### 4.2 Create/Edit POSTGRESQL data source
+
+- Data source: select POSTGRESQL
+- Data source name: enter the name of the data source
+- Description: Enter a description of the data source
+- IP/Host Name: Enter the IP to connect to POSTGRESQL
+- Port: Enter the port to connect to POSTGRESQL
+- Username: Set the username for connecting to POSTGRESQL
+- Password: Set the password for connecting to POSTGRESQL
+- Database name: Enter the name of the database connected to POSTGRESQL
+- Jdbc connection parameters: parameter settings for POSTGRESQL connection, filled in in JSON form
+
+<p align="center">
+ <img src="/img/postgresql-en.png" width="80%" />
+ </p>
+
+#### 4.3 Create/Edit HIVE data source
+
+1.Use HiveServer2 to connect
+
+ <p align="center">
+ <img src="/img/hive-en.png" width="80%" />
+ </p>
+
+- Data source: select HIVE
+- Data source name: enter the name of the data source
+- Description: Enter a description of the data source
+- IP/Host Name: Enter the IP connected to HIVE
+- Port: Enter the port connected to HIVE
+- Username: Set the username for connecting to HIVE
+- Password: Set the password for connecting to HIVE
+- Database name: Enter the name of the database connected to HIVE
+- Jdbc connection parameters: parameter settings for HIVE connection, filled in in JSON form
+
+ 2.Use HiveServer2 HA Zookeeper to connect
+
+ <p align="center">
+ <img src="/img/hive1-en.png" width="80%" />
+ </p>
+
+Note: If you enable **kerberos**, you need to fill in **Principal**
+
+<p align="center">
+ <img src="/img/hive-en.png" width="80%" />
+ </p>
+
+#### 4.4 Create/Edit Spark data source
+
+<p align="center">
+ <img src="/img/spark-en.png" width="80%" />
+ </p>
+
+- Data source: select Spark
+- Data source name: enter the name of the data source
+- Description: Enter a description of the data source
+- IP/Hostname: Enter the IP connected to Spark
+- Port: Enter the port connected to Spark
+- Username: Set the username for connecting to Spark
+- Password: Set the password for connecting to Spark
+- Database name: Enter the name of the database connected to Spark
+- Jdbc connection parameters: parameter settings for Spark connection, filled in in JSON form
+
+### 5. Security Center (Permission System)
+
+ * Only the administrator account in the security center has the authority to operate. It has functions such as queue management, tenant management, user management, alarm group management, worker group management, token management, etc. In the user management module, resources, data sources, projects, etc. Authorization
+ * Administrator login, default user name and password: admin/dolphinscheduler123
+
+#### 5.1 Create queue
+
+- Queue is used when the "queue" parameter is needed to execute programs such as spark and mapreduce.
+- The administrator enters the Security Center->Queue Management page and clicks the "Create Queue" button to create a queue.
+<p align="center">
+ <img src="/img/create-queue-en.png" width="80%" />
+ </p>
+
+#### 5.2 Add tenant
+
+- The tenant corresponds to the Linux user, which is used by the worker to submit the job. If Linux does not have this user, the worker will create this user when executing the script.
+- Tenant Code: **Tenant Code is the only user on Linux and cannot be repeated**
+- The administrator enters the Security Center->Tenant Management page and clicks the "Create Tenant" button to create a tenant.
+
+ <p align="center">
+ <img src="/img/addtenant-en.png" width="80%" />
+ </p>
+
+#### 5.3 Create normal user
+
+- Users are divided into **administrator users** and **normal users**
+
+ - The administrator has authorization and user management authority, but does not have the authority to create project and workflow definition operations.
+ - Ordinary users can create projects and create, edit, and execute workflow definitions.
+ - Note: If the user switches tenants, all resources under the tenant where the user belongs will be copied to the new tenant that is switched.
+
+- The administrator enters the Security Center -> User Management page and clicks the "Create User" button to create a user.
+<p align="center">
+ <img src="/img/user-en.png" width="80%" />
+ </p>
+
+> **Edit user information**
+
+- The administrator enters the Security Center->User Management page and clicks the "Edit" button to edit user information.
+- After an ordinary user logs in, click the user information in the user name drop-down box to enter the user information page, and click the "Edit" button to edit the user information.
+
+> **Modify user password**
+
+- The administrator enters the Security Center->User Management page and clicks the "Edit" button. When editing user information, enter the new password to modify the user password.
+- After a normal user logs in, click the user information in the user name drop-down box to enter the password modification page, enter the password and confirm the password and click the "Edit" button, then the password modification is successful.
+
+#### 5.4 Create alarm group
+
+- The alarm group is a parameter set at startup. After the process ends, the status of the process and other information will be sent to the alarm group in the form of email.
+
+* The administrator enters the Security Center -> Alarm Group Management page and clicks the "Create Alarm Group" button to create an alarm group.
+
+ <p align="center">
+ <img src="/img/mail-en.png" width="80%" />
+
+#### 5.5 Token management
+
+> Since the back-end interface has login check, token management provides a way to perform various operations on the system by calling the interface.
+
+- The administrator enters the Security Center -> Token Management page, clicks the "Create Token" button, selects the expiration time and user, clicks the "Generate Token" button, and clicks the "Submit" button, then the selected user's token is created successfully.
+
+ <p align="center">
+ <img src="/img/create-token-en.png" width="80%" />
+ </p>
+
+ - After an ordinary user logs in, click the user information in the user name drop-down box, enter the token management page, select the expiration time, click the "generate token" button, and click the "submit" button, then the user creates a token successfully.
+ - Call example:
+
+```
+Token call example
+ /**
+ * test token
+ */
+ public void doPOSTParam()throws Exception{
+ // create HttpClient
+ CloseableHttpClient httpclient = HttpClients.createDefault();
+
+ // create http post request
+ HttpPost httpPost = new HttpPost("http://127.0.0.1:12345/escheduler/projects/create");
+ httpPost.setHeader("token", "123");
+ // set parameters
+ List<NameValuePair> parameters = new ArrayList<NameValuePair>();
+ parameters.add(new BasicNameValuePair("projectName", "qzw"));
+ parameters.add(new BasicNameValuePair("desc", "qzw"));
+ UrlEncodedFormEntity formEntity = new UrlEncodedFormEntity(parameters);
+ httpPost.setEntity(formEntity);
+ CloseableHttpResponse response = null;
+ try {
+ // execute
+ response = httpclient.execute(httpPost);
+ // response status code 200
+ if (response.getStatusLine().getStatusCode() == 200) {
+ String content = EntityUtils.toString(response.getEntity(), "UTF-8");
+ System.out.println(content);
+ }
+ } finally {
+ if (response != null) {
+ response.close();
+ }
+ httpclient.close();
+ }
+ }
+```
+
+#### 5.6 Granted permission
+
+ * Granted permissions include project permissions, resource permissions, data source permissions, UDF function permissions.
+ * The administrator can authorize the projects, resources, data sources and UDF functions not created by ordinary users. Because the authorization methods for projects, resources, data sources and UDF functions are the same, we take project authorization as an example.
+ * Note: For projects created by users themselves, the user has all permissions. The project list and the selected project list will not be displayed.
+
+- The administrator enters the Security Center -> User Management page and clicks the "Authorize" button of the user who needs to be authorized, as shown in the figure below:
+ <p align="center">
+ <img src="/img/auth-en.png" width="80%" />
+</p>
+
+- Select the project to authorize the project.
+
+<p align="center">
+ <img src="/img/authproject-en.png" width="80%" />
+ </p>
+
+- Resources, data sources, and UDF function authorization are the same as project authorization.
+
+### 6. monitoring Center
+
+#### 6.1 Service management
+
+- Service management is mainly to monitor and display the health status and basic information of each service in the system
+
+#### 6.1.1 master monitoring
+
+- Mainly related to master information.
+<p align="center">
+ <img src="/img/master-jk-en.png" width="80%" />
+ </p>
+
+#### 6.1.2 worker monitoring
+
+- Mainly related to worker information.
+
+<p align="center">
+ <img src="/img/worker-jk-en.png" width="80%" />
+ </p>
+
+#### 6.1.3 Zookeeper monitoring
+
+- Mainly related configuration information of each worker and master in zookpeeper.
+
+<p align="center">
+ <img src="/img/zookeeper-monitor-en.png" width="80%" />
+ </p>
+
+#### 6.1.4 DB monitoring
+
+- Mainly the health of the DB
+
+<p align="center">
+ <img src="/img/mysql-jk-en.png" width="80%" />
+ </p>
+
+#### 6.2 Statistics management
+
+<p align="center">
+ <img src="/img/statistics-en.png" width="80%" />
+ </p>
+
+- Number of commands to be executed: statistics on the t_ds_command table
+- The number of failed commands: statistics on the t_ds_error_command table
+- Number of tasks to run: Count the data of task_queue in Zookeeper
+- Number of tasks to be killed: Count the data of task_kill in Zookeeper
+
+### 7. <span id=TaskParamers>Task node type and parameter settings</span>
+
+#### 7.1 Shell node
+
+> Shell node, when the worker is executed, a temporary shell script is generated, and the linux user with the same name as the tenant executes the script.
+
+- Click Project Management-Project Name-Workflow Definition, and click the "Create Workflow" button to enter the DAG editing page.
+- Drag <img src="/img/shell.png" width="35"/> from the toolbar to the drawing board, as shown in the figure below:
+
+ <p align="center">
+ <img src="/img/shell-en.png" width="80%" />
+ </p>
+
+- Node name: The node name in a workflow definition is unique.
+- Run flag: Identifies whether this node can be scheduled normally, if it does not need to be executed, you can turn on the prohibition switch.
+- Descriptive information: describe the function of the node.
+- Task priority: When the number of worker threads is insufficient, they are executed in order from high to low, and when the priority is the same, they are executed according to the first-in first-out principle.
+- Worker grouping: Tasks are assigned to the machines of the worker group to execute. If Default is selected, a worker machine will be randomly selected for execution.
+- Number of failed retry attempts: The number of times the task failed to be resubmitted. It supports drop-down and hand-filling.
+- Failed retry interval: The time interval for resubmitting the task after a failed task. It supports drop-down and hand-filling.
+- Timeout alarm: Check the timeout alarm and timeout failure. When the task exceeds the "timeout period", an alarm email will be sent and the task execution will fail.
+- Script: SHELL program developed by users.
+- Resource: Refers to the list of resource files that need to be called in the script, and the files uploaded or created by the resource center-file management.
+- User-defined parameters: It is a user-defined parameter that is part of SHELL, which will replace the content with \${variable} in the script.
+
+#### 7.2 Sub-process node
+
+- The sub-process node is to execute a certain external workflow definition as a task node.
+ > Drag the  task node in the toolbar to the drawing board, as shown in the following figure:
+
+<p align="center">
+ <img src="/img/sub-process-en.png" width="80%" />
+ </p>
+
+- Node name: The node name in a workflow definition is unique
+- Run flag: identify whether this node can be scheduled normally
+- Descriptive information: describe the function of the node
+- Timeout alarm: Check the timeout alarm and timeout failure. When the task exceeds the "timeout period", an alarm email will be sent and the task execution will fail.
+- Sub-node: It is the workflow definition of the selected sub-process. Enter the sub-node in the upper right corner to jump to the workflow definition of the selected sub-process
+
+#### 7.3 DEPENDENT node
+
+- Dependent nodes are **dependency check nodes**. For example, process A depends on the successful execution of process B yesterday, and the dependent node will check whether process B has a successful execution yesterday.
+
+> Drag the  task node in the toolbar to the drawing board, as shown in the following figure:
+
+<p align="center">
+ <img src="/img/dependent-nodes-en.png" width="80%" />
+ </p>
+
+> The dependent node provides a logical judgment function, such as checking whether the B process was successful yesterday, or whether the C process was executed successfully.
+
+ <p align="center">
+ <img src="/img/depend-node-en.png" width="80%" />
+ </p>
+
+> For example, process A is a weekly report task, processes B and C are daily tasks, and task A requires tasks B and C to be successfully executed every day of the last week, as shown in the figure:
+
+ <p align="center">
+ <img src="/img/depend-node1-en.png" width="80%" />
+ </p>
+
+> If the weekly report A also needs to be executed successfully last Tuesday:
+
+ <p align="center">
+ <img src="/img/depend-node3-en.png" width="80%" />
+ </p>
+
+#### 7.4 Stored procedure node
+
+- According to the selected data source, execute the stored procedure.
+ > Drag in the toolbarThe task node to the drawing board, as shown in the following figure:
+
+<p align="center">
+ <img src="/img/procedure-en.png" width="80%" />
+ </p>
+
+- Data source: The data source type of the stored procedure supports MySQL and POSTGRESQL, select the corresponding data source
+- Method: is the method name of the stored procedure
+- Custom parameters: The custom parameter types of the stored procedure support IN and OUT, and the data types support nine data types: VARCHAR, INTEGER, LONG, FLOAT, DOUBLE, DATE, TIME, TIMESTAMP, and BOOLEAN
+
+#### 7.5 SQL node
+
+- Drag in the toolbarTask node into the drawing board
+- Non-query SQL function: edit non-query SQL task information, select non-query for sql type, as shown in the figure below:
+ <p align="center">
+ <img src="/img/sql-en.png" width="80%" />
+</p>
+
+- Query SQL function: Edit and query SQL task information, sql type selection query, select form or attachment to send mail to the specified recipient, as shown in the figure below.
+
+<p align="center">
+ <img src="/img/sql-node-en.png" width="80%" />
+ </p>
+
+- Data source: select the corresponding data source
+- sql type: supports query and non-query. The query is a select type query, which is returned with a result set. You can specify three templates for email notification as form, attachment or form attachment. Non-queries are returned without a result set, and are for three types of operations: update, delete, and insert.
+- sql parameter: the input parameter format is key1=value1;key2=value2...
+- sql statement: SQL statement
+- UDF function: For data sources of type HIVE, you can refer to UDF functions created in the resource center. UDF functions are not supported for other types of data sources.
+- Custom parameters: SQL task type, and stored procedure is a custom parameter order to set values for the method. The custom parameter type and data type are the same as the stored procedure task type. The difference is that the SQL task type custom parameter will replace the \${variable} in the SQL statement.
+- Pre-sql: Pre-sql is executed before the sql statement.
+- Post-sql: Post-sql is executed after the sql statement.
+
+#### 7.6 SPARK node
+
+- Through the SPARK node, you can directly execute the SPARK program. For the spark node, the worker will use the `spark-submit` method to submit tasks
+
+> Drag in the toolbarThe task node to the drawing board, as shown in the following figure:
+
+<p align="center">
+ <img src="/img/spark-submit-en.png" width="80%" />
+ </p>
+
+- Program type: supports JAVA, Scala and Python three languages
+- The class of the main function: is the full path of the Spark program’s entry Main Class
+- Main jar package: Spark jar package
+- Deployment mode: support three modes of yarn-cluster, yarn-client and local
+- Driver core number: You can set the number of Driver cores and the number of memory
+- Number of Executors: You can set the number of Executors, the number of Executor memory, and the number of Executor cores
+- Command line parameters: Set the input parameters of the Spark program and support the substitution of custom parameter variables.
+- Other parameters: support --jars, --files, --archives, --conf format
+- Resource: If the resource file is referenced in other parameters, you need to select and specify in the resource
+- User-defined parameter: It is a user-defined parameter of the MR part, which will replace the content with \${variable} in the script
+
+Note: JAVA and Scala are only used for identification, there is no difference, if it is Spark developed by Python, there is no main function class, and the others are the same
Review comment:
```suggestion
Note: JAVA and Scala are only used for identification, there is no difference, if iSpark is developed by Python, there is no main function class, and the others are the same
```
##########
File path: docs/en-us/1.3.2/user_doc/system-manual.md
##########
@@ -0,0 +1,886 @@
+# System User Manual
+
+## Get started quickly
+
+> Please refer to [Quick Start](quick-start.html)
+
+## Operation guide
+
+### 1. Home
+
+The home page contains task status statistics, process status statistics, and workflow definition statistics for all projects of the user.
+
+<p align="center">
+<img src="/img/home_en.png" width="80%" />
+</p>
+
+### 2. Project management
+
+#### 2.1 Create project
+
+- Click "Project Management" to enter the project management page, click the "Create Project" button, enter the project name, project description, and click "Submit" to create a new project.
+
+ <p align="center">
+ <img src="/img/create_project_en1.png" width="80%" />
+ </p>
+
+#### 2.2 Project home
+
+- Click the project name link on the project management page to enter the project home page, as shown in the figure below, the project home page contains the task status statistics, process status statistics, and workflow definition statistics of the project.
+ <p align="center">
+ <img src="/img/project_home_en.png" width="80%" />
+ </p>
+
+- Task status statistics: within the specified time range, count the number of task instances as successful submission, running, ready to pause, pause, ready to stop, stop, failure, success, fault tolerance, kill, and waiting threads
+- Process status statistics: within the specified time range, count the number of the status of the workflow instance as submission success, running, ready to pause, pause, ready to stop, stop, failure, success, fault tolerance, kill, and waiting threads
+- Workflow definition statistics: Count the workflow definitions created by this user and the workflow definitions granted to this user by the administrator
+
+#### 2.3 Workflow definition
+
+#### <span id=creatDag>2.3.1 Create workflow definition</span>
+
+- Click Project Management -> Workflow -> Workflow Definition to enter the workflow definition page, and click the "Create Workflow" button to enter the **workflow DAG edit** page, as shown in the following figure:
+ <p align="center">
+ <img src="/img/dag5.png" width="80%" />
+ </p>
+- Drag in the toolbar <img src="/img/shell.png" width="35"/> Add a Shell task to the drawing board, as shown in the figure below:
+ <p align="center">
+ <img src="/img/shell-en.png" width="80%" />
+ </p>
+- **Add parameter settings for this shell task:**
+
+1. Fill in the "Node Name", "Description", and "Script" fields;
+2. Check “Normal” for “Run Flag”. If “Prohibit Execution” is checked, the task will not be executed when the workflow runs;
+3. Select "Task Priority": When the number of worker threads is insufficient, high-level tasks will be executed first in the execution queue, and tasks with the same priority will be executed in the order of first in, first out;
+4. Timeout alarm (optional): Check the timeout alarm, timeout failure, and fill in the "timeout period". When the task execution time exceeds **timeout period**, an alert email will be sent and the task timeout fails;
+5. Resources (optional). Resource files are files created or uploaded on the Resource Center -> File Management page. For example, the file name is `test.sh`, and the command to call the resource in the script is `sh test.sh`;
+6. Custom parameters (optional), refer to [Custom Parameters](#UserDefinedParameters);
+7. Click the "Confirm Add" button to save the task settings.
+
+- **Increase the order of task execution:** Click the icon in the upper right corner <img src="/img/line.png" width="35"/> to connect the task; as shown in the figure below, task 2 and task 3 are executed in parallel, When task 1 finished execute, tasks 2 and 3 will be executed simultaneously.
+
+ <p align="center">
+ <img src="/img/dag6.png" width="80%" />
+ </p>
+
+- **Delete dependencies:** Click the "arrow" icon in the upper right corner <img src="/img/arrow.png" width="35"/>, select the connection line, and click the "Delete" icon in the upper right corner <img src= "/img/delete.png" width="35"/>, delete dependencies between tasks.
+ <p align="center">
+ <img src="/img/dag7.png" width="80%" />
+ </p>
+
+- **Save workflow definition:** Click the "Save" button, and the "Set DAG chart name" pop-up box will pop up, as shown in the figure below. Enter the workflow definition name, workflow definition description, and set global parameters (optional, refer to [ Custom parameters](#UserDefinedParameters)), click the "Add" button, and the workflow definition is created successfully.
+ <p align="center">
+ <img src="/img/dag8.png" width="80%" />
+ </p>
+> For other types of tasks, please refer to [Task Node Type and Parameter Settings](#TaskParamers).
+
+#### 2.3.2 Workflow definition operation function
+
+Click Project Management -> Workflow -> Workflow Definition to enter the workflow definition page, as shown below:
+
+<p align="center">
+<img src="/img/work_list_en.png" width="80%" />
+</p>
+The operation functions of the workflow definition list are as follows:
+
+- **Edit:** Only "offline" workflow definitions can be edited. Workflow DAG editing is the same as [Create Workflow Definition](#creatDag).
+- **Online:** When the workflow status is "Offline", used to online workflow. Only the workflow in the "Online" state can run, but cannot be edited.
+- **Offline:** When the workflow status is "Online", used to offline workflow. Only the workflow in the "Offline" state can be edited, but not run.
+- **Run:** Only workflow in the online state can run. See [2.3.3 Run Workflow](#runWorkflow) for the operation steps
+- **Timing:** Timing can only be set in online workflows, and the system automatically schedules the workflow to run on a regular basis. The status after creating a timing is "offline", and the timing must be online on the timing management page to take effect. See [2.3.4 Workflow Timing](#creatTiming) for timing operation steps.
+- **Timing Management:** The timing management page can be edited, online/offline, and deleted.
+- **Delete:** Delete the workflow definition.
+- **Download:** Download workflow definition to local.
+- **Tree Diagram:** Display the task node type and task status in a tree structure, as shown in the figure below:
+ <p align="center">
+ <img src="/img/tree_en.png" width="80%" />
+ </p>
+
+#### <span id=runWorkflow>2.3.3 Run the workflow</span>
+
+- Click Project Management -> Workflow -> Workflow Definition to enter the workflow definition page, as shown in the figure below, click the "Go Online" button <img src="/img/online.png" width="35"/>,Go online workflow.
+ <p align="center">
+ <img src="/img/work_list_en.png" width="80%" />
+ </p>
+
+- Click the "Run" button to pop up the startup parameter setting pop-up box, as shown in the figure below, set the startup parameters, click the "Run" button in the pop-up box, the workflow starts running, and the workflow instance page generates a workflow instance.
+ <p align="center">
+ <img src="/img/run_work_en.png" width="80%" />
+ </p>
+ <span id=runParamers>Description of workflow operating parameters:</span>
+
+ * Failure strategy: When a task node fails to execute, other parallel task nodes need to execute the strategy. "Continue" means: after a certain task fails, other task nodes execute normally; "End" means: terminate all tasks being executed, and terminate the entire process.
+ * Notification strategy: When the process is over, the process execution information notification email is sent according to the process status, including any status is not sent, successful sent, failed sent, successful or failed sent.
+ * Process priority: The priority of process operation, divided into five levels: highest (HIGHEST), high (HIGH), medium (MEDIUM), low (LOW), and lowest (LOWEST). When the number of master threads is insufficient, high-level processes will be executed first in the execution queue, and processes with the same priority will be executed in a first-in first-out order.
+ * Worker group: The process can only be executed in the specified worker machine group. The default is Default, which can be executed on any worker.
+ * Notification group: select notification strategy||timeout alarm||when fault tolerance occurs, process information or email will be sent to all members in the notification group.
+ * Recipient: Select notification policy||Timeout alarm||When fault tolerance occurs, process information or alarm email will be sent to the recipient list.
+ * Cc: Select the notification strategy||Timeout alarm||When fault tolerance occurs, the process information or warning email will be copied to the CC list.
+ * Complement: Two modes including serial complement and parallel complement. Serial complement: within the specified time range, the complement is executed sequentially from the start date to the end date, and only one process instance is generated; parallel complement: within the specified time range, multiple days are complemented at the same time to generate N process instances.
+ * For example, you need to fill in the data from May 1 to May 10.
+
+ <p align="center">
+ <img src="/img/complement_en1.png" width="80%" />
+ </p>
+
+ > Serial mode: The complement is executed sequentially from May 1 to May 10, and a process instance is generated on the process instance page;
+
+ > Parallel mode: The tasks from May 1 to may 10 are executed simultaneously, and 10 process instances are generated on the process instance page.
+
+#### <span id=creatTiming>2.3.4 Workflow timing</span>
+
+- Create timing: Click Project Management->Workflow->Workflow Definition, enter the workflow definition page, go online the workflow, click the "timing" button <img src="/img/timing.png" width="35"/> ,The timing parameter setting dialog box pops up, as shown in the figure below:
+ <p align="center">
+ <img src="/img/time_schedule_en.png" width="80%" />
+ </p>
+- Choose the start and end time. In the start and end time range, the workflow is run at regular intervals; not in the start and end time range, no more regular workflow instances are generated.
+- Add a timing that is executed once every day at 5 AM, as shown in the following figure:
+ <p align="center">
+ <img src="/img/timer-en.png" width="80%" />
+ </p>
+- Failure strategy, notification strategy, process priority, worker group, notification group, recipient, and CC are the same as [workflow running parameters](#runParamers).
+- Click the "Create" button to create the timing successfully. At this time, the timing status is "**Offline**" and the timing needs to be **Online** to take effect.
+- Timing online: Click the "timing management" button <img src="/img/timeManagement.png" width="35"/>, enter the timing management page, click the "online" button, the timing status will change to "online", as shown in the below figure, the workflow takes effect regularly.
+ <p align="center">
+ <img src="/img/time-manage-list-en.png" width="80%" />
+ </p>
+
+#### 2.3.5 Import workflow
+
+Click Project Management -> Workflow -> Workflow Definition to enter the workflow definition page, click the "Import Workflow" button to import the local workflow file, the workflow definition list displays the imported workflow, and the status is offline.
+
+#### 2.4 Workflow instance
+
+#### 2.4.1 View workflow instance
+
+- Click Project Management -> Workflow -> Workflow Instance to enter the Workflow Instance page, as shown in the figure below:
+ <p align="center">
+ <img src="/img/instance-list-en.png" width="80%" />
+ </p>
+- Click the workflow name to enter the DAG view page to view the task execution status, as shown in the figure below.
+ <p align="center">
+ <img src="/img/instance-runs-en.png" width="80%" />
+ </p>
+
+#### 2.4.2 View task log
+
+- Enter the workflow instance page, click the workflow name, enter the DAG view page, double-click the task node, as shown in the following figure:
+ <p align="center">
+ <img src="/img/instanceViewLog-en.png" width="80%" />
+ </p>
+- Click "View Log", a log pop-up box will pop up, as shown in the figure below, the task log can also be viewed on the task instance page, refer to [Task View Log](#taskLog)。
+ <p align="center">
+ <img src="/img/task-log-en.png" width="80%" />
+ </p>
+
+#### 2.4.3 View task history
+
+- Click Project Management -> Workflow -> Workflow Instance to enter the workflow instance page, and click the workflow name to enter the workflow DAG page;
+- Double-click the task node, as shown in the figure below, click "View History" to jump to the task instance page, and display a list of task instances running by the workflow instance
+ <p align="center">
+ <img src="/img/task_history_en.png" width="80%" />
+ </p>
+
+#### 2.4.4 View operating parameters
+
+- Click Project Management -> Workflow -> Workflow Instance to enter the workflow instance page, and click the workflow name to enter the workflow DAG page;
+- Click the icon in the upper left corner <img src="/img/run_params_button.png" width="35"/>,View the startup parameters of the workflow instance; click the icon <img src="/img/global_param.png" width="35"/>,View the global and local parameters of the workflow instance, as shown in the following figure:
+ <p align="center">
+ <img src="/img/run_params_en.png" width="80%" />
+ </p>
+
+#### 2.4.4 Workflow instance operation function
+
+Click Project Management -> Workflow -> Workflow Instance to enter the Workflow Instance page, as shown in the figure below:
+
+ <p align="center">
+ <img src="/img/instance-list-en.png" width="80%" />
+ </p>
+
+- **Edit:** Only terminated processes can be edited. Click the "Edit" button or the name of the workflow instance to enter the DAG edit page. After edit, click the "Save" button to pop up the Save DAG pop-up box, as shown in the figure below. In the pop-up box, check "Whether to update to workflow definition" and save After that, the workflow definition will be updated; if it is not checked, the workflow definition will not be updated.
+ <p align="center">
+ <img src="/img/editDag-en.png" width="80%" />
+ </p>
+- **Rerun:** Re-execute the terminated process.
+- **Recovery failed:** For failed processes, you can perform recovery operations, starting from the failed node.
+- **Stop:** To **stop** the running process, the background will first `kill`worker process, and then execute `kill -9` operation
+- **Pause:** Perform a **pause** operation on the running process, the system status will change to **waiting for execution**, it will wait for the end of the task being executed, and pause the next task to be executed.
+- **Resume pause:** To resume the paused process, start running directly from the **paused node**
+- **Delete:** Delete the workflow instance and the task instance under the workflow instance
+- **Gantt chart:** The vertical axis of the Gantt chart is the topological sorting of task instances under a certain workflow instance, and the horizontal axis is the running time of the task instances, as shown in the figure:
+ <p align="center">
+ <img src="/img/gantt-en.png" width="80%" />
+ </p>
+
+#### 2.5 Task instance
+
+- Click Project Management -> Workflow -> Task Instance to enter the task instance page, as shown in the figure below, click the name of the workflow instance, you can jump to the workflow instance DAG chart to view the task status.
+ <p align="center">
+ <img src="/img/task-list-en.png" width="80%" />
+ </p>
+
+- <span id=taskLog>View log:</span>Click the "view log" button in the operation column to view the log of task execution.
+ <p align="center">
+ <img src="/img/task-log2-en.png" width="80%" />
+ </p>
+
+### 3. Resource Center
+
+#### 3.1 hdfs resource configuration
+
+- Upload resource files and udf functions, all uploaded files and resources will be stored on hdfs, so the following configuration items are required:
+
+```
+
+conf/common/common.properties
+ # Users who have permission to create directories under the HDFS root path
+ hdfs.root.user=hdfs
+ # data base dir, resource file will store to this hadoop hdfs path, self configuration, please make sure the directory exists on hdfs and have read write permissions。"/escheduler" is recommended
+ data.store2hdfs.basepath=/dolphinscheduler
+ # resource upload startup type : HDFS,S3,NONE
+ res.upload.startup.type=HDFS
+ # whether kerberos starts
+ hadoop.security.authentication.startup.state=false
+ # java.security.krb5.conf path
+ java.security.krb5.conf.path=/opt/krb5.conf
+ # loginUserFromKeytab user
+ login.user.keytab.username=hdfs-mycluster@ESZ.COM
+ # loginUserFromKeytab path
+ login.user.keytab.path=/opt/hdfs.headless.keytab
+
+conf/common/hadoop.properties
+ # ha or single namenode,If namenode ha needs to copy core-site.xml and hdfs-site.xml
+ # to the conf directory,support s3,for example : s3a://dolphinscheduler
+ fs.defaultFS=hdfs://mycluster:8020
+ #resourcemanager ha note this need ips , this empty if single
+ yarn.resourcemanager.ha.rm.ids=192.168.xx.xx,192.168.xx.xx
+ # If it is a single resourcemanager, you only need to configure one host name. If it is resourcemanager HA, the default configuration is fine
+ yarn.application.status.address=http://xxxx:8088/ws/v1/cluster/apps/%s
+
+```
+
+- Only one address needs to be configured for yarn.resourcemanager.ha.rm.ids and yarn.application.status.address, and the other address is empty.
+- You need to copy core-site.xml and hdfs-site.xml from the conf directory of the Hadoop cluster to the conf directory of the dolphinscheduler project, and restart the api-server service.
+
+#### 3.2 File management
+
+> It is the management of various resource files, including creating basic txt/log/sh/conf/py/java and other files, uploading jar packages and other types of files, and can do edit, rename, download, delete and other operations.
+
+ <p align="center">
+ <img src="/img/file-manage-en.png" width="80%" />
+ </p>
+
+- Create a file
+ > The file format supports the following types: txt, log, sh, conf, cfg, py, java, sql, xml, hql, properties
+
+<p align="center">
+ <img src="/img/file_create_en.png" width="80%" />
+ </p>
+
+- upload files
+
+> Upload file: Click the "Upload File" button to upload, drag the file to the upload area, the file name will be automatically completed with the uploaded file name
+
+<p align="center">
+ <img src="/img/file-upload-en.png" width="80%" />
+ </p>
+
+- File View
+
+> For the file types that can be viewed, click the file name to view the file details
+
+<p align="center">
+ <img src="/img/file_detail_en.png" width="80%" />
+ </p>
+
+- download file
+
+> Click the "Download" button in the file list to download the file or click the "Download" button in the upper right corner of the file details to download the file
+
+- File rename
+
+<p align="center">
+ <img src="/img/file_rename_en.png" width="80%" />
+ </p>
+
+- delete
+ > File list -> Click the "Delete" button to delete the specified file
+
+#### 3.3 UDF management
+
+#### 3.3.1 Resource management
+
+> The resource management and file management functions are similar. The difference is that the resource management is the uploaded UDF function, and the file management uploads the user program, script and configuration file.
+> Operation function: rename, download, delete.
+
+- Upload udf resources
+ > Same as uploading files.
+
+#### 3.3.2 Function management
+
+- Create UDF function
+ > Click "Create UDF Function", enter the udf function parameters, select the udf resource, and click "Submit" to create the udf function.
+
+> Currently only supports temporary UDF functions of HIVE
+
+- UDF function name: the name when the UDF function is entered
+- Package name Class name: Enter the full path of the UDF function
+- UDF resource: Set the resource file corresponding to the created UDF
+
+<p align="center">
+ <img src="/img/udf_edit_en.png" width="80%" />
+ </p>
+
+### 4. Create data source
+
+> Data source center supports MySQL, POSTGRESQL, HIVE/IMPALA, SPARK, CLICKHOUSE, ORACLE, SQLSERVER and other data sources
+
+#### 4.1 Create/Edit MySQL data source
+
+- Click "Data Source Center -> Create Data Source" to create different types of data sources according to requirements.
+
+- Data source: select MYSQL
+- Data source name: enter the name of the data source
+- Description: Enter a description of the data source
+- IP hostname: enter the IP to connect to MySQL
+- Port: Enter the port to connect to MySQL
+- Username: Set the username for connecting to MySQL
+- Password: Set the password for connecting to MySQL
+- Database name: Enter the name of the database connected to MySQL
+- Jdbc connection parameters: parameter settings for MySQL connection, filled in in JSON form
+
+<p align="center">
+ <img src="/img/mysql-en.png" width="80%" />
+ </p>
+
+> Click "Test Connection" to test whether the data source can be successfully connected.
+
+#### 4.2 Create/Edit POSTGRESQL data source
+
+- Data source: select POSTGRESQL
+- Data source name: enter the name of the data source
+- Description: Enter a description of the data source
+- IP/Host Name: Enter the IP to connect to POSTGRESQL
+- Port: Enter the port to connect to POSTGRESQL
+- Username: Set the username for connecting to POSTGRESQL
+- Password: Set the password for connecting to POSTGRESQL
+- Database name: Enter the name of the database connected to POSTGRESQL
+- Jdbc connection parameters: parameter settings for POSTGRESQL connection, filled in in JSON form
+
+<p align="center">
+ <img src="/img/postgresql-en.png" width="80%" />
+ </p>
+
+#### 4.3 Create/Edit HIVE data source
+
+1.Use HiveServer2 to connect
+
+ <p align="center">
+ <img src="/img/hive-en.png" width="80%" />
+ </p>
+
+- Data source: select HIVE
+- Data source name: enter the name of the data source
+- Description: Enter a description of the data source
+- IP/Host Name: Enter the IP connected to HIVE
+- Port: Enter the port connected to HIVE
+- Username: Set the username for connecting to HIVE
+- Password: Set the password for connecting to HIVE
+- Database name: Enter the name of the database connected to HIVE
+- Jdbc connection parameters: parameter settings for HIVE connection, filled in in JSON form
+
+ 2.Use HiveServer2 HA Zookeeper to connect
+
+ <p align="center">
+ <img src="/img/hive1-en.png" width="80%" />
+ </p>
+
+Note: If you enable **kerberos**, you need to fill in **Principal**
+
+<p align="center">
+ <img src="/img/hive-en.png" width="80%" />
+ </p>
+
+#### 4.4 Create/Edit Spark data source
+
+<p align="center">
+ <img src="/img/spark-en.png" width="80%" />
+ </p>
+
+- Data source: select Spark
+- Data source name: enter the name of the data source
+- Description: Enter a description of the data source
+- IP/Hostname: Enter the IP connected to Spark
+- Port: Enter the port connected to Spark
+- Username: Set the username for connecting to Spark
+- Password: Set the password for connecting to Spark
+- Database name: Enter the name of the database connected to Spark
+- Jdbc connection parameters: parameter settings for Spark connection, filled in in JSON form
+
+### 5. Security Center (Permission System)
+
+ * Only the administrator account in the security center has the authority to operate. It has functions such as queue management, tenant management, user management, alarm group management, worker group management, token management, etc. In the user management module, resources, data sources, projects, etc. Authorization
+ * Administrator login, default user name and password: admin/dolphinscheduler123
+
+#### 5.1 Create queue
+
+- Queue is used when the "queue" parameter is needed to execute programs such as spark and mapreduce.
+- The administrator enters the Security Center->Queue Management page and clicks the "Create Queue" button to create a queue.
+<p align="center">
+ <img src="/img/create-queue-en.png" width="80%" />
+ </p>
+
+#### 5.2 Add tenant
+
+- The tenant corresponds to the Linux user, which is used by the worker to submit the job. If Linux does not have this user, the worker will create this user when executing the script.
+- Tenant Code: **Tenant Code is the only user on Linux and cannot be repeated**
+- The administrator enters the Security Center->Tenant Management page and clicks the "Create Tenant" button to create a tenant.
+
+ <p align="center">
+ <img src="/img/addtenant-en.png" width="80%" />
+ </p>
+
+#### 5.3 Create normal user
+
+- Users are divided into **administrator users** and **normal users**
+
+ - The administrator has authorization and user management authority, but does not have the authority to create project and workflow definition operations.
+ - Ordinary users can create projects and create, edit, and execute workflow definitions.
+ - Note: If the user switches tenants, all resources under the tenant where the user belongs will be copied to the new tenant that is switched.
+
+- The administrator enters the Security Center -> User Management page and clicks the "Create User" button to create a user.
+<p align="center">
+ <img src="/img/user-en.png" width="80%" />
+ </p>
+
+> **Edit user information**
+
+- The administrator enters the Security Center->User Management page and clicks the "Edit" button to edit user information.
+- After an ordinary user logs in, click the user information in the user name drop-down box to enter the user information page, and click the "Edit" button to edit the user information.
+
+> **Modify user password**
+
+- The administrator enters the Security Center->User Management page and clicks the "Edit" button. When editing user information, enter the new password to modify the user password.
+- After a normal user logs in, click the user information in the user name drop-down box to enter the password modification page, enter the password and confirm the password and click the "Edit" button, then the password modification is successful.
+
+#### 5.4 Create alarm group
+
+- The alarm group is a parameter set at startup. After the process ends, the status of the process and other information will be sent to the alarm group in the form of email.
+
+* The administrator enters the Security Center -> Alarm Group Management page and clicks the "Create Alarm Group" button to create an alarm group.
+
+ <p align="center">
+ <img src="/img/mail-en.png" width="80%" />
+
+#### 5.5 Token management
+
+> Since the back-end interface has login check, token management provides a way to perform various operations on the system by calling the interface.
+
+- The administrator enters the Security Center -> Token Management page, clicks the "Create Token" button, selects the expiration time and user, clicks the "Generate Token" button, and clicks the "Submit" button, then the selected user's token is created successfully.
+
+ <p align="center">
+ <img src="/img/create-token-en.png" width="80%" />
+ </p>
+
+ - After an ordinary user logs in, click the user information in the user name drop-down box, enter the token management page, select the expiration time, click the "generate token" button, and click the "submit" button, then the user creates a token successfully.
+ - Call example:
+
+```
+Token call example
+ /**
+ * test token
+ */
+ public void doPOSTParam()throws Exception{
+ // create HttpClient
+ CloseableHttpClient httpclient = HttpClients.createDefault();
+
+ // create http post request
+ HttpPost httpPost = new HttpPost("http://127.0.0.1:12345/escheduler/projects/create");
+ httpPost.setHeader("token", "123");
+ // set parameters
+ List<NameValuePair> parameters = new ArrayList<NameValuePair>();
+ parameters.add(new BasicNameValuePair("projectName", "qzw"));
+ parameters.add(new BasicNameValuePair("desc", "qzw"));
+ UrlEncodedFormEntity formEntity = new UrlEncodedFormEntity(parameters);
+ httpPost.setEntity(formEntity);
+ CloseableHttpResponse response = null;
+ try {
+ // execute
+ response = httpclient.execute(httpPost);
+ // response status code 200
+ if (response.getStatusLine().getStatusCode() == 200) {
+ String content = EntityUtils.toString(response.getEntity(), "UTF-8");
+ System.out.println(content);
+ }
+ } finally {
+ if (response != null) {
+ response.close();
+ }
+ httpclient.close();
+ }
+ }
+```
+
+#### 5.6 Granted permission
+
+ * Granted permissions include project permissions, resource permissions, data source permissions, UDF function permissions.
+ * The administrator can authorize the projects, resources, data sources and UDF functions not created by ordinary users. Because the authorization methods for projects, resources, data sources and UDF functions are the same, we take project authorization as an example.
+ * Note: For projects created by users themselves, the user has all permissions. The project list and the selected project list will not be displayed.
+
+- The administrator enters the Security Center -> User Management page and clicks the "Authorize" button of the user who needs to be authorized, as shown in the figure below:
+ <p align="center">
+ <img src="/img/auth-en.png" width="80%" />
+</p>
+
+- Select the project to authorize the project.
+
+<p align="center">
+ <img src="/img/authproject-en.png" width="80%" />
+ </p>
+
+- Resources, data sources, and UDF function authorization are the same as project authorization.
+
+### 6. monitoring Center
+
+#### 6.1 Service management
+
+- Service management is mainly to monitor and display the health status and basic information of each service in the system
+
+#### 6.1.1 master monitoring
+
+- Mainly related to master information.
+<p align="center">
+ <img src="/img/master-jk-en.png" width="80%" />
+ </p>
+
+#### 6.1.2 worker monitoring
+
+- Mainly related to worker information.
+
+<p align="center">
+ <img src="/img/worker-jk-en.png" width="80%" />
+ </p>
+
+#### 6.1.3 Zookeeper monitoring
+
+- Mainly related configuration information of each worker and master in zookpeeper.
+
+<p align="center">
+ <img src="/img/zookeeper-monitor-en.png" width="80%" />
+ </p>
+
+#### 6.1.4 DB monitoring
+
+- Mainly the health of the DB
+
+<p align="center">
+ <img src="/img/mysql-jk-en.png" width="80%" />
+ </p>
+
+#### 6.2 Statistics management
+
+<p align="center">
+ <img src="/img/statistics-en.png" width="80%" />
+ </p>
+
+- Number of commands to be executed: statistics on the t_ds_command table
+- The number of failed commands: statistics on the t_ds_error_command table
+- Number of tasks to run: Count the data of task_queue in Zookeeper
+- Number of tasks to be killed: Count the data of task_kill in Zookeeper
+
+### 7. <span id=TaskParamers>Task node type and parameter settings</span>
+
+#### 7.1 Shell node
+
+> Shell node, when the worker is executed, a temporary shell script is generated, and the linux user with the same name as the tenant executes the script.
+
+- Click Project Management-Project Name-Workflow Definition, and click the "Create Workflow" button to enter the DAG editing page.
+- Drag <img src="/img/shell.png" width="35"/> from the toolbar to the drawing board, as shown in the figure below:
+
+ <p align="center">
+ <img src="/img/shell-en.png" width="80%" />
+ </p>
+
+- Node name: The node name in a workflow definition is unique.
+- Run flag: Identifies whether this node can be scheduled normally, if it does not need to be executed, you can turn on the prohibition switch.
+- Descriptive information: describe the function of the node.
+- Task priority: When the number of worker threads is insufficient, they are executed in order from high to low, and when the priority is the same, they are executed according to the first-in first-out principle.
+- Worker grouping: Tasks are assigned to the machines of the worker group to execute. If Default is selected, a worker machine will be randomly selected for execution.
+- Number of failed retry attempts: The number of times the task failed to be resubmitted. It supports drop-down and hand-filling.
+- Failed retry interval: The time interval for resubmitting the task after a failed task. It supports drop-down and hand-filling.
+- Timeout alarm: Check the timeout alarm and timeout failure. When the task exceeds the "timeout period", an alarm email will be sent and the task execution will fail.
+- Script: SHELL program developed by users.
+- Resource: Refers to the list of resource files that need to be called in the script, and the files uploaded or created by the resource center-file management.
+- User-defined parameters: It is a user-defined parameter that is part of SHELL, which will replace the content with \${variable} in the script.
+
+#### 7.2 Sub-process node
+
+- The sub-process node is to execute a certain external workflow definition as a task node.
+ > Drag the  task node in the toolbar to the drawing board, as shown in the following figure:
+
+<p align="center">
+ <img src="/img/sub-process-en.png" width="80%" />
+ </p>
+
+- Node name: The node name in a workflow definition is unique
+- Run flag: identify whether this node can be scheduled normally
+- Descriptive information: describe the function of the node
+- Timeout alarm: Check the timeout alarm and timeout failure. When the task exceeds the "timeout period", an alarm email will be sent and the task execution will fail.
+- Sub-node: It is the workflow definition of the selected sub-process. Enter the sub-node in the upper right corner to jump to the workflow definition of the selected sub-process
+
+#### 7.3 DEPENDENT node
+
+- Dependent nodes are **dependency check nodes**. For example, process A depends on the successful execution of process B yesterday, and the dependent node will check whether process B has a successful execution yesterday.
+
+> Drag the  task node in the toolbar to the drawing board, as shown in the following figure:
+
+<p align="center">
+ <img src="/img/dependent-nodes-en.png" width="80%" />
+ </p>
+
+> The dependent node provides a logical judgment function, such as checking whether the B process was successful yesterday, or whether the C process was executed successfully.
+
+ <p align="center">
+ <img src="/img/depend-node-en.png" width="80%" />
+ </p>
+
+> For example, process A is a weekly report task, processes B and C are daily tasks, and task A requires tasks B and C to be successfully executed every day of the last week, as shown in the figure:
+
+ <p align="center">
+ <img src="/img/depend-node1-en.png" width="80%" />
+ </p>
+
+> If the weekly report A also needs to be executed successfully last Tuesday:
+
+ <p align="center">
+ <img src="/img/depend-node3-en.png" width="80%" />
+ </p>
+
+#### 7.4 Stored procedure node
+
+- According to the selected data source, execute the stored procedure.
+ > Drag in the toolbarThe task node to the drawing board, as shown in the following figure:
+
+<p align="center">
+ <img src="/img/procedure-en.png" width="80%" />
+ </p>
+
+- Data source: The data source type of the stored procedure supports MySQL and POSTGRESQL, select the corresponding data source
+- Method: is the method name of the stored procedure
+- Custom parameters: The custom parameter types of the stored procedure support IN and OUT, and the data types support nine data types: VARCHAR, INTEGER, LONG, FLOAT, DOUBLE, DATE, TIME, TIMESTAMP, and BOOLEAN
+
+#### 7.5 SQL node
+
+- Drag in the toolbarTask node into the drawing board
+- Non-query SQL function: edit non-query SQL task information, select non-query for sql type, as shown in the figure below:
+ <p align="center">
+ <img src="/img/sql-en.png" width="80%" />
+</p>
+
+- Query SQL function: Edit and query SQL task information, sql type selection query, select form or attachment to send mail to the specified recipient, as shown in the figure below.
Review comment:
```suggestion
- Query SQL function: Edit and query SQL task information, sql type select query, select form or attachment to send mail to the specified recipient, as shown in the figure below.
```
##########
File path: docs/en-us/1.3.2/user_doc/system-manual.md
##########
@@ -0,0 +1,886 @@
+# System User Manual
+
+## Get started quickly
+
+> Please refer to [Quick Start](quick-start.html)
+
+## Operation guide
+
+### 1. Home
+
+The home page contains task status statistics, process status statistics, and workflow definition statistics for all projects of the user.
+
+<p align="center">
+<img src="/img/home_en.png" width="80%" />
+</p>
+
+### 2. Project management
+
+#### 2.1 Create project
+
+- Click "Project Management" to enter the project management page, click the "Create Project" button, enter the project name, project description, and click "Submit" to create a new project.
+
+ <p align="center">
+ <img src="/img/create_project_en1.png" width="80%" />
+ </p>
+
+#### 2.2 Project home
+
+- Click the project name link on the project management page to enter the project home page, as shown in the figure below, the project home page contains the task status statistics, process status statistics, and workflow definition statistics of the project.
+ <p align="center">
+ <img src="/img/project_home_en.png" width="80%" />
+ </p>
+
+- Task status statistics: within the specified time range, count the number of task instances as successful submission, running, ready to pause, pause, ready to stop, stop, failure, success, fault tolerance, kill, and waiting threads
+- Process status statistics: within the specified time range, count the number of the status of the workflow instance as submission success, running, ready to pause, pause, ready to stop, stop, failure, success, fault tolerance, kill, and waiting threads
+- Workflow definition statistics: Count the workflow definitions created by this user and the workflow definitions granted to this user by the administrator
+
+#### 2.3 Workflow definition
+
+#### <span id=creatDag>2.3.1 Create workflow definition</span>
+
+- Click Project Management -> Workflow -> Workflow Definition to enter the workflow definition page, and click the "Create Workflow" button to enter the **workflow DAG edit** page, as shown in the following figure:
+ <p align="center">
+ <img src="/img/dag5.png" width="80%" />
+ </p>
+- Drag in the toolbar <img src="/img/shell.png" width="35"/> Add a Shell task to the drawing board, as shown in the figure below:
+ <p align="center">
+ <img src="/img/shell-en.png" width="80%" />
+ </p>
+- **Add parameter settings for this shell task:**
+
+1. Fill in the "Node Name", "Description", and "Script" fields;
+2. Check “Normal” for “Run Flag”. If “Prohibit Execution” is checked, the task will not be executed when the workflow runs;
+3. Select "Task Priority": When the number of worker threads is insufficient, high-level tasks will be executed first in the execution queue, and tasks with the same priority will be executed in the order of first in, first out;
+4. Timeout alarm (optional): Check the timeout alarm, timeout failure, and fill in the "timeout period". When the task execution time exceeds **timeout period**, an alert email will be sent and the task timeout fails;
+5. Resources (optional). Resource files are files created or uploaded on the Resource Center -> File Management page. For example, the file name is `test.sh`, and the command to call the resource in the script is `sh test.sh`;
+6. Custom parameters (optional), refer to [Custom Parameters](#UserDefinedParameters);
+7. Click the "Confirm Add" button to save the task settings.
+
+- **Increase the order of task execution:** Click the icon in the upper right corner <img src="/img/line.png" width="35"/> to connect the task; as shown in the figure below, task 2 and task 3 are executed in parallel, When task 1 finished execute, tasks 2 and 3 will be executed simultaneously.
+
+ <p align="center">
+ <img src="/img/dag6.png" width="80%" />
+ </p>
+
+- **Delete dependencies:** Click the "arrow" icon in the upper right corner <img src="/img/arrow.png" width="35"/>, select the connection line, and click the "Delete" icon in the upper right corner <img src= "/img/delete.png" width="35"/>, delete dependencies between tasks.
+ <p align="center">
+ <img src="/img/dag7.png" width="80%" />
+ </p>
+
+- **Save workflow definition:** Click the "Save" button, and the "Set DAG chart name" pop-up box will pop up, as shown in the figure below. Enter the workflow definition name, workflow definition description, and set global parameters (optional, refer to [ Custom parameters](#UserDefinedParameters)), click the "Add" button, and the workflow definition is created successfully.
+ <p align="center">
+ <img src="/img/dag8.png" width="80%" />
+ </p>
+> For other types of tasks, please refer to [Task Node Type and Parameter Settings](#TaskParamers).
+
+#### 2.3.2 Workflow definition operation function
+
+Click Project Management -> Workflow -> Workflow Definition to enter the workflow definition page, as shown below:
+
+<p align="center">
+<img src="/img/work_list_en.png" width="80%" />
+</p>
+The operation functions of the workflow definition list are as follows:
+
+- **Edit:** Only "offline" workflow definitions can be edited. Workflow DAG editing is the same as [Create Workflow Definition](#creatDag).
+- **Online:** When the workflow status is "Offline", used to online workflow. Only the workflow in the "Online" state can run, but cannot be edited.
+- **Offline:** When the workflow status is "Online", used to offline workflow. Only the workflow in the "Offline" state can be edited, but not run.
+- **Run:** Only workflow in the online state can run. See [2.3.3 Run Workflow](#runWorkflow) for the operation steps
+- **Timing:** Timing can only be set in online workflows, and the system automatically schedules the workflow to run on a regular basis. The status after creating a timing is "offline", and the timing must be online on the timing management page to take effect. See [2.3.4 Workflow Timing](#creatTiming) for timing operation steps.
+- **Timing Management:** The timing management page can be edited, online/offline, and deleted.
+- **Delete:** Delete the workflow definition.
+- **Download:** Download workflow definition to local.
+- **Tree Diagram:** Display the task node type and task status in a tree structure, as shown in the figure below:
+ <p align="center">
+ <img src="/img/tree_en.png" width="80%" />
+ </p>
+
+#### <span id=runWorkflow>2.3.3 Run the workflow</span>
+
+- Click Project Management -> Workflow -> Workflow Definition to enter the workflow definition page, as shown in the figure below, click the "Go Online" button <img src="/img/online.png" width="35"/>,Go online workflow.
+ <p align="center">
+ <img src="/img/work_list_en.png" width="80%" />
+ </p>
+
+- Click the "Run" button to pop up the startup parameter setting pop-up box, as shown in the figure below, set the startup parameters, click the "Run" button in the pop-up box, the workflow starts running, and the workflow instance page generates a workflow instance.
+ <p align="center">
+ <img src="/img/run_work_en.png" width="80%" />
+ </p>
+ <span id=runParamers>Description of workflow operating parameters:</span>
+
+ * Failure strategy: When a task node fails to execute, other parallel task nodes need to execute the strategy. "Continue" means: after a certain task fails, other task nodes execute normally; "End" means: terminate all tasks being executed, and terminate the entire process.
+ * Notification strategy: When the process is over, the process execution information notification email is sent according to the process status, including any status is not sent, successful sent, failed sent, successful or failed sent.
+ * Process priority: The priority of process operation, divided into five levels: highest (HIGHEST), high (HIGH), medium (MEDIUM), low (LOW), and lowest (LOWEST). When the number of master threads is insufficient, high-level processes will be executed first in the execution queue, and processes with the same priority will be executed in a first-in first-out order.
+ * Worker group: The process can only be executed in the specified worker machine group. The default is Default, which can be executed on any worker.
+ * Notification group: select notification strategy||timeout alarm||when fault tolerance occurs, process information or email will be sent to all members in the notification group.
+ * Recipient: Select notification policy||Timeout alarm||When fault tolerance occurs, process information or alarm email will be sent to the recipient list.
+ * Cc: Select the notification strategy||Timeout alarm||When fault tolerance occurs, the process information or warning email will be copied to the CC list.
+ * Complement: Two modes including serial complement and parallel complement. Serial complement: within the specified time range, the complement is executed sequentially from the start date to the end date, and only one process instance is generated; parallel complement: within the specified time range, multiple days are complemented at the same time to generate N process instances.
+ * For example, you need to fill in the data from May 1 to May 10.
+
+ <p align="center">
+ <img src="/img/complement_en1.png" width="80%" />
+ </p>
+
+ > Serial mode: The complement is executed sequentially from May 1 to May 10, and a process instance is generated on the process instance page;
+
+ > Parallel mode: The tasks from May 1 to may 10 are executed simultaneously, and 10 process instances are generated on the process instance page.
+
+#### <span id=creatTiming>2.3.4 Workflow timing</span>
+
+- Create timing: Click Project Management->Workflow->Workflow Definition, enter the workflow definition page, go online the workflow, click the "timing" button <img src="/img/timing.png" width="35"/> ,The timing parameter setting dialog box pops up, as shown in the figure below:
+ <p align="center">
+ <img src="/img/time_schedule_en.png" width="80%" />
+ </p>
+- Choose the start and end time. In the start and end time range, the workflow is run at regular intervals; not in the start and end time range, no more regular workflow instances are generated.
+- Add a timing that is executed once every day at 5 AM, as shown in the following figure:
+ <p align="center">
+ <img src="/img/timer-en.png" width="80%" />
+ </p>
+- Failure strategy, notification strategy, process priority, worker group, notification group, recipient, and CC are the same as [workflow running parameters](#runParamers).
+- Click the "Create" button to create the timing successfully. At this time, the timing status is "**Offline**" and the timing needs to be **Online** to take effect.
+- Timing online: Click the "timing management" button <img src="/img/timeManagement.png" width="35"/>, enter the timing management page, click the "online" button, the timing status will change to "online", as shown in the below figure, the workflow takes effect regularly.
+ <p align="center">
+ <img src="/img/time-manage-list-en.png" width="80%" />
+ </p>
+
+#### 2.3.5 Import workflow
+
+Click Project Management -> Workflow -> Workflow Definition to enter the workflow definition page, click the "Import Workflow" button to import the local workflow file, the workflow definition list displays the imported workflow, and the status is offline.
+
+#### 2.4 Workflow instance
+
+#### 2.4.1 View workflow instance
+
+- Click Project Management -> Workflow -> Workflow Instance to enter the Workflow Instance page, as shown in the figure below:
+ <p align="center">
+ <img src="/img/instance-list-en.png" width="80%" />
+ </p>
+- Click the workflow name to enter the DAG view page to view the task execution status, as shown in the figure below.
+ <p align="center">
+ <img src="/img/instance-runs-en.png" width="80%" />
+ </p>
+
+#### 2.4.2 View task log
+
+- Enter the workflow instance page, click the workflow name, enter the DAG view page, double-click the task node, as shown in the following figure:
+ <p align="center">
+ <img src="/img/instanceViewLog-en.png" width="80%" />
+ </p>
+- Click "View Log", a log pop-up box will pop up, as shown in the figure below, the task log can also be viewed on the task instance page, refer to [Task View Log](#taskLog)。
+ <p align="center">
+ <img src="/img/task-log-en.png" width="80%" />
+ </p>
+
+#### 2.4.3 View task history
+
+- Click Project Management -> Workflow -> Workflow Instance to enter the workflow instance page, and click the workflow name to enter the workflow DAG page;
+- Double-click the task node, as shown in the figure below, click "View History" to jump to the task instance page, and display a list of task instances running by the workflow instance
+ <p align="center">
+ <img src="/img/task_history_en.png" width="80%" />
+ </p>
+
+#### 2.4.4 View operating parameters
+
+- Click Project Management -> Workflow -> Workflow Instance to enter the workflow instance page, and click the workflow name to enter the workflow DAG page;
+- Click the icon in the upper left corner <img src="/img/run_params_button.png" width="35"/>,View the startup parameters of the workflow instance; click the icon <img src="/img/global_param.png" width="35"/>,View the global and local parameters of the workflow instance, as shown in the following figure:
+ <p align="center">
+ <img src="/img/run_params_en.png" width="80%" />
+ </p>
+
+#### 2.4.4 Workflow instance operation function
+
+Click Project Management -> Workflow -> Workflow Instance to enter the Workflow Instance page, as shown in the figure below:
+
+ <p align="center">
+ <img src="/img/instance-list-en.png" width="80%" />
+ </p>
+
+- **Edit:** Only terminated processes can be edited. Click the "Edit" button or the name of the workflow instance to enter the DAG edit page. After edit, click the "Save" button to pop up the Save DAG pop-up box, as shown in the figure below. In the pop-up box, check "Whether to update to workflow definition" and save After that, the workflow definition will be updated; if it is not checked, the workflow definition will not be updated.
+ <p align="center">
+ <img src="/img/editDag-en.png" width="80%" />
+ </p>
+- **Rerun:** Re-execute the terminated process.
+- **Recovery failed:** For failed processes, you can perform recovery operations, starting from the failed node.
+- **Stop:** To **stop** the running process, the background will first `kill`worker process, and then execute `kill -9` operation
+- **Pause:** Perform a **pause** operation on the running process, the system status will change to **waiting for execution**, it will wait for the end of the task being executed, and pause the next task to be executed.
+- **Resume pause:** To resume the paused process, start running directly from the **paused node**
+- **Delete:** Delete the workflow instance and the task instance under the workflow instance
+- **Gantt chart:** The vertical axis of the Gantt chart is the topological sorting of task instances under a certain workflow instance, and the horizontal axis is the running time of the task instances, as shown in the figure:
+ <p align="center">
+ <img src="/img/gantt-en.png" width="80%" />
+ </p>
+
+#### 2.5 Task instance
+
+- Click Project Management -> Workflow -> Task Instance to enter the task instance page, as shown in the figure below, click the name of the workflow instance, you can jump to the workflow instance DAG chart to view the task status.
+ <p align="center">
+ <img src="/img/task-list-en.png" width="80%" />
+ </p>
+
+- <span id=taskLog>View log:</span>Click the "view log" button in the operation column to view the log of task execution.
+ <p align="center">
+ <img src="/img/task-log2-en.png" width="80%" />
+ </p>
+
+### 3. Resource Center
+
+#### 3.1 hdfs resource configuration
+
+- Upload resource files and udf functions, all uploaded files and resources will be stored on hdfs, so the following configuration items are required:
+
+```
+
+conf/common/common.properties
+ # Users who have permission to create directories under the HDFS root path
+ hdfs.root.user=hdfs
+ # data base dir, resource file will store to this hadoop hdfs path, self configuration, please make sure the directory exists on hdfs and have read write permissions。"/escheduler" is recommended
+ data.store2hdfs.basepath=/dolphinscheduler
+ # resource upload startup type : HDFS,S3,NONE
+ res.upload.startup.type=HDFS
+ # whether kerberos starts
+ hadoop.security.authentication.startup.state=false
+ # java.security.krb5.conf path
+ java.security.krb5.conf.path=/opt/krb5.conf
+ # loginUserFromKeytab user
+ login.user.keytab.username=hdfs-mycluster@ESZ.COM
+ # loginUserFromKeytab path
+ login.user.keytab.path=/opt/hdfs.headless.keytab
+
+conf/common/hadoop.properties
+ # ha or single namenode,If namenode ha needs to copy core-site.xml and hdfs-site.xml
+ # to the conf directory,support s3,for example : s3a://dolphinscheduler
+ fs.defaultFS=hdfs://mycluster:8020
+ #resourcemanager ha note this need ips , this empty if single
+ yarn.resourcemanager.ha.rm.ids=192.168.xx.xx,192.168.xx.xx
+ # If it is a single resourcemanager, you only need to configure one host name. If it is resourcemanager HA, the default configuration is fine
+ yarn.application.status.address=http://xxxx:8088/ws/v1/cluster/apps/%s
+
+```
+
+- Only one address needs to be configured for yarn.resourcemanager.ha.rm.ids and yarn.application.status.address, and the other address is empty.
+- You need to copy core-site.xml and hdfs-site.xml from the conf directory of the Hadoop cluster to the conf directory of the dolphinscheduler project, and restart the api-server service.
+
+#### 3.2 File management
+
+> It is the management of various resource files, including creating basic txt/log/sh/conf/py/java and other files, uploading jar packages and other types of files, and can do edit, rename, download, delete and other operations.
+
+ <p align="center">
+ <img src="/img/file-manage-en.png" width="80%" />
+ </p>
+
+- Create a file
+ > The file format supports the following types: txt, log, sh, conf, cfg, py, java, sql, xml, hql, properties
+
+<p align="center">
+ <img src="/img/file_create_en.png" width="80%" />
+ </p>
+
+- upload files
+
+> Upload file: Click the "Upload File" button to upload, drag the file to the upload area, the file name will be automatically completed with the uploaded file name
+
+<p align="center">
+ <img src="/img/file-upload-en.png" width="80%" />
+ </p>
+
+- File View
+
+> For the file types that can be viewed, click the file name to view the file details
+
+<p align="center">
+ <img src="/img/file_detail_en.png" width="80%" />
+ </p>
+
+- download file
+
+> Click the "Download" button in the file list to download the file or click the "Download" button in the upper right corner of the file details to download the file
+
+- File rename
+
+<p align="center">
+ <img src="/img/file_rename_en.png" width="80%" />
+ </p>
+
+- delete
+ > File list -> Click the "Delete" button to delete the specified file
+
+#### 3.3 UDF management
+
+#### 3.3.1 Resource management
+
+> The resource management and file management functions are similar. The difference is that the resource management is the uploaded UDF function, and the file management uploads the user program, script and configuration file.
+> Operation function: rename, download, delete.
+
+- Upload udf resources
+ > Same as uploading files.
+
+#### 3.3.2 Function management
+
+- Create UDF function
+ > Click "Create UDF Function", enter the udf function parameters, select the udf resource, and click "Submit" to create the udf function.
+
+> Currently only supports temporary UDF functions of HIVE
+
+- UDF function name: the name when the UDF function is entered
+- Package name Class name: Enter the full path of the UDF function
+- UDF resource: Set the resource file corresponding to the created UDF
+
+<p align="center">
+ <img src="/img/udf_edit_en.png" width="80%" />
+ </p>
+
+### 4. Create data source
+
+> Data source center supports MySQL, POSTGRESQL, HIVE/IMPALA, SPARK, CLICKHOUSE, ORACLE, SQLSERVER and other data sources
+
+#### 4.1 Create/Edit MySQL data source
+
+- Click "Data Source Center -> Create Data Source" to create different types of data sources according to requirements.
+
+- Data source: select MYSQL
+- Data source name: enter the name of the data source
+- Description: Enter a description of the data source
+- IP hostname: enter the IP to connect to MySQL
+- Port: Enter the port to connect to MySQL
+- Username: Set the username for connecting to MySQL
+- Password: Set the password for connecting to MySQL
+- Database name: Enter the name of the database connected to MySQL
+- Jdbc connection parameters: parameter settings for MySQL connection, filled in in JSON form
+
+<p align="center">
+ <img src="/img/mysql-en.png" width="80%" />
+ </p>
+
+> Click "Test Connection" to test whether the data source can be successfully connected.
+
+#### 4.2 Create/Edit POSTGRESQL data source
+
+- Data source: select POSTGRESQL
+- Data source name: enter the name of the data source
+- Description: Enter a description of the data source
+- IP/Host Name: Enter the IP to connect to POSTGRESQL
+- Port: Enter the port to connect to POSTGRESQL
+- Username: Set the username for connecting to POSTGRESQL
+- Password: Set the password for connecting to POSTGRESQL
+- Database name: Enter the name of the database connected to POSTGRESQL
+- Jdbc connection parameters: parameter settings for POSTGRESQL connection, filled in in JSON form
+
+<p align="center">
+ <img src="/img/postgresql-en.png" width="80%" />
+ </p>
+
+#### 4.3 Create/Edit HIVE data source
+
+1.Use HiveServer2 to connect
+
+ <p align="center">
+ <img src="/img/hive-en.png" width="80%" />
+ </p>
+
+- Data source: select HIVE
+- Data source name: enter the name of the data source
+- Description: Enter a description of the data source
+- IP/Host Name: Enter the IP connected to HIVE
+- Port: Enter the port connected to HIVE
+- Username: Set the username for connecting to HIVE
+- Password: Set the password for connecting to HIVE
+- Database name: Enter the name of the database connected to HIVE
+- Jdbc connection parameters: parameter settings for HIVE connection, filled in in JSON form
+
+ 2.Use HiveServer2 HA Zookeeper to connect
+
+ <p align="center">
+ <img src="/img/hive1-en.png" width="80%" />
+ </p>
+
+Note: If you enable **kerberos**, you need to fill in **Principal**
+
+<p align="center">
+ <img src="/img/hive-en.png" width="80%" />
+ </p>
+
+#### 4.4 Create/Edit Spark data source
+
+<p align="center">
+ <img src="/img/spark-en.png" width="80%" />
+ </p>
+
+- Data source: select Spark
+- Data source name: enter the name of the data source
+- Description: Enter a description of the data source
+- IP/Hostname: Enter the IP connected to Spark
+- Port: Enter the port connected to Spark
+- Username: Set the username for connecting to Spark
+- Password: Set the password for connecting to Spark
+- Database name: Enter the name of the database connected to Spark
+- Jdbc connection parameters: parameter settings for Spark connection, filled in in JSON form
+
+### 5. Security Center (Permission System)
+
+ * Only the administrator account in the security center has the authority to operate. It has functions such as queue management, tenant management, user management, alarm group management, worker group management, token management, etc. In the user management module, resources, data sources, projects, etc. Authorization
+ * Administrator login, default user name and password: admin/dolphinscheduler123
+
+#### 5.1 Create queue
+
+- Queue is used when the "queue" parameter is needed to execute programs such as spark and mapreduce.
+- The administrator enters the Security Center->Queue Management page and clicks the "Create Queue" button to create a queue.
+<p align="center">
+ <img src="/img/create-queue-en.png" width="80%" />
+ </p>
+
+#### 5.2 Add tenant
+
+- The tenant corresponds to the Linux user, which is used by the worker to submit the job. If Linux does not have this user, the worker will create this user when executing the script.
+- Tenant Code: **Tenant Code is the only user on Linux and cannot be repeated**
+- The administrator enters the Security Center->Tenant Management page and clicks the "Create Tenant" button to create a tenant.
+
+ <p align="center">
+ <img src="/img/addtenant-en.png" width="80%" />
+ </p>
+
+#### 5.3 Create normal user
+
+- Users are divided into **administrator users** and **normal users**
+
+ - The administrator has authorization and user management authority, but does not have the authority to create project and workflow definition operations.
+ - Ordinary users can create projects and create, edit, and execute workflow definitions.
+ - Note: If the user switches tenants, all resources under the tenant where the user belongs will be copied to the new tenant that is switched.
+
+- The administrator enters the Security Center -> User Management page and clicks the "Create User" button to create a user.
+<p align="center">
+ <img src="/img/user-en.png" width="80%" />
+ </p>
+
+> **Edit user information**
+
+- The administrator enters the Security Center->User Management page and clicks the "Edit" button to edit user information.
+- After an ordinary user logs in, click the user information in the user name drop-down box to enter the user information page, and click the "Edit" button to edit the user information.
+
+> **Modify user password**
+
+- The administrator enters the Security Center->User Management page and clicks the "Edit" button. When editing user information, enter the new password to modify the user password.
+- After a normal user logs in, click the user information in the user name drop-down box to enter the password modification page, enter the password and confirm the password and click the "Edit" button, then the password modification is successful.
+
+#### 5.4 Create alarm group
+
+- The alarm group is a parameter set at startup. After the process ends, the status of the process and other information will be sent to the alarm group in the form of email.
+
+* The administrator enters the Security Center -> Alarm Group Management page and clicks the "Create Alarm Group" button to create an alarm group.
+
+ <p align="center">
+ <img src="/img/mail-en.png" width="80%" />
+
+#### 5.5 Token management
+
+> Since the back-end interface has login check, token management provides a way to perform various operations on the system by calling the interface.
+
+- The administrator enters the Security Center -> Token Management page, clicks the "Create Token" button, selects the expiration time and user, clicks the "Generate Token" button, and clicks the "Submit" button, then the selected user's token is created successfully.
+
+ <p align="center">
+ <img src="/img/create-token-en.png" width="80%" />
+ </p>
+
+ - After an ordinary user logs in, click the user information in the user name drop-down box, enter the token management page, select the expiration time, click the "generate token" button, and click the "submit" button, then the user creates a token successfully.
+ - Call example:
+
+```
+Token call example
+ /**
+ * test token
+ */
+ public void doPOSTParam()throws Exception{
+ // create HttpClient
+ CloseableHttpClient httpclient = HttpClients.createDefault();
+
+ // create http post request
+ HttpPost httpPost = new HttpPost("http://127.0.0.1:12345/escheduler/projects/create");
+ httpPost.setHeader("token", "123");
+ // set parameters
+ List<NameValuePair> parameters = new ArrayList<NameValuePair>();
+ parameters.add(new BasicNameValuePair("projectName", "qzw"));
+ parameters.add(new BasicNameValuePair("desc", "qzw"));
+ UrlEncodedFormEntity formEntity = new UrlEncodedFormEntity(parameters);
+ httpPost.setEntity(formEntity);
+ CloseableHttpResponse response = null;
+ try {
+ // execute
+ response = httpclient.execute(httpPost);
+ // response status code 200
+ if (response.getStatusLine().getStatusCode() == 200) {
+ String content = EntityUtils.toString(response.getEntity(), "UTF-8");
+ System.out.println(content);
+ }
+ } finally {
+ if (response != null) {
+ response.close();
+ }
+ httpclient.close();
+ }
+ }
+```
+
+#### 5.6 Granted permission
+
+ * Granted permissions include project permissions, resource permissions, data source permissions, UDF function permissions.
+ * The administrator can authorize the projects, resources, data sources and UDF functions not created by ordinary users. Because the authorization methods for projects, resources, data sources and UDF functions are the same, we take project authorization as an example.
+ * Note: For projects created by users themselves, the user has all permissions. The project list and the selected project list will not be displayed.
+
+- The administrator enters the Security Center -> User Management page and clicks the "Authorize" button of the user who needs to be authorized, as shown in the figure below:
+ <p align="center">
+ <img src="/img/auth-en.png" width="80%" />
+</p>
+
+- Select the project to authorize the project.
+
+<p align="center">
+ <img src="/img/authproject-en.png" width="80%" />
+ </p>
+
+- Resources, data sources, and UDF function authorization are the same as project authorization.
+
+### 6. monitoring Center
+
+#### 6.1 Service management
+
+- Service management is mainly to monitor and display the health status and basic information of each service in the system
+
+#### 6.1.1 master monitoring
+
+- Mainly related to master information.
+<p align="center">
+ <img src="/img/master-jk-en.png" width="80%" />
+ </p>
+
+#### 6.1.2 worker monitoring
+
+- Mainly related to worker information.
+
+<p align="center">
+ <img src="/img/worker-jk-en.png" width="80%" />
+ </p>
+
+#### 6.1.3 Zookeeper monitoring
+
+- Mainly related configuration information of each worker and master in zookpeeper.
+
+<p align="center">
+ <img src="/img/zookeeper-monitor-en.png" width="80%" />
+ </p>
+
+#### 6.1.4 DB monitoring
+
+- Mainly the health of the DB
+
+<p align="center">
+ <img src="/img/mysql-jk-en.png" width="80%" />
+ </p>
+
+#### 6.2 Statistics management
+
+<p align="center">
+ <img src="/img/statistics-en.png" width="80%" />
+ </p>
+
+- Number of commands to be executed: statistics on the t_ds_command table
+- The number of failed commands: statistics on the t_ds_error_command table
+- Number of tasks to run: Count the data of task_queue in Zookeeper
+- Number of tasks to be killed: Count the data of task_kill in Zookeeper
+
+### 7. <span id=TaskParamers>Task node type and parameter settings</span>
+
+#### 7.1 Shell node
+
+> Shell node, when the worker is executed, a temporary shell script is generated, and the linux user with the same name as the tenant executes the script.
+
+- Click Project Management-Project Name-Workflow Definition, and click the "Create Workflow" button to enter the DAG editing page.
+- Drag <img src="/img/shell.png" width="35"/> from the toolbar to the drawing board, as shown in the figure below:
+
+ <p align="center">
+ <img src="/img/shell-en.png" width="80%" />
+ </p>
+
+- Node name: The node name in a workflow definition is unique.
+- Run flag: Identifies whether this node can be scheduled normally, if it does not need to be executed, you can turn on the prohibition switch.
+- Descriptive information: describe the function of the node.
+- Task priority: When the number of worker threads is insufficient, they are executed in order from high to low, and when the priority is the same, they are executed according to the first-in first-out principle.
+- Worker grouping: Tasks are assigned to the machines of the worker group to execute. If Default is selected, a worker machine will be randomly selected for execution.
+- Number of failed retry attempts: The number of times the task failed to be resubmitted. It supports drop-down and hand-filling.
+- Failed retry interval: The time interval for resubmitting the task after a failed task. It supports drop-down and hand-filling.
+- Timeout alarm: Check the timeout alarm and timeout failure. When the task exceeds the "timeout period", an alarm email will be sent and the task execution will fail.
+- Script: SHELL program developed by users.
+- Resource: Refers to the list of resource files that need to be called in the script, and the files uploaded or created by the resource center-file management.
+- User-defined parameters: It is a user-defined parameter that is part of SHELL, which will replace the content with \${variable} in the script.
+
+#### 7.2 Sub-process node
+
+- The sub-process node is to execute a certain external workflow definition as a task node.
+ > Drag the  task node in the toolbar to the drawing board, as shown in the following figure:
+
+<p align="center">
+ <img src="/img/sub-process-en.png" width="80%" />
+ </p>
+
+- Node name: The node name in a workflow definition is unique
+- Run flag: identify whether this node can be scheduled normally
+- Descriptive information: describe the function of the node
+- Timeout alarm: Check the timeout alarm and timeout failure. When the task exceeds the "timeout period", an alarm email will be sent and the task execution will fail.
+- Sub-node: It is the workflow definition of the selected sub-process. Enter the sub-node in the upper right corner to jump to the workflow definition of the selected sub-process
+
+#### 7.3 DEPENDENT node
+
+- Dependent nodes are **dependency check nodes**. For example, process A depends on the successful execution of process B yesterday, and the dependent node will check whether process B has a successful execution yesterday.
+
+> Drag the  task node in the toolbar to the drawing board, as shown in the following figure:
+
+<p align="center">
+ <img src="/img/dependent-nodes-en.png" width="80%" />
+ </p>
+
+> The dependent node provides a logical judgment function, such as checking whether the B process was successful yesterday, or whether the C process was executed successfully.
+
+ <p align="center">
+ <img src="/img/depend-node-en.png" width="80%" />
+ </p>
+
+> For example, process A is a weekly report task, processes B and C are daily tasks, and task A requires tasks B and C to be successfully executed every day of the last week, as shown in the figure:
+
+ <p align="center">
+ <img src="/img/depend-node1-en.png" width="80%" />
+ </p>
+
+> If the weekly report A also needs to be executed successfully last Tuesday:
+
+ <p align="center">
+ <img src="/img/depend-node3-en.png" width="80%" />
+ </p>
+
+#### 7.4 Stored procedure node
+
+- According to the selected data source, execute the stored procedure.
+ > Drag in the toolbarThe task node to the drawing board, as shown in the following figure:
+
+<p align="center">
+ <img src="/img/procedure-en.png" width="80%" />
+ </p>
+
+- Data source: The data source type of the stored procedure supports MySQL and POSTGRESQL, select the corresponding data source
+- Method: is the method name of the stored procedure
+- Custom parameters: The custom parameter types of the stored procedure support IN and OUT, and the data types support nine data types: VARCHAR, INTEGER, LONG, FLOAT, DOUBLE, DATE, TIME, TIMESTAMP, and BOOLEAN
+
+#### 7.5 SQL node
+
+- Drag in the toolbarTask node into the drawing board
+- Non-query SQL function: edit non-query SQL task information, select non-query for sql type, as shown in the figure below:
+ <p align="center">
+ <img src="/img/sql-en.png" width="80%" />
+</p>
+
+- Query SQL function: Edit and query SQL task information, sql type selection query, select form or attachment to send mail to the specified recipient, as shown in the figure below.
+
+<p align="center">
+ <img src="/img/sql-node-en.png" width="80%" />
+ </p>
+
+- Data source: select the corresponding data source
+- sql type: supports query and non-query. The query is a select type query, which is returned with a result set. You can specify three templates for email notification as form, attachment or form attachment. Non-queries are returned without a result set, and are for three types of operations: update, delete, and insert.
+- sql parameter: the input parameter format is key1=value1;key2=value2...
+- sql statement: SQL statement
+- UDF function: For data sources of type HIVE, you can refer to UDF functions created in the resource center. UDF functions are not supported for other types of data sources.
+- Custom parameters: SQL task type, and stored procedure is a custom parameter order to set values for the method. The custom parameter type and data type are the same as the stored procedure task type. The difference is that the SQL task type custom parameter will replace the \${variable} in the SQL statement.
+- Pre-sql: Pre-sql is executed before the sql statement.
+- Post-sql: Post-sql is executed after the sql statement.
+
+#### 7.6 SPARK node
+
+- Through the SPARK node, you can directly execute the SPARK program. For the spark node, the worker will use the `spark-submit` method to submit tasks
+
+> Drag in the toolbarThe task node to the drawing board, as shown in the following figure:
+
+<p align="center">
+ <img src="/img/spark-submit-en.png" width="80%" />
+ </p>
+
+- Program type: supports JAVA, Scala and Python three languages
+- The class of the main function: is the full path of the Spark program’s entry Main Class
+- Main jar package: Spark jar package
+- Deployment mode: support three modes of yarn-cluster, yarn-client and local
+- Driver core number: You can set the number of Driver cores and the number of memory
+- Number of Executors: You can set the number of Executors, the number of Executor memory, and the number of Executor cores
+- Command line parameters: Set the input parameters of the Spark program and support the substitution of custom parameter variables.
+- Other parameters: support --jars, --files, --archives, --conf format
+- Resource: If the resource file is referenced in other parameters, you need to select and specify in the resource
+- User-defined parameter: It is a user-defined parameter of the MR part, which will replace the content with \${variable} in the script
+
+Note: JAVA and Scala are only used for identification, there is no difference, if it is Spark developed by Python, there is no main function class, and the others are the same
+
+#### 7.7 MapReduce(MR) node
+
+- Using the MR node, you can directly execute the MR program. For the mr node, the worker will use the `hadoop jar` method to submit tasks
+
+> Drag the  task node in the toolbar to the drawing board, as shown in the following figure:
+
+1. JAVA program
+
+ <p align="center">
+ <img src="/img/mr_java_en.png" width="80%" />
+ </p>
+
+- The class of the main function: is the full path of the Main Class, the entry point of the MR program
+- Program type: select JAVA language
+- Main jar package: is the MR jar package
+- Command line parameters: set the input parameters of the MR program and support the substitution of custom parameter variables
+- Other parameters: support -D, -files, -libjars, -archives format
+- Resource: If the resource file is referenced in other parameters, you need to select and specify in the resource
+- User-defined parameter: It is a user-defined parameter of the MR part, which will replace the content with \${variable} in the script
+
+2. Python program
+
+<p align="center">
+ <img src="/img/mr_edit_en.png" width="80%" />
+ </p>
+
+- Program type: select Python language
+- Main jar package: is the Python jar package for running MR
+- Other parameters: support -D, -mapper, -reducer, -input -output format, here you can set the input of user-defined parameters, such as:
+- -mapper "mapper.py 1" -file mapper.py -reducer reducer.py -file reducer.py –input /journey/words.txt -output /journey/out/mr/\${currentTimeMillis}
+- The mapper.py 1 after -mapper is two parameters, the first parameter is mapper.py, and the second parameter is 1
+- Resource: If the resource file is referenced in other parameters, you need to select and specify in the resource
+- User-defined parameter: It is a user-defined parameter of the MR part, which will replace the content with \${variable} in the script
Review comment:
```suggestion
- User-defined parameter: It is a local user-defined parameter of the MR, which will replace the content with \${variable} in the script
```
##########
File path: docs/en-us/1.3.2/user_doc/system-manual.md
##########
@@ -0,0 +1,886 @@
+# System User Manual
+
+## Get started quickly
+
+> Please refer to [Quick Start](quick-start.html)
+
+## Operation guide
+
+### 1. Home
+
+The home page contains task status statistics, process status statistics, and workflow definition statistics for all projects of the user.
+
+<p align="center">
+<img src="/img/home_en.png" width="80%" />
+</p>
+
+### 2. Project management
+
+#### 2.1 Create project
+
+- Click "Project Management" to enter the project management page, click the "Create Project" button, enter the project name, project description, and click "Submit" to create a new project.
+
+ <p align="center">
+ <img src="/img/create_project_en1.png" width="80%" />
+ </p>
+
+#### 2.2 Project home
+
+- Click the project name link on the project management page to enter the project home page, as shown in the figure below, the project home page contains the task status statistics, process status statistics, and workflow definition statistics of the project.
+ <p align="center">
+ <img src="/img/project_home_en.png" width="80%" />
+ </p>
+
+- Task status statistics: within the specified time range, count the number of task instances as successful submission, running, ready to pause, pause, ready to stop, stop, failure, success, fault tolerance, kill, and waiting threads
+- Process status statistics: within the specified time range, count the number of the status of the workflow instance as submission success, running, ready to pause, pause, ready to stop, stop, failure, success, fault tolerance, kill, and waiting threads
+- Workflow definition statistics: Count the workflow definitions created by this user and the workflow definitions granted to this user by the administrator
+
+#### 2.3 Workflow definition
+
+#### <span id=creatDag>2.3.1 Create workflow definition</span>
+
+- Click Project Management -> Workflow -> Workflow Definition to enter the workflow definition page, and click the "Create Workflow" button to enter the **workflow DAG edit** page, as shown in the following figure:
+ <p align="center">
+ <img src="/img/dag5.png" width="80%" />
+ </p>
+- Drag in the toolbar <img src="/img/shell.png" width="35"/> Add a Shell task to the drawing board, as shown in the figure below:
+ <p align="center">
+ <img src="/img/shell-en.png" width="80%" />
+ </p>
+- **Add parameter settings for this shell task:**
+
+1. Fill in the "Node Name", "Description", and "Script" fields;
+2. Check “Normal” for “Run Flag”. If “Prohibit Execution” is checked, the task will not be executed when the workflow runs;
+3. Select "Task Priority": When the number of worker threads is insufficient, high-level tasks will be executed first in the execution queue, and tasks with the same priority will be executed in the order of first in, first out;
+4. Timeout alarm (optional): Check the timeout alarm, timeout failure, and fill in the "timeout period". When the task execution time exceeds **timeout period**, an alert email will be sent and the task timeout fails;
+5. Resources (optional). Resource files are files created or uploaded on the Resource Center -> File Management page. For example, the file name is `test.sh`, and the command to call the resource in the script is `sh test.sh`;
+6. Custom parameters (optional), refer to [Custom Parameters](#UserDefinedParameters);
+7. Click the "Confirm Add" button to save the task settings.
+
+- **Increase the order of task execution:** Click the icon in the upper right corner <img src="/img/line.png" width="35"/> to connect the task; as shown in the figure below, task 2 and task 3 are executed in parallel, When task 1 finished execute, tasks 2 and 3 will be executed simultaneously.
+
+ <p align="center">
+ <img src="/img/dag6.png" width="80%" />
+ </p>
+
+- **Delete dependencies:** Click the "arrow" icon in the upper right corner <img src="/img/arrow.png" width="35"/>, select the connection line, and click the "Delete" icon in the upper right corner <img src= "/img/delete.png" width="35"/>, delete dependencies between tasks.
+ <p align="center">
+ <img src="/img/dag7.png" width="80%" />
+ </p>
+
+- **Save workflow definition:** Click the "Save" button, and the "Set DAG chart name" pop-up box will pop up, as shown in the figure below. Enter the workflow definition name, workflow definition description, and set global parameters (optional, refer to [ Custom parameters](#UserDefinedParameters)), click the "Add" button, and the workflow definition is created successfully.
+ <p align="center">
+ <img src="/img/dag8.png" width="80%" />
+ </p>
+> For other types of tasks, please refer to [Task Node Type and Parameter Settings](#TaskParamers).
+
+#### 2.3.2 Workflow definition operation function
+
+Click Project Management -> Workflow -> Workflow Definition to enter the workflow definition page, as shown below:
+
+<p align="center">
+<img src="/img/work_list_en.png" width="80%" />
+</p>
+The operation functions of the workflow definition list are as follows:
+
+- **Edit:** Only "offline" workflow definitions can be edited. Workflow DAG editing is the same as [Create Workflow Definition](#creatDag).
+- **Online:** When the workflow status is "Offline", used to online workflow. Only the workflow in the "Online" state can run, but cannot be edited.
+- **Offline:** When the workflow status is "Online", used to offline workflow. Only the workflow in the "Offline" state can be edited, but not run.
+- **Run:** Only workflow in the online state can run. See [2.3.3 Run Workflow](#runWorkflow) for the operation steps
+- **Timing:** Timing can only be set in online workflows, and the system automatically schedules the workflow to run on a regular basis. The status after creating a timing is "offline", and the timing must be online on the timing management page to take effect. See [2.3.4 Workflow Timing](#creatTiming) for timing operation steps.
+- **Timing Management:** The timing management page can be edited, online/offline, and deleted.
+- **Delete:** Delete the workflow definition.
+- **Download:** Download workflow definition to local.
+- **Tree Diagram:** Display the task node type and task status in a tree structure, as shown in the figure below:
+ <p align="center">
+ <img src="/img/tree_en.png" width="80%" />
+ </p>
+
+#### <span id=runWorkflow>2.3.3 Run the workflow</span>
+
+- Click Project Management -> Workflow -> Workflow Definition to enter the workflow definition page, as shown in the figure below, click the "Go Online" button <img src="/img/online.png" width="35"/>,Go online workflow.
+ <p align="center">
+ <img src="/img/work_list_en.png" width="80%" />
+ </p>
+
+- Click the "Run" button to pop up the startup parameter setting pop-up box, as shown in the figure below, set the startup parameters, click the "Run" button in the pop-up box, the workflow starts running, and the workflow instance page generates a workflow instance.
+ <p align="center">
+ <img src="/img/run_work_en.png" width="80%" />
+ </p>
+ <span id=runParamers>Description of workflow operating parameters:</span>
+
+ * Failure strategy: When a task node fails to execute, other parallel task nodes need to execute the strategy. "Continue" means: after a certain task fails, other task nodes execute normally; "End" means: terminate all tasks being executed, and terminate the entire process.
+ * Notification strategy: When the process is over, the process execution information notification email is sent according to the process status, including any status is not sent, successful sent, failed sent, successful or failed sent.
+ * Process priority: The priority of process operation, divided into five levels: highest (HIGHEST), high (HIGH), medium (MEDIUM), low (LOW), and lowest (LOWEST). When the number of master threads is insufficient, high-level processes will be executed first in the execution queue, and processes with the same priority will be executed in a first-in first-out order.
+ * Worker group: The process can only be executed in the specified worker machine group. The default is Default, which can be executed on any worker.
+ * Notification group: select notification strategy||timeout alarm||when fault tolerance occurs, process information or email will be sent to all members in the notification group.
+ * Recipient: Select notification policy||Timeout alarm||When fault tolerance occurs, process information or alarm email will be sent to the recipient list.
+ * Cc: Select the notification strategy||Timeout alarm||When fault tolerance occurs, the process information or warning email will be copied to the CC list.
+ * Complement: Two modes including serial complement and parallel complement. Serial complement: within the specified time range, the complement is executed sequentially from the start date to the end date, and only one process instance is generated; parallel complement: within the specified time range, multiple days are complemented at the same time to generate N process instances.
+ * For example, you need to fill in the data from May 1 to May 10.
+
+ <p align="center">
+ <img src="/img/complement_en1.png" width="80%" />
+ </p>
+
+ > Serial mode: The complement is executed sequentially from May 1 to May 10, and a process instance is generated on the process instance page;
+
+ > Parallel mode: The tasks from May 1 to may 10 are executed simultaneously, and 10 process instances are generated on the process instance page.
+
+#### <span id=creatTiming>2.3.4 Workflow timing</span>
+
+- Create timing: Click Project Management->Workflow->Workflow Definition, enter the workflow definition page, go online the workflow, click the "timing" button <img src="/img/timing.png" width="35"/> ,The timing parameter setting dialog box pops up, as shown in the figure below:
+ <p align="center">
+ <img src="/img/time_schedule_en.png" width="80%" />
+ </p>
+- Choose the start and end time. In the start and end time range, the workflow is run at regular intervals; not in the start and end time range, no more regular workflow instances are generated.
+- Add a timing that is executed once every day at 5 AM, as shown in the following figure:
+ <p align="center">
+ <img src="/img/timer-en.png" width="80%" />
+ </p>
+- Failure strategy, notification strategy, process priority, worker group, notification group, recipient, and CC are the same as [workflow running parameters](#runParamers).
+- Click the "Create" button to create the timing successfully. At this time, the timing status is "**Offline**" and the timing needs to be **Online** to take effect.
+- Timing online: Click the "timing management" button <img src="/img/timeManagement.png" width="35"/>, enter the timing management page, click the "online" button, the timing status will change to "online", as shown in the below figure, the workflow takes effect regularly.
+ <p align="center">
+ <img src="/img/time-manage-list-en.png" width="80%" />
+ </p>
+
+#### 2.3.5 Import workflow
+
+Click Project Management -> Workflow -> Workflow Definition to enter the workflow definition page, click the "Import Workflow" button to import the local workflow file, the workflow definition list displays the imported workflow, and the status is offline.
+
+#### 2.4 Workflow instance
+
+#### 2.4.1 View workflow instance
+
+- Click Project Management -> Workflow -> Workflow Instance to enter the Workflow Instance page, as shown in the figure below:
+ <p align="center">
+ <img src="/img/instance-list-en.png" width="80%" />
+ </p>
+- Click the workflow name to enter the DAG view page to view the task execution status, as shown in the figure below.
+ <p align="center">
+ <img src="/img/instance-runs-en.png" width="80%" />
+ </p>
+
+#### 2.4.2 View task log
+
+- Enter the workflow instance page, click the workflow name, enter the DAG view page, double-click the task node, as shown in the following figure:
+ <p align="center">
+ <img src="/img/instanceViewLog-en.png" width="80%" />
+ </p>
+- Click "View Log", a log pop-up box will pop up, as shown in the figure below, the task log can also be viewed on the task instance page, refer to [Task View Log](#taskLog)。
+ <p align="center">
+ <img src="/img/task-log-en.png" width="80%" />
+ </p>
+
+#### 2.4.3 View task history
+
+- Click Project Management -> Workflow -> Workflow Instance to enter the workflow instance page, and click the workflow name to enter the workflow DAG page;
+- Double-click the task node, as shown in the figure below, click "View History" to jump to the task instance page, and display a list of task instances running by the workflow instance
+ <p align="center">
+ <img src="/img/task_history_en.png" width="80%" />
+ </p>
+
+#### 2.4.4 View operating parameters
+
+- Click Project Management -> Workflow -> Workflow Instance to enter the workflow instance page, and click the workflow name to enter the workflow DAG page;
+- Click the icon in the upper left corner <img src="/img/run_params_button.png" width="35"/>,View the startup parameters of the workflow instance; click the icon <img src="/img/global_param.png" width="35"/>,View the global and local parameters of the workflow instance, as shown in the following figure:
+ <p align="center">
+ <img src="/img/run_params_en.png" width="80%" />
+ </p>
+
+#### 2.4.4 Workflow instance operation function
+
+Click Project Management -> Workflow -> Workflow Instance to enter the Workflow Instance page, as shown in the figure below:
+
+ <p align="center">
+ <img src="/img/instance-list-en.png" width="80%" />
+ </p>
+
+- **Edit:** Only terminated processes can be edited. Click the "Edit" button or the name of the workflow instance to enter the DAG edit page. After edit, click the "Save" button to pop up the Save DAG pop-up box, as shown in the figure below. In the pop-up box, check "Whether to update to workflow definition" and save After that, the workflow definition will be updated; if it is not checked, the workflow definition will not be updated.
+ <p align="center">
+ <img src="/img/editDag-en.png" width="80%" />
+ </p>
+- **Rerun:** Re-execute the terminated process.
+- **Recovery failed:** For failed processes, you can perform recovery operations, starting from the failed node.
+- **Stop:** To **stop** the running process, the background will first `kill`worker process, and then execute `kill -9` operation
+- **Pause:** Perform a **pause** operation on the running process, the system status will change to **waiting for execution**, it will wait for the end of the task being executed, and pause the next task to be executed.
+- **Resume pause:** To resume the paused process, start running directly from the **paused node**
+- **Delete:** Delete the workflow instance and the task instance under the workflow instance
+- **Gantt chart:** The vertical axis of the Gantt chart is the topological sorting of task instances under a certain workflow instance, and the horizontal axis is the running time of the task instances, as shown in the figure:
+ <p align="center">
+ <img src="/img/gantt-en.png" width="80%" />
+ </p>
+
+#### 2.5 Task instance
+
+- Click Project Management -> Workflow -> Task Instance to enter the task instance page, as shown in the figure below, click the name of the workflow instance, you can jump to the workflow instance DAG chart to view the task status.
+ <p align="center">
+ <img src="/img/task-list-en.png" width="80%" />
+ </p>
+
+- <span id=taskLog>View log:</span>Click the "view log" button in the operation column to view the log of task execution.
+ <p align="center">
+ <img src="/img/task-log2-en.png" width="80%" />
+ </p>
+
+### 3. Resource Center
+
+#### 3.1 hdfs resource configuration
+
+- Upload resource files and udf functions, all uploaded files and resources will be stored on hdfs, so the following configuration items are required:
+
+```
+
+conf/common/common.properties
+ # Users who have permission to create directories under the HDFS root path
+ hdfs.root.user=hdfs
+ # data base dir, resource file will store to this hadoop hdfs path, self configuration, please make sure the directory exists on hdfs and have read write permissions。"/escheduler" is recommended
+ data.store2hdfs.basepath=/dolphinscheduler
+ # resource upload startup type : HDFS,S3,NONE
+ res.upload.startup.type=HDFS
+ # whether kerberos starts
+ hadoop.security.authentication.startup.state=false
+ # java.security.krb5.conf path
+ java.security.krb5.conf.path=/opt/krb5.conf
+ # loginUserFromKeytab user
+ login.user.keytab.username=hdfs-mycluster@ESZ.COM
+ # loginUserFromKeytab path
+ login.user.keytab.path=/opt/hdfs.headless.keytab
+
+conf/common/hadoop.properties
+ # ha or single namenode,If namenode ha needs to copy core-site.xml and hdfs-site.xml
+ # to the conf directory,support s3,for example : s3a://dolphinscheduler
+ fs.defaultFS=hdfs://mycluster:8020
+ #resourcemanager ha note this need ips , this empty if single
+ yarn.resourcemanager.ha.rm.ids=192.168.xx.xx,192.168.xx.xx
+ # If it is a single resourcemanager, you only need to configure one host name. If it is resourcemanager HA, the default configuration is fine
+ yarn.application.status.address=http://xxxx:8088/ws/v1/cluster/apps/%s
+
+```
+
+- Only one address needs to be configured for yarn.resourcemanager.ha.rm.ids and yarn.application.status.address, and the other address is empty.
+- You need to copy core-site.xml and hdfs-site.xml from the conf directory of the Hadoop cluster to the conf directory of the dolphinscheduler project, and restart the api-server service.
+
+#### 3.2 File management
+
+> It is the management of various resource files, including creating basic txt/log/sh/conf/py/java and other files, uploading jar packages and other types of files, and can do edit, rename, download, delete and other operations.
+
+ <p align="center">
+ <img src="/img/file-manage-en.png" width="80%" />
+ </p>
+
+- Create a file
+ > The file format supports the following types: txt, log, sh, conf, cfg, py, java, sql, xml, hql, properties
+
+<p align="center">
+ <img src="/img/file_create_en.png" width="80%" />
+ </p>
+
+- upload files
+
+> Upload file: Click the "Upload File" button to upload, drag the file to the upload area, the file name will be automatically completed with the uploaded file name
+
+<p align="center">
+ <img src="/img/file-upload-en.png" width="80%" />
+ </p>
+
+- File View
+
+> For the file types that can be viewed, click the file name to view the file details
+
+<p align="center">
+ <img src="/img/file_detail_en.png" width="80%" />
+ </p>
+
+- download file
+
+> Click the "Download" button in the file list to download the file or click the "Download" button in the upper right corner of the file details to download the file
+
+- File rename
+
+<p align="center">
+ <img src="/img/file_rename_en.png" width="80%" />
+ </p>
+
+- delete
+ > File list -> Click the "Delete" button to delete the specified file
+
+#### 3.3 UDF management
+
+#### 3.3.1 Resource management
+
+> The resource management and file management functions are similar. The difference is that the resource management is the uploaded UDF function, and the file management uploads the user program, script and configuration file.
+> Operation function: rename, download, delete.
+
+- Upload udf resources
+ > Same as uploading files.
+
+#### 3.3.2 Function management
+
+- Create UDF function
+ > Click "Create UDF Function", enter the udf function parameters, select the udf resource, and click "Submit" to create the udf function.
+
+> Currently only supports temporary UDF functions of HIVE
+
+- UDF function name: the name when the UDF function is entered
+- Package name Class name: Enter the full path of the UDF function
+- UDF resource: Set the resource file corresponding to the created UDF
+
+<p align="center">
+ <img src="/img/udf_edit_en.png" width="80%" />
+ </p>
+
+### 4. Create data source
+
+> Data source center supports MySQL, POSTGRESQL, HIVE/IMPALA, SPARK, CLICKHOUSE, ORACLE, SQLSERVER and other data sources
+
+#### 4.1 Create/Edit MySQL data source
+
+- Click "Data Source Center -> Create Data Source" to create different types of data sources according to requirements.
+
+- Data source: select MYSQL
+- Data source name: enter the name of the data source
+- Description: Enter a description of the data source
+- IP hostname: enter the IP to connect to MySQL
+- Port: Enter the port to connect to MySQL
+- Username: Set the username for connecting to MySQL
+- Password: Set the password for connecting to MySQL
+- Database name: Enter the name of the database connected to MySQL
+- Jdbc connection parameters: parameter settings for MySQL connection, filled in in JSON form
+
+<p align="center">
+ <img src="/img/mysql-en.png" width="80%" />
+ </p>
+
+> Click "Test Connection" to test whether the data source can be successfully connected.
+
+#### 4.2 Create/Edit POSTGRESQL data source
+
+- Data source: select POSTGRESQL
+- Data source name: enter the name of the data source
+- Description: Enter a description of the data source
+- IP/Host Name: Enter the IP to connect to POSTGRESQL
+- Port: Enter the port to connect to POSTGRESQL
+- Username: Set the username for connecting to POSTGRESQL
+- Password: Set the password for connecting to POSTGRESQL
+- Database name: Enter the name of the database connected to POSTGRESQL
+- Jdbc connection parameters: parameter settings for POSTGRESQL connection, filled in in JSON form
+
+<p align="center">
+ <img src="/img/postgresql-en.png" width="80%" />
+ </p>
+
+#### 4.3 Create/Edit HIVE data source
+
+1.Use HiveServer2 to connect
+
+ <p align="center">
+ <img src="/img/hive-en.png" width="80%" />
+ </p>
+
+- Data source: select HIVE
+- Data source name: enter the name of the data source
+- Description: Enter a description of the data source
+- IP/Host Name: Enter the IP connected to HIVE
+- Port: Enter the port connected to HIVE
+- Username: Set the username for connecting to HIVE
+- Password: Set the password for connecting to HIVE
+- Database name: Enter the name of the database connected to HIVE
+- Jdbc connection parameters: parameter settings for HIVE connection, filled in in JSON form
+
+ 2.Use HiveServer2 HA Zookeeper to connect
+
+ <p align="center">
+ <img src="/img/hive1-en.png" width="80%" />
+ </p>
+
+Note: If you enable **kerberos**, you need to fill in **Principal**
+
+<p align="center">
+ <img src="/img/hive-en.png" width="80%" />
+ </p>
+
+#### 4.4 Create/Edit Spark data source
+
+<p align="center">
+ <img src="/img/spark-en.png" width="80%" />
+ </p>
+
+- Data source: select Spark
+- Data source name: enter the name of the data source
+- Description: Enter a description of the data source
+- IP/Hostname: Enter the IP connected to Spark
+- Port: Enter the port connected to Spark
+- Username: Set the username for connecting to Spark
+- Password: Set the password for connecting to Spark
+- Database name: Enter the name of the database connected to Spark
+- Jdbc connection parameters: parameter settings for Spark connection, filled in in JSON form
+
+### 5. Security Center (Permission System)
+
+ * Only the administrator account in the security center has the authority to operate. It has functions such as queue management, tenant management, user management, alarm group management, worker group management, token management, etc. In the user management module, resources, data sources, projects, etc. Authorization
+ * Administrator login, default user name and password: admin/dolphinscheduler123
+
+#### 5.1 Create queue
+
+- Queue is used when the "queue" parameter is needed to execute programs such as spark and mapreduce.
+- The administrator enters the Security Center->Queue Management page and clicks the "Create Queue" button to create a queue.
+<p align="center">
+ <img src="/img/create-queue-en.png" width="80%" />
+ </p>
+
+#### 5.2 Add tenant
+
+- The tenant corresponds to the Linux user, which is used by the worker to submit the job. If Linux does not have this user, the worker will create this user when executing the script.
+- Tenant Code: **Tenant Code is the only user on Linux and cannot be repeated**
+- The administrator enters the Security Center->Tenant Management page and clicks the "Create Tenant" button to create a tenant.
+
+ <p align="center">
+ <img src="/img/addtenant-en.png" width="80%" />
+ </p>
+
+#### 5.3 Create normal user
+
+- Users are divided into **administrator users** and **normal users**
+
+ - The administrator has authorization and user management authority, but does not have the authority to create project and workflow definition operations.
+ - Ordinary users can create projects and create, edit, and execute workflow definitions.
+ - Note: If the user switches tenants, all resources under the tenant where the user belongs will be copied to the new tenant that is switched.
+
+- The administrator enters the Security Center -> User Management page and clicks the "Create User" button to create a user.
+<p align="center">
+ <img src="/img/user-en.png" width="80%" />
+ </p>
+
+> **Edit user information**
+
+- The administrator enters the Security Center->User Management page and clicks the "Edit" button to edit user information.
+- After an ordinary user logs in, click the user information in the user name drop-down box to enter the user information page, and click the "Edit" button to edit the user information.
+
+> **Modify user password**
+
+- The administrator enters the Security Center->User Management page and clicks the "Edit" button. When editing user information, enter the new password to modify the user password.
+- After a normal user logs in, click the user information in the user name drop-down box to enter the password modification page, enter the password and confirm the password and click the "Edit" button, then the password modification is successful.
+
+#### 5.4 Create alarm group
+
+- The alarm group is a parameter set at startup. After the process ends, the status of the process and other information will be sent to the alarm group in the form of email.
+
+* The administrator enters the Security Center -> Alarm Group Management page and clicks the "Create Alarm Group" button to create an alarm group.
+
+ <p align="center">
+ <img src="/img/mail-en.png" width="80%" />
+
+#### 5.5 Token management
+
+> Since the back-end interface has login check, token management provides a way to perform various operations on the system by calling the interface.
+
+- The administrator enters the Security Center -> Token Management page, clicks the "Create Token" button, selects the expiration time and user, clicks the "Generate Token" button, and clicks the "Submit" button, then the selected user's token is created successfully.
+
+ <p align="center">
+ <img src="/img/create-token-en.png" width="80%" />
+ </p>
+
+ - After an ordinary user logs in, click the user information in the user name drop-down box, enter the token management page, select the expiration time, click the "generate token" button, and click the "submit" button, then the user creates a token successfully.
+ - Call example:
+
+```
+Token call example
+ /**
+ * test token
+ */
+ public void doPOSTParam()throws Exception{
+ // create HttpClient
+ CloseableHttpClient httpclient = HttpClients.createDefault();
+
+ // create http post request
+ HttpPost httpPost = new HttpPost("http://127.0.0.1:12345/escheduler/projects/create");
+ httpPost.setHeader("token", "123");
+ // set parameters
+ List<NameValuePair> parameters = new ArrayList<NameValuePair>();
+ parameters.add(new BasicNameValuePair("projectName", "qzw"));
+ parameters.add(new BasicNameValuePair("desc", "qzw"));
+ UrlEncodedFormEntity formEntity = new UrlEncodedFormEntity(parameters);
+ httpPost.setEntity(formEntity);
+ CloseableHttpResponse response = null;
+ try {
+ // execute
+ response = httpclient.execute(httpPost);
+ // response status code 200
+ if (response.getStatusLine().getStatusCode() == 200) {
+ String content = EntityUtils.toString(response.getEntity(), "UTF-8");
+ System.out.println(content);
+ }
+ } finally {
+ if (response != null) {
+ response.close();
+ }
+ httpclient.close();
+ }
+ }
+```
+
+#### 5.6 Granted permission
+
+ * Granted permissions include project permissions, resource permissions, data source permissions, UDF function permissions.
+ * The administrator can authorize the projects, resources, data sources and UDF functions not created by ordinary users. Because the authorization methods for projects, resources, data sources and UDF functions are the same, we take project authorization as an example.
+ * Note: For projects created by users themselves, the user has all permissions. The project list and the selected project list will not be displayed.
+
+- The administrator enters the Security Center -> User Management page and clicks the "Authorize" button of the user who needs to be authorized, as shown in the figure below:
+ <p align="center">
+ <img src="/img/auth-en.png" width="80%" />
+</p>
+
+- Select the project to authorize the project.
+
+<p align="center">
+ <img src="/img/authproject-en.png" width="80%" />
+ </p>
+
+- Resources, data sources, and UDF function authorization are the same as project authorization.
+
+### 6. monitoring Center
+
+#### 6.1 Service management
+
+- Service management is mainly to monitor and display the health status and basic information of each service in the system
+
+#### 6.1.1 master monitoring
+
+- Mainly related to master information.
+<p align="center">
+ <img src="/img/master-jk-en.png" width="80%" />
+ </p>
+
+#### 6.1.2 worker monitoring
+
+- Mainly related to worker information.
+
+<p align="center">
+ <img src="/img/worker-jk-en.png" width="80%" />
+ </p>
+
+#### 6.1.3 Zookeeper monitoring
+
+- Mainly related configuration information of each worker and master in zookpeeper.
+
+<p align="center">
+ <img src="/img/zookeeper-monitor-en.png" width="80%" />
+ </p>
+
+#### 6.1.4 DB monitoring
+
+- Mainly the health of the DB
+
+<p align="center">
+ <img src="/img/mysql-jk-en.png" width="80%" />
+ </p>
+
+#### 6.2 Statistics management
+
+<p align="center">
+ <img src="/img/statistics-en.png" width="80%" />
+ </p>
+
+- Number of commands to be executed: statistics on the t_ds_command table
+- The number of failed commands: statistics on the t_ds_error_command table
+- Number of tasks to run: Count the data of task_queue in Zookeeper
+- Number of tasks to be killed: Count the data of task_kill in Zookeeper
+
+### 7. <span id=TaskParamers>Task node type and parameter settings</span>
+
+#### 7.1 Shell node
+
+> Shell node, when the worker is executed, a temporary shell script is generated, and the linux user with the same name as the tenant executes the script.
+
+- Click Project Management-Project Name-Workflow Definition, and click the "Create Workflow" button to enter the DAG editing page.
+- Drag <img src="/img/shell.png" width="35"/> from the toolbar to the drawing board, as shown in the figure below:
+
+ <p align="center">
+ <img src="/img/shell-en.png" width="80%" />
+ </p>
+
+- Node name: The node name in a workflow definition is unique.
+- Run flag: Identifies whether this node can be scheduled normally, if it does not need to be executed, you can turn on the prohibition switch.
+- Descriptive information: describe the function of the node.
+- Task priority: When the number of worker threads is insufficient, they are executed in order from high to low, and when the priority is the same, they are executed according to the first-in first-out principle.
+- Worker grouping: Tasks are assigned to the machines of the worker group to execute. If Default is selected, a worker machine will be randomly selected for execution.
+- Number of failed retry attempts: The number of times the task failed to be resubmitted. It supports drop-down and hand-filling.
+- Failed retry interval: The time interval for resubmitting the task after a failed task. It supports drop-down and hand-filling.
+- Timeout alarm: Check the timeout alarm and timeout failure. When the task exceeds the "timeout period", an alarm email will be sent and the task execution will fail.
+- Script: SHELL program developed by users.
+- Resource: Refers to the list of resource files that need to be called in the script, and the files uploaded or created by the resource center-file management.
+- User-defined parameters: It is a user-defined parameter that is part of SHELL, which will replace the content with \${variable} in the script.
+
+#### 7.2 Sub-process node
+
+- The sub-process node is to execute a certain external workflow definition as a task node.
+ > Drag the  task node in the toolbar to the drawing board, as shown in the following figure:
+
+<p align="center">
+ <img src="/img/sub-process-en.png" width="80%" />
+ </p>
+
+- Node name: The node name in a workflow definition is unique
+- Run flag: identify whether this node can be scheduled normally
+- Descriptive information: describe the function of the node
+- Timeout alarm: Check the timeout alarm and timeout failure. When the task exceeds the "timeout period", an alarm email will be sent and the task execution will fail.
+- Sub-node: It is the workflow definition of the selected sub-process. Enter the sub-node in the upper right corner to jump to the workflow definition of the selected sub-process
+
+#### 7.3 DEPENDENT node
+
+- Dependent nodes are **dependency check nodes**. For example, process A depends on the successful execution of process B yesterday, and the dependent node will check whether process B has a successful execution yesterday.
+
+> Drag the  task node in the toolbar to the drawing board, as shown in the following figure:
+
+<p align="center">
+ <img src="/img/dependent-nodes-en.png" width="80%" />
+ </p>
+
+> The dependent node provides a logical judgment function, such as checking whether the B process was successful yesterday, or whether the C process was executed successfully.
+
+ <p align="center">
+ <img src="/img/depend-node-en.png" width="80%" />
+ </p>
+
+> For example, process A is a weekly report task, processes B and C are daily tasks, and task A requires tasks B and C to be successfully executed every day of the last week, as shown in the figure:
+
+ <p align="center">
+ <img src="/img/depend-node1-en.png" width="80%" />
+ </p>
+
+> If the weekly report A also needs to be executed successfully last Tuesday:
+
+ <p align="center">
+ <img src="/img/depend-node3-en.png" width="80%" />
+ </p>
+
+#### 7.4 Stored procedure node
+
+- According to the selected data source, execute the stored procedure.
+ > Drag in the toolbarThe task node to the drawing board, as shown in the following figure:
+
+<p align="center">
+ <img src="/img/procedure-en.png" width="80%" />
+ </p>
+
+- Data source: The data source type of the stored procedure supports MySQL and POSTGRESQL, select the corresponding data source
+- Method: is the method name of the stored procedure
+- Custom parameters: The custom parameter types of the stored procedure support IN and OUT, and the data types support nine data types: VARCHAR, INTEGER, LONG, FLOAT, DOUBLE, DATE, TIME, TIMESTAMP, and BOOLEAN
+
+#### 7.5 SQL node
+
+- Drag in the toolbarTask node into the drawing board
+- Non-query SQL function: edit non-query SQL task information, select non-query for sql type, as shown in the figure below:
+ <p align="center">
+ <img src="/img/sql-en.png" width="80%" />
+</p>
+
+- Query SQL function: Edit and query SQL task information, sql type selection query, select form or attachment to send mail to the specified recipient, as shown in the figure below.
+
+<p align="center">
+ <img src="/img/sql-node-en.png" width="80%" />
+ </p>
+
+- Data source: select the corresponding data source
+- sql type: supports query and non-query. The query is a select type query, which is returned with a result set. You can specify three templates for email notification as form, attachment or form attachment. Non-queries are returned without a result set, and are for three types of operations: update, delete, and insert.
+- sql parameter: the input parameter format is key1=value1;key2=value2...
+- sql statement: SQL statement
+- UDF function: For data sources of type HIVE, you can refer to UDF functions created in the resource center. UDF functions are not supported for other types of data sources.
+- Custom parameters: SQL task type, and stored procedure is a custom parameter order to set values for the method. The custom parameter type and data type are the same as the stored procedure task type. The difference is that the SQL task type custom parameter will replace the \${variable} in the SQL statement.
+- Pre-sql: Pre-sql is executed before the sql statement.
+- Post-sql: Post-sql is executed after the sql statement.
+
+#### 7.6 SPARK node
+
+- Through the SPARK node, you can directly execute the SPARK program. For the spark node, the worker will use the `spark-submit` method to submit tasks
+
+> Drag in the toolbarThe task node to the drawing board, as shown in the following figure:
+
+<p align="center">
+ <img src="/img/spark-submit-en.png" width="80%" />
+ </p>
+
+- Program type: supports JAVA, Scala and Python three languages
+- The class of the main function: is the full path of the Spark program’s entry Main Class
+- Main jar package: Spark jar package
+- Deployment mode: support three modes of yarn-cluster, yarn-client and local
+- Driver core number: You can set the number of Driver cores and the number of memory
+- Number of Executors: You can set the number of Executors, the number of Executor memory, and the number of Executor cores
+- Command line parameters: Set the input parameters of the Spark program and support the substitution of custom parameter variables.
+- Other parameters: support --jars, --files, --archives, --conf format
+- Resource: If the resource file is referenced in other parameters, you need to select and specify in the resource
+- User-defined parameter: It is a user-defined parameter of the MR part, which will replace the content with \${variable} in the script
+
+Note: JAVA and Scala are only used for identification, there is no difference, if it is Spark developed by Python, there is no main function class, and the others are the same
+
+#### 7.7 MapReduce(MR) node
+
+- Using the MR node, you can directly execute the MR program. For the mr node, the worker will use the `hadoop jar` method to submit tasks
+
+> Drag the  task node in the toolbar to the drawing board, as shown in the following figure:
+
+1. JAVA program
+
+ <p align="center">
+ <img src="/img/mr_java_en.png" width="80%" />
+ </p>
+
+- The class of the main function: is the full path of the Main Class, the entry point of the MR program
+- Program type: select JAVA language
+- Main jar package: is the MR jar package
+- Command line parameters: set the input parameters of the MR program and support the substitution of custom parameter variables
+- Other parameters: support -D, -files, -libjars, -archives format
+- Resource: If the resource file is referenced in other parameters, you need to select and specify in the resource
+- User-defined parameter: It is a user-defined parameter of the MR part, which will replace the content with \${variable} in the script
+
+2. Python program
+
+<p align="center">
+ <img src="/img/mr_edit_en.png" width="80%" />
+ </p>
+
+- Program type: select Python language
+- Main jar package: is the Python jar package for running MR
+- Other parameters: support -D, -mapper, -reducer, -input -output format, here you can set the input of user-defined parameters, such as:
+- -mapper "mapper.py 1" -file mapper.py -reducer reducer.py -file reducer.py –input /journey/words.txt -output /journey/out/mr/\${currentTimeMillis}
+- The mapper.py 1 after -mapper is two parameters, the first parameter is mapper.py, and the second parameter is 1
+- Resource: If the resource file is referenced in other parameters, you need to select and specify in the resource
+- User-defined parameter: It is a user-defined parameter of the MR part, which will replace the content with \${variable} in the script
+
+#### 7.8 Python Node
+
+- Using python nodes, you can directly execute python scripts. For python nodes, workers will use `python **` to submit tasks.
+
+> Drag in the toolbarThe task node to the drawing board, as shown in the following figure:
+
+<p align="center">
+ <img src="/img/python-en.png" width="80%" />
+ </p>
+
+- Script: Python program developed by the user
+- Resources: refers to the list of resource files that need to be called in the script
+- User-defined parameter: It is a local user-defined parameter of Python, which will replace the content with \${variable} in the script
+
+#### 7.9 Flink Node
+
+- Drag in the toolbar<img src="/img/flink.png" width="35"/>The task node to the drawing board, as shown in the following figure:
+
+<p align="center">
+ <img src="/img/flink-en.png" width="80%" />
+</p>
+
+- Program type: supports JAVA, Scala and Python three languages
+- The class of the main function: is the full path of the Main Class, the entry point of the Flink program
+- Main jar package: is the Flink jar package
+- Deployment mode: support three modes of cluster and local
+- Number of slots: You can set the number of slots
+- Number of taskManage: You can set the number of taskManage
+- JobManager memory number: You can set the jobManager memory number
+- TaskManager memory number: You can set the taskManager memory number
+- Command line parameters: Set the input parameters of the Spark program and support the substitution of custom parameter variables.
+- Other parameters: support --jars, --files, --archives, --conf format
+- Resource: If the resource file is referenced in other parameters, you need to select and specify in the resource
+- Custom parameter: It is a local user-defined parameter of Flink, which will replace the content with \${variable} in the script
+
+Note: JAVA and Scala are only used for identification, there is no difference, if it is Flink developed by Python, there is no class of the main function, the others are the same
+
+#### 7.10 http Node
+
+- Drag in the toolbar<img src="/img/http.png" width="35"/>The task node to the drawing board, as shown in the following figure:
+
+<p align="center">
+ <img src="/img/http-en.png" width="80%" />
+ </p>
+
+- Node name: The node name in a workflow definition is unique.
+- Run flag: Identifies whether this node can be scheduled normally, if it does not need to be executed, you can turn on the prohibition switch.
+- Descriptive information: describe the function of the node.
+- Task priority: When the number of worker threads is insufficient, they are executed in order from high to low, and when the priority is the same, they are executed according to the first-in first-out principle.
+- Worker grouping: Tasks are assigned to the machines of the worker group to execute. If Default is selected, a worker machine will be randomly selected for execution.
+- Number of failed retry attempts: The number of times the task failed to be resubmitted. It supports drop-down and hand-filling.
+- Failed retry interval: The time interval for resubmitting the task after a failed task. It supports drop-down and hand-filling.
+- Timeout alarm: Check the timeout alarm and timeout failure. When the task exceeds the "timeout period", an alarm email will be sent and the task execution will fail.
+- Request address: http request URL.
+- Request type: support GET, POSt, HEAD, PUT, DELETE.
+- Request parameters: Support Parameter, Body, Headers.
+- Verification conditions: support default response code, custom response code, content included, content not included.
+- Verification content: When the verification condition selects a custom response code, the content contains, and the content does not contain, the verification content is required.
+- Custom parameter: It is a user-defined parameter of http part, which will replace the content with \${variable} in the script.
Review comment:
```suggestion
- Custom parameter: It is a local user-defined parameter of http, which will replace the content with \${variable} in the script.
```
##########
File path: docs/en-us/1.3.2/user_doc/system-manual.md
##########
@@ -0,0 +1,886 @@
+# System User Manual
+
+## Get started quickly
+
+> Please refer to [Quick Start](quick-start.html)
+
+## Operation guide
+
+### 1. Home
+
+The home page contains task status statistics, process status statistics, and workflow definition statistics for all projects of the user.
+
+<p align="center">
+<img src="/img/home_en.png" width="80%" />
+</p>
+
+### 2. Project management
+
+#### 2.1 Create project
+
+- Click "Project Management" to enter the project management page, click the "Create Project" button, enter the project name, project description, and click "Submit" to create a new project.
+
+ <p align="center">
+ <img src="/img/create_project_en1.png" width="80%" />
+ </p>
+
+#### 2.2 Project home
+
+- Click the project name link on the project management page to enter the project home page, as shown in the figure below, the project home page contains the task status statistics, process status statistics, and workflow definition statistics of the project.
+ <p align="center">
+ <img src="/img/project_home_en.png" width="80%" />
+ </p>
+
+- Task status statistics: within the specified time range, count the number of task instances as successful submission, running, ready to pause, pause, ready to stop, stop, failure, success, fault tolerance, kill, and waiting threads
+- Process status statistics: within the specified time range, count the number of the status of the workflow instance as submission success, running, ready to pause, pause, ready to stop, stop, failure, success, fault tolerance, kill, and waiting threads
+- Workflow definition statistics: Count the workflow definitions created by this user and the workflow definitions granted to this user by the administrator
+
+#### 2.3 Workflow definition
+
+#### <span id=creatDag>2.3.1 Create workflow definition</span>
+
+- Click Project Management -> Workflow -> Workflow Definition to enter the workflow definition page, and click the "Create Workflow" button to enter the **workflow DAG edit** page, as shown in the following figure:
+ <p align="center">
+ <img src="/img/dag5.png" width="80%" />
+ </p>
+- Drag in the toolbar <img src="/img/shell.png" width="35"/> Add a Shell task to the drawing board, as shown in the figure below:
+ <p align="center">
+ <img src="/img/shell-en.png" width="80%" />
+ </p>
+- **Add parameter settings for this shell task:**
+
+1. Fill in the "Node Name", "Description", and "Script" fields;
+2. Check “Normal” for “Run Flag”. If “Prohibit Execution” is checked, the task will not be executed when the workflow runs;
+3. Select "Task Priority": When the number of worker threads is insufficient, high-level tasks will be executed first in the execution queue, and tasks with the same priority will be executed in the order of first in, first out;
+4. Timeout alarm (optional): Check the timeout alarm, timeout failure, and fill in the "timeout period". When the task execution time exceeds **timeout period**, an alert email will be sent and the task timeout fails;
+5. Resources (optional). Resource files are files created or uploaded on the Resource Center -> File Management page. For example, the file name is `test.sh`, and the command to call the resource in the script is `sh test.sh`;
+6. Custom parameters (optional), refer to [Custom Parameters](#UserDefinedParameters);
+7. Click the "Confirm Add" button to save the task settings.
+
+- **Increase the order of task execution:** Click the icon in the upper right corner <img src="/img/line.png" width="35"/> to connect the task; as shown in the figure below, task 2 and task 3 are executed in parallel, When task 1 finished execute, tasks 2 and 3 will be executed simultaneously.
+
+ <p align="center">
+ <img src="/img/dag6.png" width="80%" />
+ </p>
+
+- **Delete dependencies:** Click the "arrow" icon in the upper right corner <img src="/img/arrow.png" width="35"/>, select the connection line, and click the "Delete" icon in the upper right corner <img src= "/img/delete.png" width="35"/>, delete dependencies between tasks.
+ <p align="center">
+ <img src="/img/dag7.png" width="80%" />
+ </p>
+
+- **Save workflow definition:** Click the "Save" button, and the "Set DAG chart name" pop-up box will pop up, as shown in the figure below. Enter the workflow definition name, workflow definition description, and set global parameters (optional, refer to [ Custom parameters](#UserDefinedParameters)), click the "Add" button, and the workflow definition is created successfully.
+ <p align="center">
+ <img src="/img/dag8.png" width="80%" />
+ </p>
+> For other types of tasks, please refer to [Task Node Type and Parameter Settings](#TaskParamers).
+
+#### 2.3.2 Workflow definition operation function
+
+Click Project Management -> Workflow -> Workflow Definition to enter the workflow definition page, as shown below:
+
+<p align="center">
+<img src="/img/work_list_en.png" width="80%" />
+</p>
+The operation functions of the workflow definition list are as follows:
+
+- **Edit:** Only "offline" workflow definitions can be edited. Workflow DAG editing is the same as [Create Workflow Definition](#creatDag).
+- **Online:** When the workflow status is "Offline", used to online workflow. Only the workflow in the "Online" state can run, but cannot be edited.
+- **Offline:** When the workflow status is "Online", used to offline workflow. Only the workflow in the "Offline" state can be edited, but not run.
+- **Run:** Only workflow in the online state can run. See [2.3.3 Run Workflow](#runWorkflow) for the operation steps
+- **Timing:** Timing can only be set in online workflows, and the system automatically schedules the workflow to run on a regular basis. The status after creating a timing is "offline", and the timing must be online on the timing management page to take effect. See [2.3.4 Workflow Timing](#creatTiming) for timing operation steps.
+- **Timing Management:** The timing management page can be edited, online/offline, and deleted.
+- **Delete:** Delete the workflow definition.
+- **Download:** Download workflow definition to local.
+- **Tree Diagram:** Display the task node type and task status in a tree structure, as shown in the figure below:
+ <p align="center">
+ <img src="/img/tree_en.png" width="80%" />
+ </p>
+
+#### <span id=runWorkflow>2.3.3 Run the workflow</span>
+
+- Click Project Management -> Workflow -> Workflow Definition to enter the workflow definition page, as shown in the figure below, click the "Go Online" button <img src="/img/online.png" width="35"/>,Go online workflow.
+ <p align="center">
+ <img src="/img/work_list_en.png" width="80%" />
+ </p>
+
+- Click the "Run" button to pop up the startup parameter setting pop-up box, as shown in the figure below, set the startup parameters, click the "Run" button in the pop-up box, the workflow starts running, and the workflow instance page generates a workflow instance.
+ <p align="center">
+ <img src="/img/run_work_en.png" width="80%" />
+ </p>
+ <span id=runParamers>Description of workflow operating parameters:</span>
+
+ * Failure strategy: When a task node fails to execute, other parallel task nodes need to execute the strategy. "Continue" means: after a certain task fails, other task nodes execute normally; "End" means: terminate all tasks being executed, and terminate the entire process.
+ * Notification strategy: When the process is over, the process execution information notification email is sent according to the process status, including any status is not sent, successful sent, failed sent, successful or failed sent.
+ * Process priority: The priority of process operation, divided into five levels: highest (HIGHEST), high (HIGH), medium (MEDIUM), low (LOW), and lowest (LOWEST). When the number of master threads is insufficient, high-level processes will be executed first in the execution queue, and processes with the same priority will be executed in a first-in first-out order.
+ * Worker group: The process can only be executed in the specified worker machine group. The default is Default, which can be executed on any worker.
+ * Notification group: select notification strategy||timeout alarm||when fault tolerance occurs, process information or email will be sent to all members in the notification group.
+ * Recipient: Select notification policy||Timeout alarm||When fault tolerance occurs, process information or alarm email will be sent to the recipient list.
+ * Cc: Select the notification strategy||Timeout alarm||When fault tolerance occurs, the process information or warning email will be copied to the CC list.
+ * Complement: Two modes including serial complement and parallel complement. Serial complement: within the specified time range, the complement is executed sequentially from the start date to the end date, and only one process instance is generated; parallel complement: within the specified time range, multiple days are complemented at the same time to generate N process instances.
+ * For example, you need to fill in the data from May 1 to May 10.
+
+ <p align="center">
+ <img src="/img/complement_en1.png" width="80%" />
+ </p>
+
+ > Serial mode: The complement is executed sequentially from May 1 to May 10, and a process instance is generated on the process instance page;
+
+ > Parallel mode: The tasks from May 1 to may 10 are executed simultaneously, and 10 process instances are generated on the process instance page.
+
+#### <span id=creatTiming>2.3.4 Workflow timing</span>
+
+- Create timing: Click Project Management->Workflow->Workflow Definition, enter the workflow definition page, go online the workflow, click the "timing" button <img src="/img/timing.png" width="35"/> ,The timing parameter setting dialog box pops up, as shown in the figure below:
+ <p align="center">
+ <img src="/img/time_schedule_en.png" width="80%" />
+ </p>
+- Choose the start and end time. In the start and end time range, the workflow is run at regular intervals; not in the start and end time range, no more regular workflow instances are generated.
+- Add a timing that is executed once every day at 5 AM, as shown in the following figure:
+ <p align="center">
+ <img src="/img/timer-en.png" width="80%" />
+ </p>
+- Failure strategy, notification strategy, process priority, worker group, notification group, recipient, and CC are the same as [workflow running parameters](#runParamers).
+- Click the "Create" button to create the timing successfully. At this time, the timing status is "**Offline**" and the timing needs to be **Online** to take effect.
+- Timing online: Click the "timing management" button <img src="/img/timeManagement.png" width="35"/>, enter the timing management page, click the "online" button, the timing status will change to "online", as shown in the below figure, the workflow takes effect regularly.
+ <p align="center">
+ <img src="/img/time-manage-list-en.png" width="80%" />
+ </p>
+
+#### 2.3.5 Import workflow
+
+Click Project Management -> Workflow -> Workflow Definition to enter the workflow definition page, click the "Import Workflow" button to import the local workflow file, the workflow definition list displays the imported workflow, and the status is offline.
+
+#### 2.4 Workflow instance
+
+#### 2.4.1 View workflow instance
+
+- Click Project Management -> Workflow -> Workflow Instance to enter the Workflow Instance page, as shown in the figure below:
+ <p align="center">
+ <img src="/img/instance-list-en.png" width="80%" />
+ </p>
+- Click the workflow name to enter the DAG view page to view the task execution status, as shown in the figure below.
+ <p align="center">
+ <img src="/img/instance-runs-en.png" width="80%" />
+ </p>
+
+#### 2.4.2 View task log
+
+- Enter the workflow instance page, click the workflow name, enter the DAG view page, double-click the task node, as shown in the following figure:
+ <p align="center">
+ <img src="/img/instanceViewLog-en.png" width="80%" />
+ </p>
+- Click "View Log", a log pop-up box will pop up, as shown in the figure below, the task log can also be viewed on the task instance page, refer to [Task View Log](#taskLog)。
+ <p align="center">
+ <img src="/img/task-log-en.png" width="80%" />
+ </p>
+
+#### 2.4.3 View task history
+
+- Click Project Management -> Workflow -> Workflow Instance to enter the workflow instance page, and click the workflow name to enter the workflow DAG page;
+- Double-click the task node, as shown in the figure below, click "View History" to jump to the task instance page, and display a list of task instances running by the workflow instance
+ <p align="center">
+ <img src="/img/task_history_en.png" width="80%" />
+ </p>
+
+#### 2.4.4 View operating parameters
+
+- Click Project Management -> Workflow -> Workflow Instance to enter the workflow instance page, and click the workflow name to enter the workflow DAG page;
+- Click the icon in the upper left corner <img src="/img/run_params_button.png" width="35"/>,View the startup parameters of the workflow instance; click the icon <img src="/img/global_param.png" width="35"/>,View the global and local parameters of the workflow instance, as shown in the following figure:
+ <p align="center">
+ <img src="/img/run_params_en.png" width="80%" />
+ </p>
+
+#### 2.4.4 Workflow instance operation function
+
+Click Project Management -> Workflow -> Workflow Instance to enter the Workflow Instance page, as shown in the figure below:
+
+ <p align="center">
+ <img src="/img/instance-list-en.png" width="80%" />
+ </p>
+
+- **Edit:** Only terminated processes can be edited. Click the "Edit" button or the name of the workflow instance to enter the DAG edit page. After edit, click the "Save" button to pop up the Save DAG pop-up box, as shown in the figure below. In the pop-up box, check "Whether to update to workflow definition" and save After that, the workflow definition will be updated; if it is not checked, the workflow definition will not be updated.
+ <p align="center">
+ <img src="/img/editDag-en.png" width="80%" />
+ </p>
+- **Rerun:** Re-execute the terminated process.
+- **Recovery failed:** For failed processes, you can perform recovery operations, starting from the failed node.
+- **Stop:** To **stop** the running process, the background will first `kill`worker process, and then execute `kill -9` operation
+- **Pause:** Perform a **pause** operation on the running process, the system status will change to **waiting for execution**, it will wait for the end of the task being executed, and pause the next task to be executed.
+- **Resume pause:** To resume the paused process, start running directly from the **paused node**
+- **Delete:** Delete the workflow instance and the task instance under the workflow instance
+- **Gantt chart:** The vertical axis of the Gantt chart is the topological sorting of task instances under a certain workflow instance, and the horizontal axis is the running time of the task instances, as shown in the figure:
+ <p align="center">
+ <img src="/img/gantt-en.png" width="80%" />
+ </p>
+
+#### 2.5 Task instance
+
+- Click Project Management -> Workflow -> Task Instance to enter the task instance page, as shown in the figure below, click the name of the workflow instance, you can jump to the workflow instance DAG chart to view the task status.
+ <p align="center">
+ <img src="/img/task-list-en.png" width="80%" />
+ </p>
+
+- <span id=taskLog>View log:</span>Click the "view log" button in the operation column to view the log of task execution.
+ <p align="center">
+ <img src="/img/task-log2-en.png" width="80%" />
+ </p>
+
+### 3. Resource Center
+
+#### 3.1 hdfs resource configuration
+
+- Upload resource files and udf functions, all uploaded files and resources will be stored on hdfs, so the following configuration items are required:
+
+```
+
+conf/common/common.properties
+ # Users who have permission to create directories under the HDFS root path
+ hdfs.root.user=hdfs
+ # data base dir, resource file will store to this hadoop hdfs path, self configuration, please make sure the directory exists on hdfs and have read write permissions。"/escheduler" is recommended
+ data.store2hdfs.basepath=/dolphinscheduler
+ # resource upload startup type : HDFS,S3,NONE
+ res.upload.startup.type=HDFS
+ # whether kerberos starts
+ hadoop.security.authentication.startup.state=false
+ # java.security.krb5.conf path
+ java.security.krb5.conf.path=/opt/krb5.conf
+ # loginUserFromKeytab user
+ login.user.keytab.username=hdfs-mycluster@ESZ.COM
+ # loginUserFromKeytab path
+ login.user.keytab.path=/opt/hdfs.headless.keytab
+
+conf/common/hadoop.properties
+ # ha or single namenode,If namenode ha needs to copy core-site.xml and hdfs-site.xml
+ # to the conf directory,support s3,for example : s3a://dolphinscheduler
+ fs.defaultFS=hdfs://mycluster:8020
+ #resourcemanager ha note this need ips , this empty if single
+ yarn.resourcemanager.ha.rm.ids=192.168.xx.xx,192.168.xx.xx
+ # If it is a single resourcemanager, you only need to configure one host name. If it is resourcemanager HA, the default configuration is fine
+ yarn.application.status.address=http://xxxx:8088/ws/v1/cluster/apps/%s
+
+```
+
+- Only one address needs to be configured for yarn.resourcemanager.ha.rm.ids and yarn.application.status.address, and the other address is empty.
+- You need to copy core-site.xml and hdfs-site.xml from the conf directory of the Hadoop cluster to the conf directory of the dolphinscheduler project, and restart the api-server service.
+
+#### 3.2 File management
+
+> It is the management of various resource files, including creating basic txt/log/sh/conf/py/java and other files, uploading jar packages and other types of files, and can do edit, rename, download, delete and other operations.
+
+ <p align="center">
+ <img src="/img/file-manage-en.png" width="80%" />
+ </p>
+
+- Create a file
+ > The file format supports the following types: txt, log, sh, conf, cfg, py, java, sql, xml, hql, properties
+
+<p align="center">
+ <img src="/img/file_create_en.png" width="80%" />
+ </p>
+
+- upload files
+
+> Upload file: Click the "Upload File" button to upload, drag the file to the upload area, the file name will be automatically completed with the uploaded file name
+
+<p align="center">
+ <img src="/img/file-upload-en.png" width="80%" />
+ </p>
+
+- File View
+
+> For the file types that can be viewed, click the file name to view the file details
+
+<p align="center">
+ <img src="/img/file_detail_en.png" width="80%" />
+ </p>
+
+- download file
+
+> Click the "Download" button in the file list to download the file or click the "Download" button in the upper right corner of the file details to download the file
+
+- File rename
+
+<p align="center">
+ <img src="/img/file_rename_en.png" width="80%" />
+ </p>
+
+- delete
+ > File list -> Click the "Delete" button to delete the specified file
+
+#### 3.3 UDF management
+
+#### 3.3.1 Resource management
+
+> The resource management and file management functions are similar. The difference is that the resource management is the uploaded UDF function, and the file management uploads the user program, script and configuration file.
+> Operation function: rename, download, delete.
+
+- Upload udf resources
+ > Same as uploading files.
+
+#### 3.3.2 Function management
+
+- Create UDF function
+ > Click "Create UDF Function", enter the udf function parameters, select the udf resource, and click "Submit" to create the udf function.
+
+> Currently only supports temporary UDF functions of HIVE
+
+- UDF function name: the name when the UDF function is entered
+- Package name Class name: Enter the full path of the UDF function
+- UDF resource: Set the resource file corresponding to the created UDF
+
+<p align="center">
+ <img src="/img/udf_edit_en.png" width="80%" />
+ </p>
+
+### 4. Create data source
+
+> Data source center supports MySQL, POSTGRESQL, HIVE/IMPALA, SPARK, CLICKHOUSE, ORACLE, SQLSERVER and other data sources
+
+#### 4.1 Create/Edit MySQL data source
+
+- Click "Data Source Center -> Create Data Source" to create different types of data sources according to requirements.
+
+- Data source: select MYSQL
+- Data source name: enter the name of the data source
+- Description: Enter a description of the data source
+- IP hostname: enter the IP to connect to MySQL
+- Port: Enter the port to connect to MySQL
+- Username: Set the username for connecting to MySQL
+- Password: Set the password for connecting to MySQL
+- Database name: Enter the name of the database connected to MySQL
+- Jdbc connection parameters: parameter settings for MySQL connection, filled in in JSON form
+
+<p align="center">
+ <img src="/img/mysql-en.png" width="80%" />
+ </p>
+
+> Click "Test Connection" to test whether the data source can be successfully connected.
+
+#### 4.2 Create/Edit POSTGRESQL data source
+
+- Data source: select POSTGRESQL
+- Data source name: enter the name of the data source
+- Description: Enter a description of the data source
+- IP/Host Name: Enter the IP to connect to POSTGRESQL
+- Port: Enter the port to connect to POSTGRESQL
+- Username: Set the username for connecting to POSTGRESQL
+- Password: Set the password for connecting to POSTGRESQL
+- Database name: Enter the name of the database connected to POSTGRESQL
+- Jdbc connection parameters: parameter settings for POSTGRESQL connection, filled in in JSON form
+
+<p align="center">
+ <img src="/img/postgresql-en.png" width="80%" />
+ </p>
+
+#### 4.3 Create/Edit HIVE data source
+
+1.Use HiveServer2 to connect
+
+ <p align="center">
+ <img src="/img/hive-en.png" width="80%" />
+ </p>
+
+- Data source: select HIVE
+- Data source name: enter the name of the data source
+- Description: Enter a description of the data source
+- IP/Host Name: Enter the IP connected to HIVE
+- Port: Enter the port connected to HIVE
+- Username: Set the username for connecting to HIVE
+- Password: Set the password for connecting to HIVE
+- Database name: Enter the name of the database connected to HIVE
+- Jdbc connection parameters: parameter settings for HIVE connection, filled in in JSON form
+
+ 2.Use HiveServer2 HA Zookeeper to connect
+
+ <p align="center">
+ <img src="/img/hive1-en.png" width="80%" />
+ </p>
+
+Note: If you enable **kerberos**, you need to fill in **Principal**
+
+<p align="center">
+ <img src="/img/hive-en.png" width="80%" />
+ </p>
+
+#### 4.4 Create/Edit Spark data source
+
+<p align="center">
+ <img src="/img/spark-en.png" width="80%" />
+ </p>
+
+- Data source: select Spark
+- Data source name: enter the name of the data source
+- Description: Enter a description of the data source
+- IP/Hostname: Enter the IP connected to Spark
+- Port: Enter the port connected to Spark
+- Username: Set the username for connecting to Spark
+- Password: Set the password for connecting to Spark
+- Database name: Enter the name of the database connected to Spark
+- Jdbc connection parameters: parameter settings for Spark connection, filled in in JSON form
+
+### 5. Security Center (Permission System)
+
+ * Only the administrator account in the security center has the authority to operate. It has functions such as queue management, tenant management, user management, alarm group management, worker group management, token management, etc. In the user management module, resources, data sources, projects, etc. Authorization
+ * Administrator login, default user name and password: admin/dolphinscheduler123
+
+#### 5.1 Create queue
+
+- Queue is used when the "queue" parameter is needed to execute programs such as spark and mapreduce.
+- The administrator enters the Security Center->Queue Management page and clicks the "Create Queue" button to create a queue.
+<p align="center">
+ <img src="/img/create-queue-en.png" width="80%" />
+ </p>
+
+#### 5.2 Add tenant
+
+- The tenant corresponds to the Linux user, which is used by the worker to submit the job. If Linux does not have this user, the worker will create this user when executing the script.
+- Tenant Code: **Tenant Code is the only user on Linux and cannot be repeated**
+- The administrator enters the Security Center->Tenant Management page and clicks the "Create Tenant" button to create a tenant.
+
+ <p align="center">
+ <img src="/img/addtenant-en.png" width="80%" />
+ </p>
+
+#### 5.3 Create normal user
+
+- Users are divided into **administrator users** and **normal users**
+
+ - The administrator has authorization and user management authority, but does not have the authority to create project and workflow definition operations.
+ - Ordinary users can create projects and create, edit, and execute workflow definitions.
+ - Note: If the user switches tenants, all resources under the tenant where the user belongs will be copied to the new tenant that is switched.
+
+- The administrator enters the Security Center -> User Management page and clicks the "Create User" button to create a user.
+<p align="center">
+ <img src="/img/user-en.png" width="80%" />
+ </p>
+
+> **Edit user information**
+
+- The administrator enters the Security Center->User Management page and clicks the "Edit" button to edit user information.
+- After an ordinary user logs in, click the user information in the user name drop-down box to enter the user information page, and click the "Edit" button to edit the user information.
+
+> **Modify user password**
+
+- The administrator enters the Security Center->User Management page and clicks the "Edit" button. When editing user information, enter the new password to modify the user password.
+- After a normal user logs in, click the user information in the user name drop-down box to enter the password modification page, enter the password and confirm the password and click the "Edit" button, then the password modification is successful.
+
+#### 5.4 Create alarm group
+
+- The alarm group is a parameter set at startup. After the process ends, the status of the process and other information will be sent to the alarm group in the form of email.
+
+* The administrator enters the Security Center -> Alarm Group Management page and clicks the "Create Alarm Group" button to create an alarm group.
+
+ <p align="center">
+ <img src="/img/mail-en.png" width="80%" />
+
+#### 5.5 Token management
+
+> Since the back-end interface has login check, token management provides a way to perform various operations on the system by calling the interface.
+
+- The administrator enters the Security Center -> Token Management page, clicks the "Create Token" button, selects the expiration time and user, clicks the "Generate Token" button, and clicks the "Submit" button, then the selected user's token is created successfully.
+
+ <p align="center">
+ <img src="/img/create-token-en.png" width="80%" />
+ </p>
+
+ - After an ordinary user logs in, click the user information in the user name drop-down box, enter the token management page, select the expiration time, click the "generate token" button, and click the "submit" button, then the user creates a token successfully.
+ - Call example:
+
+```
+Token call example
+ /**
+ * test token
+ */
+ public void doPOSTParam()throws Exception{
+ // create HttpClient
+ CloseableHttpClient httpclient = HttpClients.createDefault();
+
+ // create http post request
+ HttpPost httpPost = new HttpPost("http://127.0.0.1:12345/escheduler/projects/create");
+ httpPost.setHeader("token", "123");
+ // set parameters
+ List<NameValuePair> parameters = new ArrayList<NameValuePair>();
+ parameters.add(new BasicNameValuePair("projectName", "qzw"));
+ parameters.add(new BasicNameValuePair("desc", "qzw"));
+ UrlEncodedFormEntity formEntity = new UrlEncodedFormEntity(parameters);
+ httpPost.setEntity(formEntity);
+ CloseableHttpResponse response = null;
+ try {
+ // execute
+ response = httpclient.execute(httpPost);
+ // response status code 200
+ if (response.getStatusLine().getStatusCode() == 200) {
+ String content = EntityUtils.toString(response.getEntity(), "UTF-8");
+ System.out.println(content);
+ }
+ } finally {
+ if (response != null) {
+ response.close();
+ }
+ httpclient.close();
+ }
+ }
+```
+
+#### 5.6 Granted permission
+
+ * Granted permissions include project permissions, resource permissions, data source permissions, UDF function permissions.
+ * The administrator can authorize the projects, resources, data sources and UDF functions not created by ordinary users. Because the authorization methods for projects, resources, data sources and UDF functions are the same, we take project authorization as an example.
+ * Note: For projects created by users themselves, the user has all permissions. The project list and the selected project list will not be displayed.
+
+- The administrator enters the Security Center -> User Management page and clicks the "Authorize" button of the user who needs to be authorized, as shown in the figure below:
+ <p align="center">
+ <img src="/img/auth-en.png" width="80%" />
+</p>
+
+- Select the project to authorize the project.
+
+<p align="center">
+ <img src="/img/authproject-en.png" width="80%" />
+ </p>
+
+- Resources, data sources, and UDF function authorization are the same as project authorization.
+
+### 6. monitoring Center
+
+#### 6.1 Service management
+
+- Service management is mainly to monitor and display the health status and basic information of each service in the system
+
+#### 6.1.1 master monitoring
+
+- Mainly related to master information.
+<p align="center">
+ <img src="/img/master-jk-en.png" width="80%" />
+ </p>
+
+#### 6.1.2 worker monitoring
+
+- Mainly related to worker information.
+
+<p align="center">
+ <img src="/img/worker-jk-en.png" width="80%" />
+ </p>
+
+#### 6.1.3 Zookeeper monitoring
+
+- Mainly related configuration information of each worker and master in zookpeeper.
+
+<p align="center">
+ <img src="/img/zookeeper-monitor-en.png" width="80%" />
+ </p>
+
+#### 6.1.4 DB monitoring
+
+- Mainly the health of the DB
+
+<p align="center">
+ <img src="/img/mysql-jk-en.png" width="80%" />
+ </p>
+
+#### 6.2 Statistics management
+
+<p align="center">
+ <img src="/img/statistics-en.png" width="80%" />
+ </p>
+
+- Number of commands to be executed: statistics on the t_ds_command table
+- The number of failed commands: statistics on the t_ds_error_command table
+- Number of tasks to run: Count the data of task_queue in Zookeeper
+- Number of tasks to be killed: Count the data of task_kill in Zookeeper
+
+### 7. <span id=TaskParamers>Task node type and parameter settings</span>
+
+#### 7.1 Shell node
+
+> Shell node, when the worker is executed, a temporary shell script is generated, and the linux user with the same name as the tenant executes the script.
+
+- Click Project Management-Project Name-Workflow Definition, and click the "Create Workflow" button to enter the DAG editing page.
+- Drag <img src="/img/shell.png" width="35"/> from the toolbar to the drawing board, as shown in the figure below:
+
+ <p align="center">
+ <img src="/img/shell-en.png" width="80%" />
+ </p>
+
+- Node name: The node name in a workflow definition is unique.
+- Run flag: Identifies whether this node can be scheduled normally, if it does not need to be executed, you can turn on the prohibition switch.
+- Descriptive information: describe the function of the node.
+- Task priority: When the number of worker threads is insufficient, they are executed in order from high to low, and when the priority is the same, they are executed according to the first-in first-out principle.
+- Worker grouping: Tasks are assigned to the machines of the worker group to execute. If Default is selected, a worker machine will be randomly selected for execution.
+- Number of failed retry attempts: The number of times the task failed to be resubmitted. It supports drop-down and hand-filling.
+- Failed retry interval: The time interval for resubmitting the task after a failed task. It supports drop-down and hand-filling.
+- Timeout alarm: Check the timeout alarm and timeout failure. When the task exceeds the "timeout period", an alarm email will be sent and the task execution will fail.
+- Script: SHELL program developed by users.
+- Resource: Refers to the list of resource files that need to be called in the script, and the files uploaded or created by the resource center-file management.
+- User-defined parameters: It is a user-defined parameter that is part of SHELL, which will replace the content with \${variable} in the script.
+
+#### 7.2 Sub-process node
+
+- The sub-process node is to execute a certain external workflow definition as a task node.
+ > Drag the  task node in the toolbar to the drawing board, as shown in the following figure:
+
+<p align="center">
+ <img src="/img/sub-process-en.png" width="80%" />
+ </p>
+
+- Node name: The node name in a workflow definition is unique
+- Run flag: identify whether this node can be scheduled normally
+- Descriptive information: describe the function of the node
+- Timeout alarm: Check the timeout alarm and timeout failure. When the task exceeds the "timeout period", an alarm email will be sent and the task execution will fail.
+- Sub-node: It is the workflow definition of the selected sub-process. Enter the sub-node in the upper right corner to jump to the workflow definition of the selected sub-process
+
+#### 7.3 DEPENDENT node
+
+- Dependent nodes are **dependency check nodes**. For example, process A depends on the successful execution of process B yesterday, and the dependent node will check whether process B has a successful execution yesterday.
+
+> Drag the  task node in the toolbar to the drawing board, as shown in the following figure:
+
+<p align="center">
+ <img src="/img/dependent-nodes-en.png" width="80%" />
+ </p>
+
+> The dependent node provides a logical judgment function, such as checking whether the B process was successful yesterday, or whether the C process was executed successfully.
+
+ <p align="center">
+ <img src="/img/depend-node-en.png" width="80%" />
+ </p>
+
+> For example, process A is a weekly report task, processes B and C are daily tasks, and task A requires tasks B and C to be successfully executed every day of the last week, as shown in the figure:
+
+ <p align="center">
+ <img src="/img/depend-node1-en.png" width="80%" />
+ </p>
+
+> If the weekly report A also needs to be executed successfully last Tuesday:
+
+ <p align="center">
+ <img src="/img/depend-node3-en.png" width="80%" />
+ </p>
+
+#### 7.4 Stored procedure node
+
+- According to the selected data source, execute the stored procedure.
+ > Drag in the toolbarThe task node to the drawing board, as shown in the following figure:
+
+<p align="center">
+ <img src="/img/procedure-en.png" width="80%" />
+ </p>
+
+- Data source: The data source type of the stored procedure supports MySQL and POSTGRESQL, select the corresponding data source
+- Method: is the method name of the stored procedure
+- Custom parameters: The custom parameter types of the stored procedure support IN and OUT, and the data types support nine data types: VARCHAR, INTEGER, LONG, FLOAT, DOUBLE, DATE, TIME, TIMESTAMP, and BOOLEAN
+
+#### 7.5 SQL node
+
+- Drag in the toolbarTask node into the drawing board
+- Non-query SQL function: edit non-query SQL task information, select non-query for sql type, as shown in the figure below:
+ <p align="center">
+ <img src="/img/sql-en.png" width="80%" />
+</p>
+
+- Query SQL function: Edit and query SQL task information, sql type selection query, select form or attachment to send mail to the specified recipient, as shown in the figure below.
+
+<p align="center">
+ <img src="/img/sql-node-en.png" width="80%" />
+ </p>
+
+- Data source: select the corresponding data source
+- sql type: supports query and non-query. The query is a select type query, which is returned with a result set. You can specify three templates for email notification as form, attachment or form attachment. Non-queries are returned without a result set, and are for three types of operations: update, delete, and insert.
+- sql parameter: the input parameter format is key1=value1;key2=value2...
+- sql statement: SQL statement
+- UDF function: For data sources of type HIVE, you can refer to UDF functions created in the resource center. UDF functions are not supported for other types of data sources.
+- Custom parameters: SQL task type, and stored procedure is a custom parameter order to set values for the method. The custom parameter type and data type are the same as the stored procedure task type. The difference is that the SQL task type custom parameter will replace the \${variable} in the SQL statement.
+- Pre-sql: Pre-sql is executed before the sql statement.
+- Post-sql: Post-sql is executed after the sql statement.
+
+#### 7.6 SPARK node
+
+- Through the SPARK node, you can directly execute the SPARK program. For the spark node, the worker will use the `spark-submit` method to submit tasks
+
+> Drag in the toolbarThe task node to the drawing board, as shown in the following figure:
+
+<p align="center">
+ <img src="/img/spark-submit-en.png" width="80%" />
+ </p>
+
+- Program type: supports JAVA, Scala and Python three languages
+- The class of the main function: is the full path of the Spark program’s entry Main Class
+- Main jar package: Spark jar package
+- Deployment mode: support three modes of yarn-cluster, yarn-client and local
+- Driver core number: You can set the number of Driver cores and the number of memory
+- Number of Executors: You can set the number of Executors, the number of Executor memory, and the number of Executor cores
+- Command line parameters: Set the input parameters of the Spark program and support the substitution of custom parameter variables.
+- Other parameters: support --jars, --files, --archives, --conf format
+- Resource: If the resource file is referenced in other parameters, you need to select and specify in the resource
+- User-defined parameter: It is a user-defined parameter of the MR part, which will replace the content with \${variable} in the script
+
+Note: JAVA and Scala are only used for identification, there is no difference, if it is Spark developed by Python, there is no main function class, and the others are the same
+
+#### 7.7 MapReduce(MR) node
+
+- Using the MR node, you can directly execute the MR program. For the mr node, the worker will use the `hadoop jar` method to submit tasks
+
+> Drag the  task node in the toolbar to the drawing board, as shown in the following figure:
+
+1. JAVA program
+
+ <p align="center">
+ <img src="/img/mr_java_en.png" width="80%" />
+ </p>
+
+- The class of the main function: is the full path of the Main Class, the entry point of the MR program
+- Program type: select JAVA language
+- Main jar package: is the MR jar package
+- Command line parameters: set the input parameters of the MR program and support the substitution of custom parameter variables
+- Other parameters: support -D, -files, -libjars, -archives format
+- Resource: If the resource file is referenced in other parameters, you need to select and specify in the resource
+- User-defined parameter: It is a user-defined parameter of the MR part, which will replace the content with \${variable} in the script
Review comment:
```suggestion
- User-defined parameter: It is a local user-defined parameter of the MR, which will replace the content with \${variable} in the script
```
##########
File path: docs/en-us/1.3.2/user_doc/system-manual.md
##########
@@ -0,0 +1,886 @@
+# System User Manual
+
+## Get started quickly
+
+> Please refer to [Quick Start](quick-start.html)
+
+## Operation guide
+
+### 1. Home
+
+The home page contains task status statistics, process status statistics, and workflow definition statistics for all projects of the user.
+
+<p align="center">
+<img src="/img/home_en.png" width="80%" />
+</p>
+
+### 2. Project management
+
+#### 2.1 Create project
+
+- Click "Project Management" to enter the project management page, click the "Create Project" button, enter the project name, project description, and click "Submit" to create a new project.
+
+ <p align="center">
+ <img src="/img/create_project_en1.png" width="80%" />
+ </p>
+
+#### 2.2 Project home
+
+- Click the project name link on the project management page to enter the project home page, as shown in the figure below, the project home page contains the task status statistics, process status statistics, and workflow definition statistics of the project.
+ <p align="center">
+ <img src="/img/project_home_en.png" width="80%" />
+ </p>
+
+- Task status statistics: within the specified time range, count the number of task instances as successful submission, running, ready to pause, pause, ready to stop, stop, failure, success, fault tolerance, kill, and waiting threads
+- Process status statistics: within the specified time range, count the number of the status of the workflow instance as submission success, running, ready to pause, pause, ready to stop, stop, failure, success, fault tolerance, kill, and waiting threads
+- Workflow definition statistics: Count the workflow definitions created by this user and the workflow definitions granted to this user by the administrator
+
+#### 2.3 Workflow definition
+
+#### <span id=creatDag>2.3.1 Create workflow definition</span>
+
+- Click Project Management -> Workflow -> Workflow Definition to enter the workflow definition page, and click the "Create Workflow" button to enter the **workflow DAG edit** page, as shown in the following figure:
+ <p align="center">
+ <img src="/img/dag5.png" width="80%" />
+ </p>
+- Drag in the toolbar <img src="/img/shell.png" width="35"/> Add a Shell task to the drawing board, as shown in the figure below:
+ <p align="center">
+ <img src="/img/shell-en.png" width="80%" />
+ </p>
+- **Add parameter settings for this shell task:**
+
+1. Fill in the "Node Name", "Description", and "Script" fields;
+2. Check “Normal” for “Run Flag”. If “Prohibit Execution” is checked, the task will not be executed when the workflow runs;
+3. Select "Task Priority": When the number of worker threads is insufficient, high-level tasks will be executed first in the execution queue, and tasks with the same priority will be executed in the order of first in, first out;
+4. Timeout alarm (optional): Check the timeout alarm, timeout failure, and fill in the "timeout period". When the task execution time exceeds **timeout period**, an alert email will be sent and the task timeout fails;
+5. Resources (optional). Resource files are files created or uploaded on the Resource Center -> File Management page. For example, the file name is `test.sh`, and the command to call the resource in the script is `sh test.sh`;
+6. Custom parameters (optional), refer to [Custom Parameters](#UserDefinedParameters);
+7. Click the "Confirm Add" button to save the task settings.
+
+- **Increase the order of task execution:** Click the icon in the upper right corner <img src="/img/line.png" width="35"/> to connect the task; as shown in the figure below, task 2 and task 3 are executed in parallel, When task 1 finished execute, tasks 2 and 3 will be executed simultaneously.
+
+ <p align="center">
+ <img src="/img/dag6.png" width="80%" />
+ </p>
+
+- **Delete dependencies:** Click the "arrow" icon in the upper right corner <img src="/img/arrow.png" width="35"/>, select the connection line, and click the "Delete" icon in the upper right corner <img src= "/img/delete.png" width="35"/>, delete dependencies between tasks.
+ <p align="center">
+ <img src="/img/dag7.png" width="80%" />
+ </p>
+
+- **Save workflow definition:** Click the "Save" button, and the "Set DAG chart name" pop-up box will pop up, as shown in the figure below. Enter the workflow definition name, workflow definition description, and set global parameters (optional, refer to [ Custom parameters](#UserDefinedParameters)), click the "Add" button, and the workflow definition is created successfully.
+ <p align="center">
+ <img src="/img/dag8.png" width="80%" />
+ </p>
+> For other types of tasks, please refer to [Task Node Type and Parameter Settings](#TaskParamers).
+
+#### 2.3.2 Workflow definition operation function
+
+Click Project Management -> Workflow -> Workflow Definition to enter the workflow definition page, as shown below:
+
+<p align="center">
+<img src="/img/work_list_en.png" width="80%" />
+</p>
+The operation functions of the workflow definition list are as follows:
+
+- **Edit:** Only "offline" workflow definitions can be edited. Workflow DAG editing is the same as [Create Workflow Definition](#creatDag).
+- **Online:** When the workflow status is "Offline", used to online workflow. Only the workflow in the "Online" state can run, but cannot be edited.
+- **Offline:** When the workflow status is "Online", used to offline workflow. Only the workflow in the "Offline" state can be edited, but not run.
+- **Run:** Only workflow in the online state can run. See [2.3.3 Run Workflow](#runWorkflow) for the operation steps
+- **Timing:** Timing can only be set in online workflows, and the system automatically schedules the workflow to run on a regular basis. The status after creating a timing is "offline", and the timing must be online on the timing management page to take effect. See [2.3.4 Workflow Timing](#creatTiming) for timing operation steps.
+- **Timing Management:** The timing management page can be edited, online/offline, and deleted.
+- **Delete:** Delete the workflow definition.
+- **Download:** Download workflow definition to local.
+- **Tree Diagram:** Display the task node type and task status in a tree structure, as shown in the figure below:
+ <p align="center">
+ <img src="/img/tree_en.png" width="80%" />
+ </p>
+
+#### <span id=runWorkflow>2.3.3 Run the workflow</span>
+
+- Click Project Management -> Workflow -> Workflow Definition to enter the workflow definition page, as shown in the figure below, click the "Go Online" button <img src="/img/online.png" width="35"/>,Go online workflow.
+ <p align="center">
+ <img src="/img/work_list_en.png" width="80%" />
+ </p>
+
+- Click the "Run" button to pop up the startup parameter setting pop-up box, as shown in the figure below, set the startup parameters, click the "Run" button in the pop-up box, the workflow starts running, and the workflow instance page generates a workflow instance.
+ <p align="center">
+ <img src="/img/run_work_en.png" width="80%" />
+ </p>
+ <span id=runParamers>Description of workflow operating parameters:</span>
+
+ * Failure strategy: When a task node fails to execute, other parallel task nodes need to execute the strategy. "Continue" means: after a certain task fails, other task nodes execute normally; "End" means: terminate all tasks being executed, and terminate the entire process.
+ * Notification strategy: When the process is over, the process execution information notification email is sent according to the process status, including any status is not sent, successful sent, failed sent, successful or failed sent.
+ * Process priority: The priority of process operation, divided into five levels: highest (HIGHEST), high (HIGH), medium (MEDIUM), low (LOW), and lowest (LOWEST). When the number of master threads is insufficient, high-level processes will be executed first in the execution queue, and processes with the same priority will be executed in a first-in first-out order.
+ * Worker group: The process can only be executed in the specified worker machine group. The default is Default, which can be executed on any worker.
+ * Notification group: select notification strategy||timeout alarm||when fault tolerance occurs, process information or email will be sent to all members in the notification group.
+ * Recipient: Select notification policy||Timeout alarm||When fault tolerance occurs, process information or alarm email will be sent to the recipient list.
+ * Cc: Select the notification strategy||Timeout alarm||When fault tolerance occurs, the process information or warning email will be copied to the CC list.
+ * Complement: Two modes including serial complement and parallel complement. Serial complement: within the specified time range, the complement is executed sequentially from the start date to the end date, and only one process instance is generated; parallel complement: within the specified time range, multiple days are complemented at the same time to generate N process instances.
+ * For example, you need to fill in the data from May 1 to May 10.
+
+ <p align="center">
+ <img src="/img/complement_en1.png" width="80%" />
+ </p>
+
+ > Serial mode: The complement is executed sequentially from May 1 to May 10, and a process instance is generated on the process instance page;
+
+ > Parallel mode: The tasks from May 1 to may 10 are executed simultaneously, and 10 process instances are generated on the process instance page.
+
+#### <span id=creatTiming>2.3.4 Workflow timing</span>
+
+- Create timing: Click Project Management->Workflow->Workflow Definition, enter the workflow definition page, go online the workflow, click the "timing" button <img src="/img/timing.png" width="35"/> ,The timing parameter setting dialog box pops up, as shown in the figure below:
+ <p align="center">
+ <img src="/img/time_schedule_en.png" width="80%" />
+ </p>
+- Choose the start and end time. In the start and end time range, the workflow is run at regular intervals; not in the start and end time range, no more regular workflow instances are generated.
+- Add a timing that is executed once every day at 5 AM, as shown in the following figure:
+ <p align="center">
+ <img src="/img/timer-en.png" width="80%" />
+ </p>
+- Failure strategy, notification strategy, process priority, worker group, notification group, recipient, and CC are the same as [workflow running parameters](#runParamers).
+- Click the "Create" button to create the timing successfully. At this time, the timing status is "**Offline**" and the timing needs to be **Online** to take effect.
+- Timing online: Click the "timing management" button <img src="/img/timeManagement.png" width="35"/>, enter the timing management page, click the "online" button, the timing status will change to "online", as shown in the below figure, the workflow takes effect regularly.
+ <p align="center">
+ <img src="/img/time-manage-list-en.png" width="80%" />
+ </p>
+
+#### 2.3.5 Import workflow
+
+Click Project Management -> Workflow -> Workflow Definition to enter the workflow definition page, click the "Import Workflow" button to import the local workflow file, the workflow definition list displays the imported workflow, and the status is offline.
+
+#### 2.4 Workflow instance
+
+#### 2.4.1 View workflow instance
+
+- Click Project Management -> Workflow -> Workflow Instance to enter the Workflow Instance page, as shown in the figure below:
+ <p align="center">
+ <img src="/img/instance-list-en.png" width="80%" />
+ </p>
+- Click the workflow name to enter the DAG view page to view the task execution status, as shown in the figure below.
+ <p align="center">
+ <img src="/img/instance-runs-en.png" width="80%" />
+ </p>
+
+#### 2.4.2 View task log
+
+- Enter the workflow instance page, click the workflow name, enter the DAG view page, double-click the task node, as shown in the following figure:
+ <p align="center">
+ <img src="/img/instanceViewLog-en.png" width="80%" />
+ </p>
+- Click "View Log", a log pop-up box will pop up, as shown in the figure below, the task log can also be viewed on the task instance page, refer to [Task View Log](#taskLog)。
+ <p align="center">
+ <img src="/img/task-log-en.png" width="80%" />
+ </p>
+
+#### 2.4.3 View task history
+
+- Click Project Management -> Workflow -> Workflow Instance to enter the workflow instance page, and click the workflow name to enter the workflow DAG page;
+- Double-click the task node, as shown in the figure below, click "View History" to jump to the task instance page, and display a list of task instances running by the workflow instance
+ <p align="center">
+ <img src="/img/task_history_en.png" width="80%" />
+ </p>
+
+#### 2.4.4 View operating parameters
+
+- Click Project Management -> Workflow -> Workflow Instance to enter the workflow instance page, and click the workflow name to enter the workflow DAG page;
+- Click the icon in the upper left corner <img src="/img/run_params_button.png" width="35"/>,View the startup parameters of the workflow instance; click the icon <img src="/img/global_param.png" width="35"/>,View the global and local parameters of the workflow instance, as shown in the following figure:
+ <p align="center">
+ <img src="/img/run_params_en.png" width="80%" />
+ </p>
+
+#### 2.4.4 Workflow instance operation function
+
+Click Project Management -> Workflow -> Workflow Instance to enter the Workflow Instance page, as shown in the figure below:
+
+ <p align="center">
+ <img src="/img/instance-list-en.png" width="80%" />
+ </p>
+
+- **Edit:** Only terminated processes can be edited. Click the "Edit" button or the name of the workflow instance to enter the DAG edit page. After edit, click the "Save" button to pop up the Save DAG pop-up box, as shown in the figure below. In the pop-up box, check "Whether to update to workflow definition" and save After that, the workflow definition will be updated; if it is not checked, the workflow definition will not be updated.
+ <p align="center">
+ <img src="/img/editDag-en.png" width="80%" />
+ </p>
+- **Rerun:** Re-execute the terminated process.
+- **Recovery failed:** For failed processes, you can perform recovery operations, starting from the failed node.
+- **Stop:** To **stop** the running process, the background will first `kill`worker process, and then execute `kill -9` operation
+- **Pause:** Perform a **pause** operation on the running process, the system status will change to **waiting for execution**, it will wait for the end of the task being executed, and pause the next task to be executed.
+- **Resume pause:** To resume the paused process, start running directly from the **paused node**
+- **Delete:** Delete the workflow instance and the task instance under the workflow instance
+- **Gantt chart:** The vertical axis of the Gantt chart is the topological sorting of task instances under a certain workflow instance, and the horizontal axis is the running time of the task instances, as shown in the figure:
+ <p align="center">
+ <img src="/img/gantt-en.png" width="80%" />
+ </p>
+
+#### 2.5 Task instance
+
+- Click Project Management -> Workflow -> Task Instance to enter the task instance page, as shown in the figure below, click the name of the workflow instance, you can jump to the workflow instance DAG chart to view the task status.
+ <p align="center">
+ <img src="/img/task-list-en.png" width="80%" />
+ </p>
+
+- <span id=taskLog>View log:</span>Click the "view log" button in the operation column to view the log of task execution.
+ <p align="center">
+ <img src="/img/task-log2-en.png" width="80%" />
+ </p>
+
+### 3. Resource Center
+
+#### 3.1 hdfs resource configuration
+
+- Upload resource files and udf functions, all uploaded files and resources will be stored on hdfs, so the following configuration items are required:
+
+```
+
+conf/common/common.properties
+ # Users who have permission to create directories under the HDFS root path
+ hdfs.root.user=hdfs
+ # data base dir, resource file will store to this hadoop hdfs path, self configuration, please make sure the directory exists on hdfs and have read write permissions。"/escheduler" is recommended
+ data.store2hdfs.basepath=/dolphinscheduler
+ # resource upload startup type : HDFS,S3,NONE
+ res.upload.startup.type=HDFS
+ # whether kerberos starts
+ hadoop.security.authentication.startup.state=false
+ # java.security.krb5.conf path
+ java.security.krb5.conf.path=/opt/krb5.conf
+ # loginUserFromKeytab user
+ login.user.keytab.username=hdfs-mycluster@ESZ.COM
+ # loginUserFromKeytab path
+ login.user.keytab.path=/opt/hdfs.headless.keytab
+
+conf/common/hadoop.properties
+ # ha or single namenode,If namenode ha needs to copy core-site.xml and hdfs-site.xml
+ # to the conf directory,support s3,for example : s3a://dolphinscheduler
+ fs.defaultFS=hdfs://mycluster:8020
+ #resourcemanager ha note this need ips , this empty if single
+ yarn.resourcemanager.ha.rm.ids=192.168.xx.xx,192.168.xx.xx
+ # If it is a single resourcemanager, you only need to configure one host name. If it is resourcemanager HA, the default configuration is fine
+ yarn.application.status.address=http://xxxx:8088/ws/v1/cluster/apps/%s
+
+```
+
+- Only one address needs to be configured for yarn.resourcemanager.ha.rm.ids and yarn.application.status.address, and the other address is empty.
+- You need to copy core-site.xml and hdfs-site.xml from the conf directory of the Hadoop cluster to the conf directory of the dolphinscheduler project, and restart the api-server service.
+
+#### 3.2 File management
+
+> It is the management of various resource files, including creating basic txt/log/sh/conf/py/java and other files, uploading jar packages and other types of files, and can do edit, rename, download, delete and other operations.
+
+ <p align="center">
+ <img src="/img/file-manage-en.png" width="80%" />
+ </p>
+
+- Create a file
+ > The file format supports the following types: txt, log, sh, conf, cfg, py, java, sql, xml, hql, properties
+
+<p align="center">
+ <img src="/img/file_create_en.png" width="80%" />
+ </p>
+
+- upload files
+
+> Upload file: Click the "Upload File" button to upload, drag the file to the upload area, the file name will be automatically completed with the uploaded file name
+
+<p align="center">
+ <img src="/img/file-upload-en.png" width="80%" />
+ </p>
+
+- File View
+
+> For the file types that can be viewed, click the file name to view the file details
+
+<p align="center">
+ <img src="/img/file_detail_en.png" width="80%" />
+ </p>
+
+- download file
+
+> Click the "Download" button in the file list to download the file or click the "Download" button in the upper right corner of the file details to download the file
+
+- File rename
+
+<p align="center">
+ <img src="/img/file_rename_en.png" width="80%" />
+ </p>
+
+- delete
+ > File list -> Click the "Delete" button to delete the specified file
+
+#### 3.3 UDF management
+
+#### 3.3.1 Resource management
+
+> The resource management and file management functions are similar. The difference is that the resource management is the uploaded UDF function, and the file management uploads the user program, script and configuration file.
+> Operation function: rename, download, delete.
+
+- Upload udf resources
+ > Same as uploading files.
+
+#### 3.3.2 Function management
+
+- Create UDF function
+ > Click "Create UDF Function", enter the udf function parameters, select the udf resource, and click "Submit" to create the udf function.
+
+> Currently only supports temporary UDF functions of HIVE
+
+- UDF function name: the name when the UDF function is entered
+- Package name Class name: Enter the full path of the UDF function
+- UDF resource: Set the resource file corresponding to the created UDF
+
+<p align="center">
+ <img src="/img/udf_edit_en.png" width="80%" />
+ </p>
+
+### 4. Create data source
+
+> Data source center supports MySQL, POSTGRESQL, HIVE/IMPALA, SPARK, CLICKHOUSE, ORACLE, SQLSERVER and other data sources
+
+#### 4.1 Create/Edit MySQL data source
+
+- Click "Data Source Center -> Create Data Source" to create different types of data sources according to requirements.
+
+- Data source: select MYSQL
+- Data source name: enter the name of the data source
+- Description: Enter a description of the data source
+- IP hostname: enter the IP to connect to MySQL
+- Port: Enter the port to connect to MySQL
+- Username: Set the username for connecting to MySQL
+- Password: Set the password for connecting to MySQL
+- Database name: Enter the name of the database connected to MySQL
+- Jdbc connection parameters: parameter settings for MySQL connection, filled in in JSON form
+
+<p align="center">
+ <img src="/img/mysql-en.png" width="80%" />
+ </p>
+
+> Click "Test Connection" to test whether the data source can be successfully connected.
+
+#### 4.2 Create/Edit POSTGRESQL data source
+
+- Data source: select POSTGRESQL
+- Data source name: enter the name of the data source
+- Description: Enter a description of the data source
+- IP/Host Name: Enter the IP to connect to POSTGRESQL
+- Port: Enter the port to connect to POSTGRESQL
+- Username: Set the username for connecting to POSTGRESQL
+- Password: Set the password for connecting to POSTGRESQL
+- Database name: Enter the name of the database connected to POSTGRESQL
+- Jdbc connection parameters: parameter settings for POSTGRESQL connection, filled in in JSON form
+
+<p align="center">
+ <img src="/img/postgresql-en.png" width="80%" />
+ </p>
+
+#### 4.3 Create/Edit HIVE data source
+
+1.Use HiveServer2 to connect
+
+ <p align="center">
+ <img src="/img/hive-en.png" width="80%" />
+ </p>
+
+- Data source: select HIVE
+- Data source name: enter the name of the data source
+- Description: Enter a description of the data source
+- IP/Host Name: Enter the IP connected to HIVE
+- Port: Enter the port connected to HIVE
+- Username: Set the username for connecting to HIVE
+- Password: Set the password for connecting to HIVE
+- Database name: Enter the name of the database connected to HIVE
+- Jdbc connection parameters: parameter settings for HIVE connection, filled in in JSON form
+
+ 2.Use HiveServer2 HA Zookeeper to connect
+
+ <p align="center">
+ <img src="/img/hive1-en.png" width="80%" />
+ </p>
+
+Note: If you enable **kerberos**, you need to fill in **Principal**
+
+<p align="center">
+ <img src="/img/hive-en.png" width="80%" />
+ </p>
+
+#### 4.4 Create/Edit Spark data source
+
+<p align="center">
+ <img src="/img/spark-en.png" width="80%" />
+ </p>
+
+- Data source: select Spark
+- Data source name: enter the name of the data source
+- Description: Enter a description of the data source
+- IP/Hostname: Enter the IP connected to Spark
+- Port: Enter the port connected to Spark
+- Username: Set the username for connecting to Spark
+- Password: Set the password for connecting to Spark
+- Database name: Enter the name of the database connected to Spark
+- Jdbc connection parameters: parameter settings for Spark connection, filled in in JSON form
+
+### 5. Security Center (Permission System)
+
+ * Only the administrator account in the security center has the authority to operate. It has functions such as queue management, tenant management, user management, alarm group management, worker group management, token management, etc. In the user management module, resources, data sources, projects, etc. Authorization
+ * Administrator login, default user name and password: admin/dolphinscheduler123
+
+#### 5.1 Create queue
+
+- Queue is used when the "queue" parameter is needed to execute programs such as spark and mapreduce.
+- The administrator enters the Security Center->Queue Management page and clicks the "Create Queue" button to create a queue.
+<p align="center">
+ <img src="/img/create-queue-en.png" width="80%" />
+ </p>
+
+#### 5.2 Add tenant
+
+- The tenant corresponds to the Linux user, which is used by the worker to submit the job. If Linux does not have this user, the worker will create this user when executing the script.
+- Tenant Code: **Tenant Code is the only user on Linux and cannot be repeated**
+- The administrator enters the Security Center->Tenant Management page and clicks the "Create Tenant" button to create a tenant.
+
+ <p align="center">
+ <img src="/img/addtenant-en.png" width="80%" />
+ </p>
+
+#### 5.3 Create normal user
+
+- Users are divided into **administrator users** and **normal users**
+
+ - The administrator has authorization and user management authority, but does not have the authority to create project and workflow definition operations.
+ - Ordinary users can create projects and create, edit, and execute workflow definitions.
+ - Note: If the user switches tenants, all resources under the tenant where the user belongs will be copied to the new tenant that is switched.
+
+- The administrator enters the Security Center -> User Management page and clicks the "Create User" button to create a user.
+<p align="center">
+ <img src="/img/user-en.png" width="80%" />
+ </p>
+
+> **Edit user information**
+
+- The administrator enters the Security Center->User Management page and clicks the "Edit" button to edit user information.
+- After an ordinary user logs in, click the user information in the user name drop-down box to enter the user information page, and click the "Edit" button to edit the user information.
+
+> **Modify user password**
+
+- The administrator enters the Security Center->User Management page and clicks the "Edit" button. When editing user information, enter the new password to modify the user password.
+- After a normal user logs in, click the user information in the user name drop-down box to enter the password modification page, enter the password and confirm the password and click the "Edit" button, then the password modification is successful.
+
+#### 5.4 Create alarm group
+
+- The alarm group is a parameter set at startup. After the process ends, the status of the process and other information will be sent to the alarm group in the form of email.
+
+* The administrator enters the Security Center -> Alarm Group Management page and clicks the "Create Alarm Group" button to create an alarm group.
+
+ <p align="center">
+ <img src="/img/mail-en.png" width="80%" />
+
+#### 5.5 Token management
+
+> Since the back-end interface has login check, token management provides a way to perform various operations on the system by calling the interface.
+
+- The administrator enters the Security Center -> Token Management page, clicks the "Create Token" button, selects the expiration time and user, clicks the "Generate Token" button, and clicks the "Submit" button, then the selected user's token is created successfully.
+
+ <p align="center">
+ <img src="/img/create-token-en.png" width="80%" />
+ </p>
+
+ - After an ordinary user logs in, click the user information in the user name drop-down box, enter the token management page, select the expiration time, click the "generate token" button, and click the "submit" button, then the user creates a token successfully.
+ - Call example:
+
+```
+Token call example
+ /**
+ * test token
+ */
+ public void doPOSTParam()throws Exception{
+ // create HttpClient
+ CloseableHttpClient httpclient = HttpClients.createDefault();
+
+ // create http post request
+ HttpPost httpPost = new HttpPost("http://127.0.0.1:12345/escheduler/projects/create");
+ httpPost.setHeader("token", "123");
+ // set parameters
+ List<NameValuePair> parameters = new ArrayList<NameValuePair>();
+ parameters.add(new BasicNameValuePair("projectName", "qzw"));
+ parameters.add(new BasicNameValuePair("desc", "qzw"));
+ UrlEncodedFormEntity formEntity = new UrlEncodedFormEntity(parameters);
+ httpPost.setEntity(formEntity);
+ CloseableHttpResponse response = null;
+ try {
+ // execute
+ response = httpclient.execute(httpPost);
+ // response status code 200
+ if (response.getStatusLine().getStatusCode() == 200) {
+ String content = EntityUtils.toString(response.getEntity(), "UTF-8");
+ System.out.println(content);
+ }
+ } finally {
+ if (response != null) {
+ response.close();
+ }
+ httpclient.close();
+ }
+ }
+```
+
+#### 5.6 Granted permission
+
+ * Granted permissions include project permissions, resource permissions, data source permissions, UDF function permissions.
+ * The administrator can authorize the projects, resources, data sources and UDF functions not created by ordinary users. Because the authorization methods for projects, resources, data sources and UDF functions are the same, we take project authorization as an example.
+ * Note: For projects created by users themselves, the user has all permissions. The project list and the selected project list will not be displayed.
+
+- The administrator enters the Security Center -> User Management page and clicks the "Authorize" button of the user who needs to be authorized, as shown in the figure below:
+ <p align="center">
+ <img src="/img/auth-en.png" width="80%" />
+</p>
+
+- Select the project to authorize the project.
+
+<p align="center">
+ <img src="/img/authproject-en.png" width="80%" />
+ </p>
+
+- Resources, data sources, and UDF function authorization are the same as project authorization.
+
+### 6. monitoring Center
+
+#### 6.1 Service management
+
+- Service management is mainly to monitor and display the health status and basic information of each service in the system
+
+#### 6.1.1 master monitoring
+
+- Mainly related to master information.
+<p align="center">
+ <img src="/img/master-jk-en.png" width="80%" />
+ </p>
+
+#### 6.1.2 worker monitoring
+
+- Mainly related to worker information.
+
+<p align="center">
+ <img src="/img/worker-jk-en.png" width="80%" />
+ </p>
+
+#### 6.1.3 Zookeeper monitoring
+
+- Mainly related configuration information of each worker and master in zookpeeper.
+
+<p align="center">
+ <img src="/img/zookeeper-monitor-en.png" width="80%" />
+ </p>
+
+#### 6.1.4 DB monitoring
+
+- Mainly the health of the DB
+
+<p align="center">
+ <img src="/img/mysql-jk-en.png" width="80%" />
+ </p>
+
+#### 6.2 Statistics management
+
+<p align="center">
+ <img src="/img/statistics-en.png" width="80%" />
+ </p>
+
+- Number of commands to be executed: statistics on the t_ds_command table
+- The number of failed commands: statistics on the t_ds_error_command table
+- Number of tasks to run: Count the data of task_queue in Zookeeper
+- Number of tasks to be killed: Count the data of task_kill in Zookeeper
+
+### 7. <span id=TaskParamers>Task node type and parameter settings</span>
+
+#### 7.1 Shell node
+
+> Shell node, when the worker is executed, a temporary shell script is generated, and the linux user with the same name as the tenant executes the script.
+
+- Click Project Management-Project Name-Workflow Definition, and click the "Create Workflow" button to enter the DAG editing page.
+- Drag <img src="/img/shell.png" width="35"/> from the toolbar to the drawing board, as shown in the figure below:
+
+ <p align="center">
+ <img src="/img/shell-en.png" width="80%" />
+ </p>
+
+- Node name: The node name in a workflow definition is unique.
+- Run flag: Identifies whether this node can be scheduled normally, if it does not need to be executed, you can turn on the prohibition switch.
+- Descriptive information: describe the function of the node.
+- Task priority: When the number of worker threads is insufficient, they are executed in order from high to low, and when the priority is the same, they are executed according to the first-in first-out principle.
+- Worker grouping: Tasks are assigned to the machines of the worker group to execute. If Default is selected, a worker machine will be randomly selected for execution.
+- Number of failed retry attempts: The number of times the task failed to be resubmitted. It supports drop-down and hand-filling.
+- Failed retry interval: The time interval for resubmitting the task after a failed task. It supports drop-down and hand-filling.
+- Timeout alarm: Check the timeout alarm and timeout failure. When the task exceeds the "timeout period", an alarm email will be sent and the task execution will fail.
+- Script: SHELL program developed by users.
+- Resource: Refers to the list of resource files that need to be called in the script, and the files uploaded or created by the resource center-file management.
+- User-defined parameters: It is a user-defined parameter that is part of SHELL, which will replace the content with \${variable} in the script.
+
+#### 7.2 Sub-process node
+
+- The sub-process node is to execute a certain external workflow definition as a task node.
+ > Drag the  task node in the toolbar to the drawing board, as shown in the following figure:
+
+<p align="center">
+ <img src="/img/sub-process-en.png" width="80%" />
+ </p>
+
+- Node name: The node name in a workflow definition is unique
+- Run flag: identify whether this node can be scheduled normally
+- Descriptive information: describe the function of the node
+- Timeout alarm: Check the timeout alarm and timeout failure. When the task exceeds the "timeout period", an alarm email will be sent and the task execution will fail.
+- Sub-node: It is the workflow definition of the selected sub-process. Enter the sub-node in the upper right corner to jump to the workflow definition of the selected sub-process
+
+#### 7.3 DEPENDENT node
+
+- Dependent nodes are **dependency check nodes**. For example, process A depends on the successful execution of process B yesterday, and the dependent node will check whether process B has a successful execution yesterday.
+
+> Drag the  task node in the toolbar to the drawing board, as shown in the following figure:
+
+<p align="center">
+ <img src="/img/dependent-nodes-en.png" width="80%" />
+ </p>
+
+> The dependent node provides a logical judgment function, such as checking whether the B process was successful yesterday, or whether the C process was executed successfully.
+
+ <p align="center">
+ <img src="/img/depend-node-en.png" width="80%" />
+ </p>
+
+> For example, process A is a weekly report task, processes B and C are daily tasks, and task A requires tasks B and C to be successfully executed every day of the last week, as shown in the figure:
+
+ <p align="center">
+ <img src="/img/depend-node1-en.png" width="80%" />
+ </p>
+
+> If the weekly report A also needs to be executed successfully last Tuesday:
+
+ <p align="center">
+ <img src="/img/depend-node3-en.png" width="80%" />
+ </p>
+
+#### 7.4 Stored procedure node
+
+- According to the selected data source, execute the stored procedure.
+ > Drag in the toolbarThe task node to the drawing board, as shown in the following figure:
+
+<p align="center">
+ <img src="/img/procedure-en.png" width="80%" />
+ </p>
+
+- Data source: The data source type of the stored procedure supports MySQL and POSTGRESQL, select the corresponding data source
+- Method: is the method name of the stored procedure
+- Custom parameters: The custom parameter types of the stored procedure support IN and OUT, and the data types support nine data types: VARCHAR, INTEGER, LONG, FLOAT, DOUBLE, DATE, TIME, TIMESTAMP, and BOOLEAN
+
+#### 7.5 SQL node
+
+- Drag in the toolbarTask node into the drawing board
+- Non-query SQL function: edit non-query SQL task information, select non-query for sql type, as shown in the figure below:
+ <p align="center">
+ <img src="/img/sql-en.png" width="80%" />
+</p>
+
+- Query SQL function: Edit and query SQL task information, sql type selection query, select form or attachment to send mail to the specified recipient, as shown in the figure below.
+
+<p align="center">
+ <img src="/img/sql-node-en.png" width="80%" />
+ </p>
+
+- Data source: select the corresponding data source
+- sql type: supports query and non-query. The query is a select type query, which is returned with a result set. You can specify three templates for email notification as form, attachment or form attachment. Non-queries are returned without a result set, and are for three types of operations: update, delete, and insert.
+- sql parameter: the input parameter format is key1=value1;key2=value2...
+- sql statement: SQL statement
+- UDF function: For data sources of type HIVE, you can refer to UDF functions created in the resource center. UDF functions are not supported for other types of data sources.
+- Custom parameters: SQL task type, and stored procedure is a custom parameter order to set values for the method. The custom parameter type and data type are the same as the stored procedure task type. The difference is that the SQL task type custom parameter will replace the \${variable} in the SQL statement.
+- Pre-sql: Pre-sql is executed before the sql statement.
+- Post-sql: Post-sql is executed after the sql statement.
+
+#### 7.6 SPARK node
+
+- Through the SPARK node, you can directly execute the SPARK program. For the spark node, the worker will use the `spark-submit` method to submit tasks
+
+> Drag in the toolbarThe task node to the drawing board, as shown in the following figure:
+
+<p align="center">
+ <img src="/img/spark-submit-en.png" width="80%" />
+ </p>
+
+- Program type: supports JAVA, Scala and Python three languages
+- The class of the main function: is the full path of the Spark program’s entry Main Class
+- Main jar package: Spark jar package
+- Deployment mode: support three modes of yarn-cluster, yarn-client and local
+- Driver core number: You can set the number of Driver cores and the number of memory
+- Number of Executors: You can set the number of Executors, the number of Executor memory, and the number of Executor cores
+- Command line parameters: Set the input parameters of the Spark program and support the substitution of custom parameter variables.
+- Other parameters: support --jars, --files, --archives, --conf format
+- Resource: If the resource file is referenced in other parameters, you need to select and specify in the resource
+- User-defined parameter: It is a user-defined parameter of the MR part, which will replace the content with \${variable} in the script
+
+Note: JAVA and Scala are only used for identification, there is no difference, if it is Spark developed by Python, there is no main function class, and the others are the same
+
+#### 7.7 MapReduce(MR) node
+
+- Using the MR node, you can directly execute the MR program. For the mr node, the worker will use the `hadoop jar` method to submit tasks
+
+> Drag the  task node in the toolbar to the drawing board, as shown in the following figure:
+
+1. JAVA program
+
+ <p align="center">
+ <img src="/img/mr_java_en.png" width="80%" />
+ </p>
+
+- The class of the main function: is the full path of the Main Class, the entry point of the MR program
+- Program type: select JAVA language
+- Main jar package: is the MR jar package
+- Command line parameters: set the input parameters of the MR program and support the substitution of custom parameter variables
+- Other parameters: support -D, -files, -libjars, -archives format
+- Resource: If the resource file is referenced in other parameters, you need to select and specify in the resource
+- User-defined parameter: It is a user-defined parameter of the MR part, which will replace the content with \${variable} in the script
+
+2. Python program
+
+<p align="center">
+ <img src="/img/mr_edit_en.png" width="80%" />
+ </p>
+
+- Program type: select Python language
+- Main jar package: is the Python jar package for running MR
+- Other parameters: support -D, -mapper, -reducer, -input -output format, here you can set the input of user-defined parameters, such as:
+- -mapper "mapper.py 1" -file mapper.py -reducer reducer.py -file reducer.py –input /journey/words.txt -output /journey/out/mr/\${currentTimeMillis}
+- The mapper.py 1 after -mapper is two parameters, the first parameter is mapper.py, and the second parameter is 1
+- Resource: If the resource file is referenced in other parameters, you need to select and specify in the resource
+- User-defined parameter: It is a user-defined parameter of the MR part, which will replace the content with \${variable} in the script
+
+#### 7.8 Python Node
+
+- Using python nodes, you can directly execute python scripts. For python nodes, workers will use `python **` to submit tasks.
+
+> Drag in the toolbarThe task node to the drawing board, as shown in the following figure:
+
+<p align="center">
+ <img src="/img/python-en.png" width="80%" />
+ </p>
+
+- Script: Python program developed by the user
+- Resources: refers to the list of resource files that need to be called in the script
+- User-defined parameter: It is a local user-defined parameter of Python, which will replace the content with \${variable} in the script
+
+#### 7.9 Flink Node
+
+- Drag in the toolbar<img src="/img/flink.png" width="35"/>The task node to the drawing board, as shown in the following figure:
+
+<p align="center">
+ <img src="/img/flink-en.png" width="80%" />
+</p>
+
+- Program type: supports JAVA, Scala and Python three languages
+- The class of the main function: is the full path of the Main Class, the entry point of the Flink program
+- Main jar package: is the Flink jar package
+- Deployment mode: support three modes of cluster and local
+- Number of slots: You can set the number of slots
+- Number of taskManage: You can set the number of taskManage
+- JobManager memory number: You can set the jobManager memory number
+- TaskManager memory number: You can set the taskManager memory number
+- Command line parameters: Set the input parameters of the Spark program and support the substitution of custom parameter variables.
+- Other parameters: support --jars, --files, --archives, --conf format
+- Resource: If the resource file is referenced in other parameters, you need to select and specify in the resource
+- Custom parameter: It is a local user-defined parameter of Flink, which will replace the content with \${variable} in the script
+
+Note: JAVA and Scala are only used for identification, there is no difference, if it is Flink developed by Python, there is no class of the main function, the others are the same
+
+#### 7.10 http Node
+
+- Drag in the toolbar<img src="/img/http.png" width="35"/>The task node to the drawing board, as shown in the following figure:
+
+<p align="center">
+ <img src="/img/http-en.png" width="80%" />
+ </p>
+
+- Node name: The node name in a workflow definition is unique.
+- Run flag: Identifies whether this node can be scheduled normally, if it does not need to be executed, you can turn on the prohibition switch.
+- Descriptive information: describe the function of the node.
+- Task priority: When the number of worker threads is insufficient, they are executed in order from high to low, and when the priority is the same, they are executed according to the first-in first-out principle.
+- Worker grouping: Tasks are assigned to the machines of the worker group to execute. If Default is selected, a worker machine will be randomly selected for execution.
+- Number of failed retry attempts: The number of times the task failed to be resubmitted. It supports drop-down and hand-filling.
+- Failed retry interval: The time interval for resubmitting the task after a failed task. It supports drop-down and hand-filling.
+- Timeout alarm: Check the timeout alarm and timeout failure. When the task exceeds the "timeout period", an alarm email will be sent and the task execution will fail.
+- Request address: http request URL.
+- Request type: support GET, POSt, HEAD, PUT, DELETE.
Review comment:
```suggestion
- Request type: support GET, POST, HEAD, PUT, DELETE.
```
##########
File path: docs/en-us/1.3.2/user_doc/system-manual.md
##########
@@ -0,0 +1,886 @@
+# System User Manual
+
+## Get started quickly
+
+> Please refer to [Quick Start](quick-start.html)
+
+## Operation guide
+
+### 1. Home
+
+The home page contains task status statistics, process status statistics, and workflow definition statistics for all projects of the user.
+
+<p align="center">
+<img src="/img/home_en.png" width="80%" />
+</p>
+
+### 2. Project management
+
+#### 2.1 Create project
+
+- Click "Project Management" to enter the project management page, click the "Create Project" button, enter the project name, project description, and click "Submit" to create a new project.
+
+ <p align="center">
+ <img src="/img/create_project_en1.png" width="80%" />
+ </p>
+
+#### 2.2 Project home
+
+- Click the project name link on the project management page to enter the project home page, as shown in the figure below, the project home page contains the task status statistics, process status statistics, and workflow definition statistics of the project.
+ <p align="center">
+ <img src="/img/project_home_en.png" width="80%" />
+ </p>
+
+- Task status statistics: within the specified time range, count the number of task instances as successful submission, running, ready to pause, pause, ready to stop, stop, failure, success, fault tolerance, kill, and waiting threads
+- Process status statistics: within the specified time range, count the number of the status of the workflow instance as submission success, running, ready to pause, pause, ready to stop, stop, failure, success, fault tolerance, kill, and waiting threads
+- Workflow definition statistics: Count the workflow definitions created by this user and the workflow definitions granted to this user by the administrator
+
+#### 2.3 Workflow definition
+
+#### <span id=creatDag>2.3.1 Create workflow definition</span>
+
+- Click Project Management -> Workflow -> Workflow Definition to enter the workflow definition page, and click the "Create Workflow" button to enter the **workflow DAG edit** page, as shown in the following figure:
+ <p align="center">
+ <img src="/img/dag5.png" width="80%" />
+ </p>
+- Drag in the toolbar <img src="/img/shell.png" width="35"/> Add a Shell task to the drawing board, as shown in the figure below:
+ <p align="center">
+ <img src="/img/shell-en.png" width="80%" />
+ </p>
+- **Add parameter settings for this shell task:**
+
+1. Fill in the "Node Name", "Description", and "Script" fields;
+2. Check “Normal” for “Run Flag”. If “Prohibit Execution” is checked, the task will not be executed when the workflow runs;
+3. Select "Task Priority": When the number of worker threads is insufficient, high-level tasks will be executed first in the execution queue, and tasks with the same priority will be executed in the order of first in, first out;
+4. Timeout alarm (optional): Check the timeout alarm, timeout failure, and fill in the "timeout period". When the task execution time exceeds **timeout period**, an alert email will be sent and the task timeout fails;
+5. Resources (optional). Resource files are files created or uploaded on the Resource Center -> File Management page. For example, the file name is `test.sh`, and the command to call the resource in the script is `sh test.sh`;
+6. Custom parameters (optional), refer to [Custom Parameters](#UserDefinedParameters);
+7. Click the "Confirm Add" button to save the task settings.
+
+- **Increase the order of task execution:** Click the icon in the upper right corner <img src="/img/line.png" width="35"/> to connect the task; as shown in the figure below, task 2 and task 3 are executed in parallel, When task 1 finished execute, tasks 2 and 3 will be executed simultaneously.
+
+ <p align="center">
+ <img src="/img/dag6.png" width="80%" />
+ </p>
+
+- **Delete dependencies:** Click the "arrow" icon in the upper right corner <img src="/img/arrow.png" width="35"/>, select the connection line, and click the "Delete" icon in the upper right corner <img src= "/img/delete.png" width="35"/>, delete dependencies between tasks.
+ <p align="center">
+ <img src="/img/dag7.png" width="80%" />
+ </p>
+
+- **Save workflow definition:** Click the "Save" button, and the "Set DAG chart name" pop-up box will pop up, as shown in the figure below. Enter the workflow definition name, workflow definition description, and set global parameters (optional, refer to [ Custom parameters](#UserDefinedParameters)), click the "Add" button, and the workflow definition is created successfully.
+ <p align="center">
+ <img src="/img/dag8.png" width="80%" />
+ </p>
+> For other types of tasks, please refer to [Task Node Type and Parameter Settings](#TaskParamers).
+
+#### 2.3.2 Workflow definition operation function
+
+Click Project Management -> Workflow -> Workflow Definition to enter the workflow definition page, as shown below:
+
+<p align="center">
+<img src="/img/work_list_en.png" width="80%" />
+</p>
+The operation functions of the workflow definition list are as follows:
+
+- **Edit:** Only "offline" workflow definitions can be edited. Workflow DAG editing is the same as [Create Workflow Definition](#creatDag).
+- **Online:** When the workflow status is "Offline", used to online workflow. Only the workflow in the "Online" state can run, but cannot be edited.
+- **Offline:** When the workflow status is "Online", used to offline workflow. Only the workflow in the "Offline" state can be edited, but not run.
+- **Run:** Only workflow in the online state can run. See [2.3.3 Run Workflow](#runWorkflow) for the operation steps
+- **Timing:** Timing can only be set in online workflows, and the system automatically schedules the workflow to run on a regular basis. The status after creating a timing is "offline", and the timing must be online on the timing management page to take effect. See [2.3.4 Workflow Timing](#creatTiming) for timing operation steps.
+- **Timing Management:** The timing management page can be edited, online/offline, and deleted.
+- **Delete:** Delete the workflow definition.
+- **Download:** Download workflow definition to local.
+- **Tree Diagram:** Display the task node type and task status in a tree structure, as shown in the figure below:
+ <p align="center">
+ <img src="/img/tree_en.png" width="80%" />
+ </p>
+
+#### <span id=runWorkflow>2.3.3 Run the workflow</span>
+
+- Click Project Management -> Workflow -> Workflow Definition to enter the workflow definition page, as shown in the figure below, click the "Go Online" button <img src="/img/online.png" width="35"/>,Go online workflow.
+ <p align="center">
+ <img src="/img/work_list_en.png" width="80%" />
+ </p>
+
+- Click the "Run" button to pop up the startup parameter setting pop-up box, as shown in the figure below, set the startup parameters, click the "Run" button in the pop-up box, the workflow starts running, and the workflow instance page generates a workflow instance.
+ <p align="center">
+ <img src="/img/run_work_en.png" width="80%" />
+ </p>
+ <span id=runParamers>Description of workflow operating parameters:</span>
+
+ * Failure strategy: When a task node fails to execute, other parallel task nodes need to execute the strategy. "Continue" means: after a certain task fails, other task nodes execute normally; "End" means: terminate all tasks being executed, and terminate the entire process.
+ * Notification strategy: When the process is over, the process execution information notification email is sent according to the process status, including any status is not sent, successful sent, failed sent, successful or failed sent.
+ * Process priority: The priority of process operation, divided into five levels: highest (HIGHEST), high (HIGH), medium (MEDIUM), low (LOW), and lowest (LOWEST). When the number of master threads is insufficient, high-level processes will be executed first in the execution queue, and processes with the same priority will be executed in a first-in first-out order.
+ * Worker group: The process can only be executed in the specified worker machine group. The default is Default, which can be executed on any worker.
+ * Notification group: select notification strategy||timeout alarm||when fault tolerance occurs, process information or email will be sent to all members in the notification group.
+ * Recipient: Select notification policy||Timeout alarm||When fault tolerance occurs, process information or alarm email will be sent to the recipient list.
+ * Cc: Select the notification strategy||Timeout alarm||When fault tolerance occurs, the process information or warning email will be copied to the CC list.
+ * Complement: Two modes including serial complement and parallel complement. Serial complement: within the specified time range, the complement is executed sequentially from the start date to the end date, and only one process instance is generated; parallel complement: within the specified time range, multiple days are complemented at the same time to generate N process instances.
+ * For example, you need to fill in the data from May 1 to May 10.
+
+ <p align="center">
+ <img src="/img/complement_en1.png" width="80%" />
+ </p>
+
+ > Serial mode: The complement is executed sequentially from May 1 to May 10, and a process instance is generated on the process instance page;
+
+ > Parallel mode: The tasks from May 1 to may 10 are executed simultaneously, and 10 process instances are generated on the process instance page.
+
+#### <span id=creatTiming>2.3.4 Workflow timing</span>
+
+- Create timing: Click Project Management->Workflow->Workflow Definition, enter the workflow definition page, go online the workflow, click the "timing" button <img src="/img/timing.png" width="35"/> ,The timing parameter setting dialog box pops up, as shown in the figure below:
+ <p align="center">
+ <img src="/img/time_schedule_en.png" width="80%" />
+ </p>
+- Choose the start and end time. In the start and end time range, the workflow is run at regular intervals; not in the start and end time range, no more regular workflow instances are generated.
+- Add a timing that is executed once every day at 5 AM, as shown in the following figure:
+ <p align="center">
+ <img src="/img/timer-en.png" width="80%" />
+ </p>
+- Failure strategy, notification strategy, process priority, worker group, notification group, recipient, and CC are the same as [workflow running parameters](#runParamers).
+- Click the "Create" button to create the timing successfully. At this time, the timing status is "**Offline**" and the timing needs to be **Online** to take effect.
+- Timing online: Click the "timing management" button <img src="/img/timeManagement.png" width="35"/>, enter the timing management page, click the "online" button, the timing status will change to "online", as shown in the below figure, the workflow takes effect regularly.
+ <p align="center">
+ <img src="/img/time-manage-list-en.png" width="80%" />
+ </p>
+
+#### 2.3.5 Import workflow
+
+Click Project Management -> Workflow -> Workflow Definition to enter the workflow definition page, click the "Import Workflow" button to import the local workflow file, the workflow definition list displays the imported workflow, and the status is offline.
+
+#### 2.4 Workflow instance
+
+#### 2.4.1 View workflow instance
+
+- Click Project Management -> Workflow -> Workflow Instance to enter the Workflow Instance page, as shown in the figure below:
+ <p align="center">
+ <img src="/img/instance-list-en.png" width="80%" />
+ </p>
+- Click the workflow name to enter the DAG view page to view the task execution status, as shown in the figure below.
+ <p align="center">
+ <img src="/img/instance-runs-en.png" width="80%" />
+ </p>
+
+#### 2.4.2 View task log
+
+- Enter the workflow instance page, click the workflow name, enter the DAG view page, double-click the task node, as shown in the following figure:
+ <p align="center">
+ <img src="/img/instanceViewLog-en.png" width="80%" />
+ </p>
+- Click "View Log", a log pop-up box will pop up, as shown in the figure below, the task log can also be viewed on the task instance page, refer to [Task View Log](#taskLog)。
+ <p align="center">
+ <img src="/img/task-log-en.png" width="80%" />
+ </p>
+
+#### 2.4.3 View task history
+
+- Click Project Management -> Workflow -> Workflow Instance to enter the workflow instance page, and click the workflow name to enter the workflow DAG page;
+- Double-click the task node, as shown in the figure below, click "View History" to jump to the task instance page, and display a list of task instances running by the workflow instance
+ <p align="center">
+ <img src="/img/task_history_en.png" width="80%" />
+ </p>
+
+#### 2.4.4 View operating parameters
+
+- Click Project Management -> Workflow -> Workflow Instance to enter the workflow instance page, and click the workflow name to enter the workflow DAG page;
+- Click the icon in the upper left corner <img src="/img/run_params_button.png" width="35"/>,View the startup parameters of the workflow instance; click the icon <img src="/img/global_param.png" width="35"/>,View the global and local parameters of the workflow instance, as shown in the following figure:
+ <p align="center">
+ <img src="/img/run_params_en.png" width="80%" />
+ </p>
+
+#### 2.4.4 Workflow instance operation function
+
+Click Project Management -> Workflow -> Workflow Instance to enter the Workflow Instance page, as shown in the figure below:
+
+ <p align="center">
+ <img src="/img/instance-list-en.png" width="80%" />
+ </p>
+
+- **Edit:** Only terminated processes can be edited. Click the "Edit" button or the name of the workflow instance to enter the DAG edit page. After edit, click the "Save" button to pop up the Save DAG pop-up box, as shown in the figure below. In the pop-up box, check "Whether to update to workflow definition" and save After that, the workflow definition will be updated; if it is not checked, the workflow definition will not be updated.
+ <p align="center">
+ <img src="/img/editDag-en.png" width="80%" />
+ </p>
+- **Rerun:** Re-execute the terminated process.
+- **Recovery failed:** For failed processes, you can perform recovery operations, starting from the failed node.
+- **Stop:** To **stop** the running process, the background will first `kill`worker process, and then execute `kill -9` operation
+- **Pause:** Perform a **pause** operation on the running process, the system status will change to **waiting for execution**, it will wait for the end of the task being executed, and pause the next task to be executed.
+- **Resume pause:** To resume the paused process, start running directly from the **paused node**
+- **Delete:** Delete the workflow instance and the task instance under the workflow instance
+- **Gantt chart:** The vertical axis of the Gantt chart is the topological sorting of task instances under a certain workflow instance, and the horizontal axis is the running time of the task instances, as shown in the figure:
+ <p align="center">
+ <img src="/img/gantt-en.png" width="80%" />
+ </p>
+
+#### 2.5 Task instance
+
+- Click Project Management -> Workflow -> Task Instance to enter the task instance page, as shown in the figure below, click the name of the workflow instance, you can jump to the workflow instance DAG chart to view the task status.
+ <p align="center">
+ <img src="/img/task-list-en.png" width="80%" />
+ </p>
+
+- <span id=taskLog>View log:</span>Click the "view log" button in the operation column to view the log of task execution.
+ <p align="center">
+ <img src="/img/task-log2-en.png" width="80%" />
+ </p>
+
+### 3. Resource Center
+
+#### 3.1 hdfs resource configuration
+
+- Upload resource files and udf functions, all uploaded files and resources will be stored on hdfs, so the following configuration items are required:
+
+```
+
+conf/common/common.properties
+ # Users who have permission to create directories under the HDFS root path
+ hdfs.root.user=hdfs
+ # data base dir, resource file will store to this hadoop hdfs path, self configuration, please make sure the directory exists on hdfs and have read write permissions。"/escheduler" is recommended
+ data.store2hdfs.basepath=/dolphinscheduler
+ # resource upload startup type : HDFS,S3,NONE
+ res.upload.startup.type=HDFS
+ # whether kerberos starts
+ hadoop.security.authentication.startup.state=false
+ # java.security.krb5.conf path
+ java.security.krb5.conf.path=/opt/krb5.conf
+ # loginUserFromKeytab user
+ login.user.keytab.username=hdfs-mycluster@ESZ.COM
+ # loginUserFromKeytab path
+ login.user.keytab.path=/opt/hdfs.headless.keytab
+
+conf/common/hadoop.properties
+ # ha or single namenode,If namenode ha needs to copy core-site.xml and hdfs-site.xml
+ # to the conf directory,support s3,for example : s3a://dolphinscheduler
+ fs.defaultFS=hdfs://mycluster:8020
+ #resourcemanager ha note this need ips , this empty if single
+ yarn.resourcemanager.ha.rm.ids=192.168.xx.xx,192.168.xx.xx
+ # If it is a single resourcemanager, you only need to configure one host name. If it is resourcemanager HA, the default configuration is fine
+ yarn.application.status.address=http://xxxx:8088/ws/v1/cluster/apps/%s
+
+```
+
+- Only one address needs to be configured for yarn.resourcemanager.ha.rm.ids and yarn.application.status.address, and the other address is empty.
+- You need to copy core-site.xml and hdfs-site.xml from the conf directory of the Hadoop cluster to the conf directory of the dolphinscheduler project, and restart the api-server service.
+
+#### 3.2 File management
+
+> It is the management of various resource files, including creating basic txt/log/sh/conf/py/java and other files, uploading jar packages and other types of files, and can do edit, rename, download, delete and other operations.
+
+ <p align="center">
+ <img src="/img/file-manage-en.png" width="80%" />
+ </p>
+
+- Create a file
+ > The file format supports the following types: txt, log, sh, conf, cfg, py, java, sql, xml, hql, properties
+
+<p align="center">
+ <img src="/img/file_create_en.png" width="80%" />
+ </p>
+
+- upload files
+
+> Upload file: Click the "Upload File" button to upload, drag the file to the upload area, the file name will be automatically completed with the uploaded file name
+
+<p align="center">
+ <img src="/img/file-upload-en.png" width="80%" />
+ </p>
+
+- File View
+
+> For the file types that can be viewed, click the file name to view the file details
+
+<p align="center">
+ <img src="/img/file_detail_en.png" width="80%" />
+ </p>
+
+- download file
+
+> Click the "Download" button in the file list to download the file or click the "Download" button in the upper right corner of the file details to download the file
+
+- File rename
+
+<p align="center">
+ <img src="/img/file_rename_en.png" width="80%" />
+ </p>
+
+- delete
+ > File list -> Click the "Delete" button to delete the specified file
+
+#### 3.3 UDF management
+
+#### 3.3.1 Resource management
+
+> The resource management and file management functions are similar. The difference is that the resource management is the uploaded UDF function, and the file management uploads the user program, script and configuration file.
+> Operation function: rename, download, delete.
+
+- Upload udf resources
+ > Same as uploading files.
+
+#### 3.3.2 Function management
+
+- Create UDF function
+ > Click "Create UDF Function", enter the udf function parameters, select the udf resource, and click "Submit" to create the udf function.
+
+> Currently only supports temporary UDF functions of HIVE
+
+- UDF function name: the name when the UDF function is entered
+- Package name Class name: Enter the full path of the UDF function
+- UDF resource: Set the resource file corresponding to the created UDF
+
+<p align="center">
+ <img src="/img/udf_edit_en.png" width="80%" />
+ </p>
+
+### 4. Create data source
+
+> Data source center supports MySQL, POSTGRESQL, HIVE/IMPALA, SPARK, CLICKHOUSE, ORACLE, SQLSERVER and other data sources
+
+#### 4.1 Create/Edit MySQL data source
+
+- Click "Data Source Center -> Create Data Source" to create different types of data sources according to requirements.
+
+- Data source: select MYSQL
+- Data source name: enter the name of the data source
+- Description: Enter a description of the data source
+- IP hostname: enter the IP to connect to MySQL
+- Port: Enter the port to connect to MySQL
+- Username: Set the username for connecting to MySQL
+- Password: Set the password for connecting to MySQL
+- Database name: Enter the name of the database connected to MySQL
+- Jdbc connection parameters: parameter settings for MySQL connection, filled in in JSON form
+
+<p align="center">
+ <img src="/img/mysql-en.png" width="80%" />
+ </p>
+
+> Click "Test Connection" to test whether the data source can be successfully connected.
+
+#### 4.2 Create/Edit POSTGRESQL data source
+
+- Data source: select POSTGRESQL
+- Data source name: enter the name of the data source
+- Description: Enter a description of the data source
+- IP/Host Name: Enter the IP to connect to POSTGRESQL
+- Port: Enter the port to connect to POSTGRESQL
+- Username: Set the username for connecting to POSTGRESQL
+- Password: Set the password for connecting to POSTGRESQL
+- Database name: Enter the name of the database connected to POSTGRESQL
+- Jdbc connection parameters: parameter settings for POSTGRESQL connection, filled in in JSON form
+
+<p align="center">
+ <img src="/img/postgresql-en.png" width="80%" />
+ </p>
+
+#### 4.3 Create/Edit HIVE data source
+
+1.Use HiveServer2 to connect
+
+ <p align="center">
+ <img src="/img/hive-en.png" width="80%" />
+ </p>
+
+- Data source: select HIVE
+- Data source name: enter the name of the data source
+- Description: Enter a description of the data source
+- IP/Host Name: Enter the IP connected to HIVE
+- Port: Enter the port connected to HIVE
+- Username: Set the username for connecting to HIVE
+- Password: Set the password for connecting to HIVE
+- Database name: Enter the name of the database connected to HIVE
+- Jdbc connection parameters: parameter settings for HIVE connection, filled in in JSON form
+
+ 2.Use HiveServer2 HA Zookeeper to connect
+
+ <p align="center">
+ <img src="/img/hive1-en.png" width="80%" />
+ </p>
+
+Note: If you enable **kerberos**, you need to fill in **Principal**
+
+<p align="center">
+ <img src="/img/hive-en.png" width="80%" />
+ </p>
+
+#### 4.4 Create/Edit Spark data source
+
+<p align="center">
+ <img src="/img/spark-en.png" width="80%" />
+ </p>
+
+- Data source: select Spark
+- Data source name: enter the name of the data source
+- Description: Enter a description of the data source
+- IP/Hostname: Enter the IP connected to Spark
+- Port: Enter the port connected to Spark
+- Username: Set the username for connecting to Spark
+- Password: Set the password for connecting to Spark
+- Database name: Enter the name of the database connected to Spark
+- Jdbc connection parameters: parameter settings for Spark connection, filled in in JSON form
+
+### 5. Security Center (Permission System)
+
+ * Only the administrator account in the security center has the authority to operate. It has functions such as queue management, tenant management, user management, alarm group management, worker group management, token management, etc. In the user management module, resources, data sources, projects, etc. Authorization
+ * Administrator login, default user name and password: admin/dolphinscheduler123
+
+#### 5.1 Create queue
+
+- Queue is used when the "queue" parameter is needed to execute programs such as spark and mapreduce.
+- The administrator enters the Security Center->Queue Management page and clicks the "Create Queue" button to create a queue.
+<p align="center">
+ <img src="/img/create-queue-en.png" width="80%" />
+ </p>
+
+#### 5.2 Add tenant
+
+- The tenant corresponds to the Linux user, which is used by the worker to submit the job. If Linux does not have this user, the worker will create this user when executing the script.
+- Tenant Code: **Tenant Code is the only user on Linux and cannot be repeated**
+- The administrator enters the Security Center->Tenant Management page and clicks the "Create Tenant" button to create a tenant.
+
+ <p align="center">
+ <img src="/img/addtenant-en.png" width="80%" />
+ </p>
+
+#### 5.3 Create normal user
+
+- Users are divided into **administrator users** and **normal users**
+
+ - The administrator has authorization and user management authority, but does not have the authority to create project and workflow definition operations.
+ - Ordinary users can create projects and create, edit, and execute workflow definitions.
+ - Note: If the user switches tenants, all resources under the tenant where the user belongs will be copied to the new tenant that is switched.
+
+- The administrator enters the Security Center -> User Management page and clicks the "Create User" button to create a user.
+<p align="center">
+ <img src="/img/user-en.png" width="80%" />
+ </p>
+
+> **Edit user information**
+
+- The administrator enters the Security Center->User Management page and clicks the "Edit" button to edit user information.
+- After an ordinary user logs in, click the user information in the user name drop-down box to enter the user information page, and click the "Edit" button to edit the user information.
+
+> **Modify user password**
+
+- The administrator enters the Security Center->User Management page and clicks the "Edit" button. When editing user information, enter the new password to modify the user password.
+- After a normal user logs in, click the user information in the user name drop-down box to enter the password modification page, enter the password and confirm the password and click the "Edit" button, then the password modification is successful.
+
+#### 5.4 Create alarm group
+
+- The alarm group is a parameter set at startup. After the process ends, the status of the process and other information will be sent to the alarm group in the form of email.
+
+* The administrator enters the Security Center -> Alarm Group Management page and clicks the "Create Alarm Group" button to create an alarm group.
+
+ <p align="center">
+ <img src="/img/mail-en.png" width="80%" />
+
+#### 5.5 Token management
+
+> Since the back-end interface has login check, token management provides a way to perform various operations on the system by calling the interface.
+
+- The administrator enters the Security Center -> Token Management page, clicks the "Create Token" button, selects the expiration time and user, clicks the "Generate Token" button, and clicks the "Submit" button, then the selected user's token is created successfully.
+
+ <p align="center">
+ <img src="/img/create-token-en.png" width="80%" />
+ </p>
+
+ - After an ordinary user logs in, click the user information in the user name drop-down box, enter the token management page, select the expiration time, click the "generate token" button, and click the "submit" button, then the user creates a token successfully.
+ - Call example:
+
+```
+Token call example
+ /**
+ * test token
+ */
+ public void doPOSTParam()throws Exception{
+ // create HttpClient
+ CloseableHttpClient httpclient = HttpClients.createDefault();
+
+ // create http post request
+ HttpPost httpPost = new HttpPost("http://127.0.0.1:12345/escheduler/projects/create");
+ httpPost.setHeader("token", "123");
+ // set parameters
+ List<NameValuePair> parameters = new ArrayList<NameValuePair>();
+ parameters.add(new BasicNameValuePair("projectName", "qzw"));
+ parameters.add(new BasicNameValuePair("desc", "qzw"));
+ UrlEncodedFormEntity formEntity = new UrlEncodedFormEntity(parameters);
+ httpPost.setEntity(formEntity);
+ CloseableHttpResponse response = null;
+ try {
+ // execute
+ response = httpclient.execute(httpPost);
+ // response status code 200
+ if (response.getStatusLine().getStatusCode() == 200) {
+ String content = EntityUtils.toString(response.getEntity(), "UTF-8");
+ System.out.println(content);
+ }
+ } finally {
+ if (response != null) {
+ response.close();
+ }
+ httpclient.close();
+ }
+ }
+```
+
+#### 5.6 Granted permission
+
+ * Granted permissions include project permissions, resource permissions, data source permissions, UDF function permissions.
+ * The administrator can authorize the projects, resources, data sources and UDF functions not created by ordinary users. Because the authorization methods for projects, resources, data sources and UDF functions are the same, we take project authorization as an example.
+ * Note: For projects created by users themselves, the user has all permissions. The project list and the selected project list will not be displayed.
+
+- The administrator enters the Security Center -> User Management page and clicks the "Authorize" button of the user who needs to be authorized, as shown in the figure below:
+ <p align="center">
+ <img src="/img/auth-en.png" width="80%" />
+</p>
+
+- Select the project to authorize the project.
+
+<p align="center">
+ <img src="/img/authproject-en.png" width="80%" />
+ </p>
+
+- Resources, data sources, and UDF function authorization are the same as project authorization.
+
+### 6. monitoring Center
+
+#### 6.1 Service management
+
+- Service management is mainly to monitor and display the health status and basic information of each service in the system
+
+#### 6.1.1 master monitoring
+
+- Mainly related to master information.
+<p align="center">
+ <img src="/img/master-jk-en.png" width="80%" />
+ </p>
+
+#### 6.1.2 worker monitoring
+
+- Mainly related to worker information.
+
+<p align="center">
+ <img src="/img/worker-jk-en.png" width="80%" />
+ </p>
+
+#### 6.1.3 Zookeeper monitoring
+
+- Mainly related configuration information of each worker and master in zookpeeper.
+
+<p align="center">
+ <img src="/img/zookeeper-monitor-en.png" width="80%" />
+ </p>
+
+#### 6.1.4 DB monitoring
+
+- Mainly the health of the DB
+
+<p align="center">
+ <img src="/img/mysql-jk-en.png" width="80%" />
+ </p>
+
+#### 6.2 Statistics management
+
+<p align="center">
+ <img src="/img/statistics-en.png" width="80%" />
+ </p>
+
+- Number of commands to be executed: statistics on the t_ds_command table
+- The number of failed commands: statistics on the t_ds_error_command table
+- Number of tasks to run: Count the data of task_queue in Zookeeper
+- Number of tasks to be killed: Count the data of task_kill in Zookeeper
+
+### 7. <span id=TaskParamers>Task node type and parameter settings</span>
+
+#### 7.1 Shell node
+
+> Shell node, when the worker is executed, a temporary shell script is generated, and the linux user with the same name as the tenant executes the script.
+
+- Click Project Management-Project Name-Workflow Definition, and click the "Create Workflow" button to enter the DAG editing page.
+- Drag <img src="/img/shell.png" width="35"/> from the toolbar to the drawing board, as shown in the figure below:
+
+ <p align="center">
+ <img src="/img/shell-en.png" width="80%" />
+ </p>
+
+- Node name: The node name in a workflow definition is unique.
+- Run flag: Identifies whether this node can be scheduled normally, if it does not need to be executed, you can turn on the prohibition switch.
+- Descriptive information: describe the function of the node.
+- Task priority: When the number of worker threads is insufficient, they are executed in order from high to low, and when the priority is the same, they are executed according to the first-in first-out principle.
+- Worker grouping: Tasks are assigned to the machines of the worker group to execute. If Default is selected, a worker machine will be randomly selected for execution.
+- Number of failed retry attempts: The number of times the task failed to be resubmitted. It supports drop-down and hand-filling.
+- Failed retry interval: The time interval for resubmitting the task after a failed task. It supports drop-down and hand-filling.
+- Timeout alarm: Check the timeout alarm and timeout failure. When the task exceeds the "timeout period", an alarm email will be sent and the task execution will fail.
+- Script: SHELL program developed by users.
+- Resource: Refers to the list of resource files that need to be called in the script, and the files uploaded or created by the resource center-file management.
+- User-defined parameters: It is a user-defined parameter that is part of SHELL, which will replace the content with \${variable} in the script.
+
+#### 7.2 Sub-process node
+
+- The sub-process node is to execute a certain external workflow definition as a task node.
+ > Drag the  task node in the toolbar to the drawing board, as shown in the following figure:
+
+<p align="center">
+ <img src="/img/sub-process-en.png" width="80%" />
+ </p>
+
+- Node name: The node name in a workflow definition is unique
+- Run flag: identify whether this node can be scheduled normally
+- Descriptive information: describe the function of the node
+- Timeout alarm: Check the timeout alarm and timeout failure. When the task exceeds the "timeout period", an alarm email will be sent and the task execution will fail.
+- Sub-node: It is the workflow definition of the selected sub-process. Enter the sub-node in the upper right corner to jump to the workflow definition of the selected sub-process
+
+#### 7.3 DEPENDENT node
+
+- Dependent nodes are **dependency check nodes**. For example, process A depends on the successful execution of process B yesterday, and the dependent node will check whether process B has a successful execution yesterday.
+
+> Drag the  task node in the toolbar to the drawing board, as shown in the following figure:
+
+<p align="center">
+ <img src="/img/dependent-nodes-en.png" width="80%" />
+ </p>
+
+> The dependent node provides a logical judgment function, such as checking whether the B process was successful yesterday, or whether the C process was executed successfully.
+
+ <p align="center">
+ <img src="/img/depend-node-en.png" width="80%" />
+ </p>
+
+> For example, process A is a weekly report task, processes B and C are daily tasks, and task A requires tasks B and C to be successfully executed every day of the last week, as shown in the figure:
+
+ <p align="center">
+ <img src="/img/depend-node1-en.png" width="80%" />
+ </p>
+
+> If the weekly report A also needs to be executed successfully last Tuesday:
+
+ <p align="center">
+ <img src="/img/depend-node3-en.png" width="80%" />
+ </p>
+
+#### 7.4 Stored procedure node
+
+- According to the selected data source, execute the stored procedure.
+ > Drag in the toolbarThe task node to the drawing board, as shown in the following figure:
+
+<p align="center">
+ <img src="/img/procedure-en.png" width="80%" />
+ </p>
+
+- Data source: The data source type of the stored procedure supports MySQL and POSTGRESQL, select the corresponding data source
+- Method: is the method name of the stored procedure
+- Custom parameters: The custom parameter types of the stored procedure support IN and OUT, and the data types support nine data types: VARCHAR, INTEGER, LONG, FLOAT, DOUBLE, DATE, TIME, TIMESTAMP, and BOOLEAN
+
+#### 7.5 SQL node
+
+- Drag in the toolbarTask node into the drawing board
+- Non-query SQL function: edit non-query SQL task information, select non-query for sql type, as shown in the figure below:
+ <p align="center">
+ <img src="/img/sql-en.png" width="80%" />
+</p>
+
+- Query SQL function: Edit and query SQL task information, sql type selection query, select form or attachment to send mail to the specified recipient, as shown in the figure below.
+
+<p align="center">
+ <img src="/img/sql-node-en.png" width="80%" />
+ </p>
+
+- Data source: select the corresponding data source
+- sql type: supports query and non-query. The query is a select type query, which is returned with a result set. You can specify three templates for email notification as form, attachment or form attachment. Non-queries are returned without a result set, and are for three types of operations: update, delete, and insert.
+- sql parameter: the input parameter format is key1=value1;key2=value2...
+- sql statement: SQL statement
+- UDF function: For data sources of type HIVE, you can refer to UDF functions created in the resource center. UDF functions are not supported for other types of data sources.
+- Custom parameters: SQL task type, and stored procedure is a custom parameter order to set values for the method. The custom parameter type and data type are the same as the stored procedure task type. The difference is that the SQL task type custom parameter will replace the \${variable} in the SQL statement.
+- Pre-sql: Pre-sql is executed before the sql statement.
+- Post-sql: Post-sql is executed after the sql statement.
+
+#### 7.6 SPARK node
+
+- Through the SPARK node, you can directly execute the SPARK program. For the spark node, the worker will use the `spark-submit` method to submit tasks
+
+> Drag in the toolbarThe task node to the drawing board, as shown in the following figure:
+
+<p align="center">
+ <img src="/img/spark-submit-en.png" width="80%" />
+ </p>
+
+- Program type: supports JAVA, Scala and Python three languages
+- The class of the main function: is the full path of the Spark program’s entry Main Class
+- Main jar package: Spark jar package
+- Deployment mode: support three modes of yarn-cluster, yarn-client and local
+- Driver core number: You can set the number of Driver cores and the number of memory
+- Number of Executors: You can set the number of Executors, the number of Executor memory, and the number of Executor cores
+- Command line parameters: Set the input parameters of the Spark program and support the substitution of custom parameter variables.
+- Other parameters: support --jars, --files, --archives, --conf format
+- Resource: If the resource file is referenced in other parameters, you need to select and specify in the resource
+- User-defined parameter: It is a user-defined parameter of the MR part, which will replace the content with \${variable} in the script
+
+Note: JAVA and Scala are only used for identification, there is no difference, if it is Spark developed by Python, there is no main function class, and the others are the same
+
+#### 7.7 MapReduce(MR) node
+
+- Using the MR node, you can directly execute the MR program. For the mr node, the worker will use the `hadoop jar` method to submit tasks
+
+> Drag the  task node in the toolbar to the drawing board, as shown in the following figure:
+
+1. JAVA program
+
+ <p align="center">
+ <img src="/img/mr_java_en.png" width="80%" />
+ </p>
+
+- The class of the main function: is the full path of the Main Class, the entry point of the MR program
+- Program type: select JAVA language
+- Main jar package: is the MR jar package
+- Command line parameters: set the input parameters of the MR program and support the substitution of custom parameter variables
+- Other parameters: support -D, -files, -libjars, -archives format
+- Resource: If the resource file is referenced in other parameters, you need to select and specify in the resource
+- User-defined parameter: It is a user-defined parameter of the MR part, which will replace the content with \${variable} in the script
+
+2. Python program
+
+<p align="center">
+ <img src="/img/mr_edit_en.png" width="80%" />
+ </p>
+
+- Program type: select Python language
+- Main jar package: is the Python jar package for running MR
+- Other parameters: support -D, -mapper, -reducer, -input -output format, here you can set the input of user-defined parameters, such as:
+- -mapper "mapper.py 1" -file mapper.py -reducer reducer.py -file reducer.py –input /journey/words.txt -output /journey/out/mr/\${currentTimeMillis}
+- The mapper.py 1 after -mapper is two parameters, the first parameter is mapper.py, and the second parameter is 1
+- Resource: If the resource file is referenced in other parameters, you need to select and specify in the resource
+- User-defined parameter: It is a user-defined parameter of the MR part, which will replace the content with \${variable} in the script
+
+#### 7.8 Python Node
+
+- Using python nodes, you can directly execute python scripts. For python nodes, workers will use `python **` to submit tasks.
+
+> Drag in the toolbarThe task node to the drawing board, as shown in the following figure:
+
+<p align="center">
+ <img src="/img/python-en.png" width="80%" />
+ </p>
+
+- Script: Python program developed by the user
+- Resources: refers to the list of resource files that need to be called in the script
+- User-defined parameter: It is a local user-defined parameter of Python, which will replace the content with \${variable} in the script
+
+#### 7.9 Flink Node
+
+- Drag in the toolbar<img src="/img/flink.png" width="35"/>The task node to the drawing board, as shown in the following figure:
+
+<p align="center">
+ <img src="/img/flink-en.png" width="80%" />
+</p>
+
+- Program type: supports JAVA, Scala and Python three languages
+- The class of the main function: is the full path of the Main Class, the entry point of the Flink program
+- Main jar package: is the Flink jar package
+- Deployment mode: support three modes of cluster and local
+- Number of slots: You can set the number of slots
+- Number of taskManage: You can set the number of taskManage
+- JobManager memory number: You can set the jobManager memory number
+- TaskManager memory number: You can set the taskManager memory number
+- Command line parameters: Set the input parameters of the Spark program and support the substitution of custom parameter variables.
+- Other parameters: support --jars, --files, --archives, --conf format
+- Resource: If the resource file is referenced in other parameters, you need to select and specify in the resource
+- Custom parameter: It is a local user-defined parameter of Flink, which will replace the content with \${variable} in the script
+
+Note: JAVA and Scala are only used for identification, there is no difference, if it is Flink developed by Python, there is no class of the main function, the others are the same
+
+#### 7.10 http Node
+
+- Drag in the toolbar<img src="/img/http.png" width="35"/>The task node to the drawing board, as shown in the following figure:
+
+<p align="center">
+ <img src="/img/http-en.png" width="80%" />
+ </p>
+
+- Node name: The node name in a workflow definition is unique.
+- Run flag: Identifies whether this node can be scheduled normally, if it does not need to be executed, you can turn on the prohibition switch.
+- Descriptive information: describe the function of the node.
+- Task priority: When the number of worker threads is insufficient, they are executed in order from high to low, and when the priority is the same, they are executed according to the first-in first-out principle.
+- Worker grouping: Tasks are assigned to the machines of the worker group to execute. If Default is selected, a worker machine will be randomly selected for execution.
+- Number of failed retry attempts: The number of times the task failed to be resubmitted. It supports drop-down and hand-filling.
+- Failed retry interval: The time interval for resubmitting the task after a failed task. It supports drop-down and hand-filling.
+- Timeout alarm: Check the timeout alarm and timeout failure. When the task exceeds the "timeout period", an alarm email will be sent and the task execution will fail.
+- Request address: http request URL.
+- Request type: support GET, POSt, HEAD, PUT, DELETE.
+- Request parameters: Support Parameter, Body, Headers.
+- Verification conditions: support default response code, custom response code, content included, content not included.
+- Verification content: When the verification condition selects a custom response code, the content contains, and the content does not contain, the verification content is required.
+- Custom parameter: It is a user-defined parameter of http part, which will replace the content with \${variable} in the script.
+
+#### 7.11 DATAX Node
+
+- Drag in the toolbar<img src="/img/datax.png" width="35"/>Task node into the drawing board
+
+ <p align="center">
+ <img src="/img/datax-en.png" width="80%" />
+ </p>
+
+- Custom template: When you turn on the custom template switch, you can customize the content of the json configuration file of the datax node (applicable when the control configuration does not meet the requirements)
+- Data source: select the data source to extract the data
+- sql statement: the sql statement used to extract data from the target database, the sql query column name is automatically parsed when the node is executed, and mapped to the target table synchronization column name. When the source table and target table column names are inconsistent, they can be converted by column alias (as)
+- Target library: select the target library for data synchronization
Review comment:
```suggestion
- Target database: select the target database for data synchronization
```
----------------------------------------------------------------
This is an automated message from the Apache Git Service.
To respond to the message, please log on to GitHub and use the
URL above to go to the specific comment.
For queries about this service, please contact Infrastructure at:
users@infra.apache.org
[GitHub] [incubator-dolphinscheduler-website] dailidong commented on pull request #190: [Feature][Docs] Add English version of "system-manual" to the documentation
Posted by GitBox <gi...@apache.org>.
dailidong commented on pull request #190:
URL: https://github.com/apache/incubator-dolphinscheduler-website/pull/190#issuecomment-708430362


   +1
   good job


----------------------------------------------------------------
This is an automated message from the Apache Git Service.
To respond to the message, please log on to GitHub and use the
URL above to go to the specific comment.

For queries about this service, please contact Infrastructure at:
users@infra.apache.org
[GitHub] [incubator-dolphinscheduler-website] dailidong merged pull request #190: [Feature][Docs] Add English version of "system-manual" to the documentation
Posted by GitBox <gi...@apache.org>.
dailidong merged pull request #190:
URL: https://github.com/apache/incubator-dolphinscheduler-website/pull/190


----------------------------------------------------------------
This is an automated message from the Apache Git Service.
To respond to the message, please log on to GitHub and use the
URL above to go to the specific comment.

For queries about this service, please contact Infrastructure at:
users@infra.apache.org
[GitHub] [incubator-dolphinscheduler-website] AhahaGe commented on a change in pull request #190: [Feature][Docs] Add English version of "system-manual" to the documentation
Posted by GitBox <gi...@apache.org>.
AhahaGe commented on a change in pull request #190:
URL: https://github.com/apache/incubator-dolphinscheduler-website/pull/190#discussion_r503232232


##########
File path: docs/en-us/1.3.2/user_doc/system-manual.md
##########
@@ -0,0 +1,883 @@
+# System User Manual
+
+## Get started quickly
+
+> Please refer to [Quick Start](quick-start.html)
+
+## Operation guide
+
+### 1. Home
+
+The home page contains task status statistics, process status statistics, and workflow definition statistics for all projects of the user.
+
+<p align="center">
+<img src="/img/home_en.png" width="80%" />
+</p>
+
+### 2. Project management
+
+#### 2.1 Create project
+
+- Click "Project Management" to enter the project management page, click the "Create Project" button, enter the project name, project description, and click "Submit" to create a new project.
+
+  <p align="center">
+      <img src="/img/create_project_en1.png" width="80%" />
+  </p>
+
+#### 2.2 Project home
+
+- Click the project name link on the project management page to enter the project home page, as shown in the figure below, the project home page contains the task status statistics, process status statistics, and workflow definition statistics of the project.
+  <p align="center">
+     <img src="/img/project_home_en.png" width="80%" />
+  </p>
+
+- Task status statistics: within the specified time range, count the number of tasks in the task instance as successful submission, running, ready to pause, pause, ready to stop, stop, failure, success, fault tolerance, kill, and waiting threads
+- Process status statistics: within the specified time range, count the number of the status of the workflow instance as submission success, running, ready to pause, pause, ready to stop, stop, failure, success, fault tolerance, kill, and waiting threads
+- Workflow definition statistics: Count the workflow definitions created by users and the workflow definitions granted to this user by the administrator
+
+#### 2.3 Workflow definition
+
+#### <span id=creatDag>2.3.1 Create a workflow definition</span>
+
+- Click Project Management -> Workflow -> Workflow Definition to enter the workflow definition page, and click the "Create Workflow" button to enter the **workflow DAG edit** page, as shown in the following figure:
+  <p align="center">
+      <img src="/img/dag5.png" width="80%" />
+  </p>
+- Drag in the toolbar <img src="/img/shell.png" width="35"/> Add a Shell task to the drawing board, as shown in the figure below:
+  <p align="center">
+      <img src="/img/shell-en.png" width="80%" />
+  </p>
+- **Add parameter settings for shell tasks:**
+
+1. Fill in the "Node Name", "Description", and "Script" fields;
+2. Check “Normal” for “Run Flag”. If “Prohibit Execution” is checked, the task will not be executed when running the workflow;
+3. Select "Task Priority": When the number of worker threads is insufficient, high-level tasks will be executed first in the execution queue, and tasks with the same priority will be executed in the order of first in, first out;
+4. Timeout alarm (not required): Check the timeout alarm, timeout failure, and fill in the "timeout period". When the task execution time exceeds **timeout period**, an alert email will be sent and the task timeout fails;

Review comment:
       not required to optional


----------------------------------------------------------------
This is an automated message from the Apache Git Service.
To respond to the message, please log on to GitHub and use the
URL above to go to the specific comment.

For queries about this service, please contact Infrastructure at:
users@infra.apache.org
[GitHub] [incubator-dolphinscheduler-website] AhahaGe commented on a change in pull request #190: [Feature][Docs] Add English version of "system-manual" to the documentation
Posted by GitBox <gi...@apache.org>.
AhahaGe commented on a change in pull request #190:
URL: https://github.com/apache/incubator-dolphinscheduler-website/pull/190#discussion_r503862565


##########
File path: docs/en-us/1.3.2/user_doc/system-manual.md
##########
@@ -0,0 +1,876 @@
+# System User Manual
+
+## Get started quickly
+
+> Please refer to [Quick Start](quick-start.html)
+
+## Operation guide
+
+### 1. Home
+
+The home page contains task status statistics, process status statistics, and workflow definition statistics for all projects of the user.
+
+<p align="center">
+<img src="/img/home_en.png" width="80%" />
+</p>
+
+### 2. Project management
+
+#### 2.1 Create project
+
+- Click "Project Management" to enter the project management page, click the "Create Project" button, enter the project name, project description, and click "Submit" to create a new project.
+
+  <p align="center">
+      <img src="/img/create_project_en1.png" width="80%" />
+  </p>
+
+#### 2.2 Project home
+
+- Click the project name link on the project management page to enter the project home page, as shown in the figure below, the project home page contains the task status statistics, process status statistics, and workflow definition statistics of the project.
+  <p align="center">
+     <img src="/img/project_home_en.png" width="80%" />
+  </p>
+
+- Task status statistics: within the specified time range, count the number of task instances as successful submission, running, ready to pause, pause, ready to stop, stop, failure, success, fault tolerance, kill, and waiting threads
+- Process status statistics: within the specified time range, count the number of the status of the workflow instance as submission success, running, ready to pause, pause, ready to stop, stop, failure, success, fault tolerance, kill, and waiting threads
+- Workflow definition statistics: Count the workflow definitions created by this user and the workflow definitions granted to this user by the administrator
+
+#### 2.3 Workflow definition
+
+#### <span id=creatDag>2.3.1 Create workflow definition</span>
+
+- Click Project Management -> Workflow -> Workflow Definition to enter the workflow definition page, and click the "Create Workflow" button to enter the **workflow DAG edit** page, as shown in the following figure:
+  <p align="center">
+      <img src="/img/dag5.png" width="80%" />
+  </p>
+- Drag in the toolbar <img src="/img/shell.png" width="35"/> Add a Shell task to the drawing board, as shown in the figure below:
+  <p align="center">
+      <img src="/img/shell-en.png" width="80%" />
+  </p>
+- **Add parameter settings for this shell task:**
+
+1. Fill in the "Node Name", "Description", and "Script" fields;
+2. Check “Normal” for “Run Flag”. If “Prohibit Execution” is checked, the task will not be executed when the workflow runs;
+3. Select "Task Priority": When the number of worker threads is insufficient, high-level tasks will be executed first in the execution queue, and tasks with the same priority will be executed in the order of first in, first out;
+4. Timeout alarm (optional): Check the timeout alarm, timeout failure, and fill in the "timeout period". When the task execution time exceeds **timeout period**, an alert email will be sent and the task timeout fails;
+5. Resources (optional). Resource files are files created or uploaded on the Resource Center -> File Management page. For example, the file name is `test.sh`, and the command to call the resource in the script is `sh test.sh`;
+6. Custom parameters (optional), refer to [Custom Parameters](#UserDefinedParameters);
+7. Click the "Confirm Add" button to save the task settings.
+
+- **Increase the order of task execution:** Click the icon in the upper right corner <img src="/img/line.png" width="35"/> to connect the task; as shown in the figure below, task 2 and task 3 are executed in parallel, When task 1 finished execute, tasks 2 and 3 will be executed simultaneously.
+
+  <p align="center">
+     <img src="/img/dag6.png" width="80%" />
+  </p>
+
+- **Delete dependencies:** Click the "arrow" icon in the upper right corner <img src="/img/arrow.png" width="35"/>, select the connection line, and click the "Delete" icon in the upper right corner <img src= "/img/delete.png" width="35"/>, delete dependencies between tasks.
+  <p align="center">
+     <img src="/img/dag7.png" width="80%" />
+  </p>
+
+- **Save workflow definition:** Click the "Save" button, and the "Set DAG chart name" pop-up box will pop up, as shown in the figure below. Enter the workflow definition name, workflow definition description, and set global parameters (optional, refer to [ Custom parameters](#UserDefinedParameters)), click the "Add" button, and the workflow definition is created successfully.
+  <p align="center">
+     <img src="/img/dag8.png" width="80%" />
+   </p>
+> For other types of tasks, please refer to [Task Node Type and Parameter Settings](#TaskParamers).
+
+#### 2.3.2 Workflow definition operation function
+
+Click Project Management -> Workflow -> Workflow Definition to enter the workflow definition page, as shown below:
+
+<p align="center">
+<img src="/img/work_list_en.png" width="80%" />
+</p>
+The operation functions of the workflow definition list are as follows:
+
+- **Edit:** Only "offline" workflow definitions can be edited. Workflow DAG editing is the same as [Create Workflow Definition](#creatDag).
+- **Online:** When the workflow status is "Offline", used to online workflow. Only the workflow in the "Online" state can run, but cannot be edited.
+- **Offline:** When the workflow status is "Online", used to offline workflow. Only the workflow in the "Offline" state can be edited, but not run.
+- **Run:** Only workflow in the online state can run. See [2.3.3 Run Workflow](#runWorkflow) for the operation steps
+- **Timing:** Timing can only be set in online workflows, and the system automatically schedules the workflow to run on a regular basis. The status after creating a timing is "offline", and the timing must be online on the timing management page to take effect. See [2.3.4 Workflow Timing](#creatTiming) for timing operation steps.
+- **Timing Management:** The timing management page can be edited, online/offline, and deleted.
+- **Delete:** Delete the workflow definition.
+- **Download:** Download workflow definition to local.
+- **Tree Diagram:** Display the task node type and task status in a tree structure, as shown in the figure below:
+  <p align="center">
+      <img src="/img/tree_en.png" width="80%" />
+  </p>
+
+#### <span id=runWorkflow>2.3.3 Run the workflow</span>
+
+- Click Project Management -> Workflow -> Workflow Definition to enter the workflow definition page, as shown in the figure below, click the "Go Online" button <img src="/img/online.png" width="35"/>,Go online workflow.
+  <p align="center">
+      <img src="/img/work_list_en.png" width="80%" />
+  </p>
+
+- Click the "Run" button to pop up the startup parameter setting pop-up box, as shown in the figure below, set the startup parameters, click the "Run" button in the pop-up box, the workflow starts running, and the workflow instance page generates a workflow instance.
+     <p align="center">
+       <img src="/img/run_work_en.png" width="80%" />
+     </p>
+  <span id=runParamers>Description of workflow operating parameters:</span>
+
+      * Failure strategy: When a task node fails to execute, other parallel task nodes need to execute the strategy. "Continue" means: after a certain task fails, other task nodes execute normally; "End" means: terminate all tasks being executed, and terminate the entire process.
+      * Notification strategy: When the process is over, the process execution information notification email is sent according to the process status, including any status is not sent, successful sent, failed sent, successful or failed sent.
+      * Process priority: The priority of process operation, divided into five levels: highest (HIGHEST), high (HIGH), medium (MEDIUM), low (LOW), and lowest (LOWEST). When the number of master threads is insufficient, high-level processes will be executed first in the execution queue, and processes with the same priority will be executed in a first-in first-out order.
+      * Worker group: The process can only be executed in the specified worker machine group. The default is Default, which can be executed on any worker.
+      * Notification group: select notification strategy||timeout alarm||when fault tolerance occurs, process information or email will be sent to all members in the notification group.
+      * Recipient: Select notification policy||Timeout alarm||When fault tolerance occurs, process information or alarm email will be sent to the recipient list.
+      * Cc: Select the notification strategy||Timeout alarm||When fault tolerance occurs, the process information or warning email will be copied to the CC list.
+      * Complement: Two modes including serial complement and parallel complement. Serial complement: within the specified time range, the complement is executed sequentially from the start date to the end date, and only one process instance is generated; parallel complement: within the specified time range, multiple days are complemented at the same time to generate N process instances.
+    * supplement the data from September 19 to October 16
+
+```date not the same as cn version
+    <p align="center">
+        <img src="/img/complement_en.png" width="80%" />
+    </p>
+
+  > Serial mode: The complement is executed sequentially from September 19 to October 16, and a process instance is generated on the process instance page;
+
+  > Parallel mode: The tasks from September 19 to October 16 are executed simultaneously, and 28 process instances are generated on the process instance page.
+
+#### <span id=creatTiming>2.3.4 Workflow timing</span>
+
+- Create timing: Click Project Management->Workflow->Workflow Definition, enter the workflow definition page, go online the workflow, click the "timing" button <img src="/img/timing.png" width="35"/> ,The timing parameter setting dialog box pops up, as shown in the figure below:
+  <p align="center">
+      <img src="/img/time_schedule_en.png" width="80%" />
+  </p>
+- Choose the start and end time. In the start and end time range, the workflow is run at regular intervals; not in the start and end time range, no more regular workflow instances are generated.
+- Add a timing that is executed once every day at 5 AM, as shown in the following figure:
+  <p align="center">
+      <img src="/img/timer-en.png" width="80%" />
+  </p>
+- Failure strategy, notification strategy, process priority, worker group, notification group, recipient, and CC are the same as [workflow running parameters](#runParamers).
+- Click the "Create" button to create the timing successfully. At this time, the timing status is "**Offline**" and the timing needs to be **Online** to take effect.
+- Timing online: Click the "timing management" button <img src="/img/timeManagement.png" width="35"/>, enter the timing management page, click the "online" button, the timing status will change to "online", as shown in the below figure, the workflow takes effect regularly.
+  <p align="center">
+      <img src="/img/time-manage-list-en.png" width="80%" />
+  </p>
+
+#### 2.3.5 Import workflow
+
+Click Project Management -> Workflow -> Workflow Definition to enter the workflow definition page, click the "Import Workflow" button to import the local workflow file, the workflow definition list displays the imported workflow, and the status is offline.
+
+#### 2.4 Workflow example

Review comment:
       ```suggestion
   #### 2.4 Workflow instance
   ```


----------------------------------------------------------------
This is an automated message from the Apache Git Service.
To respond to the message, please log on to GitHub and use the
URL above to go to the specific comment.

For queries about this service, please contact Infrastructure at:
users@infra.apache.org
[GitHub] [incubator-dolphinscheduler-website] AhahaGe commented on a change in pull request #190: [Feature][Docs] Add English version of "system-manual" to the documentation
Posted by GitBox <gi...@apache.org>.
AhahaGe commented on a change in pull request #190:
URL: https://github.com/apache/incubator-dolphinscheduler-website/pull/190#discussion_r503225427


##########
File path: docs/en-us/1.3.2/user_doc/system-manual.md
##########
@@ -0,0 +1,883 @@
+# System User Manual
+
+## Get started quickly
+
+> Please refer to [Quick Start](quick-start.html)
+
+## Operation guide
+
+### 1. Home
+
+The home page contains task status statistics, process status statistics, and workflow definition statistics for all projects of the user.
+
+<p align="center">
+<img src="/img/home_en.png" width="80%" />
+</p>
+
+### 2. Project management
+
+#### 2.1 Create project
+
+- Click "Project Management" to enter the project management page, click the "Create Project" button, enter the project name, project description, and click "Submit" to create a new project.
+
+  <p align="center">
+      <img src="/img/create_project_en1.png" width="80%" />
+  </p>
+
+#### 2.2 Project home
+
+- Click the project name link on the project management page to enter the project home page, as shown in the figure below, the project home page contains the task status statistics, process status statistics, and workflow definition statistics of the project.
+  <p align="center">
+     <img src="/img/project_home_en.png" width="80%" />
+  </p>
+
+- Task status statistics: within the specified time range, count the number of tasks in the task instance as successful submission, running, ready to pause, pause, ready to stop, stop, failure, success, fault tolerance, kill, and waiting threads

Review comment:
       ```suggestion
   - Task status statistics: within the specified time range, count the number of task instances  as successful submission, running, ready to pause, pause, ready to stop, stop, failure, success, fault tolerance, kill, and waiting threads
   ```

##########
File path: docs/en-us/1.3.2/user_doc/system-manual.md
##########
@@ -0,0 +1,883 @@
+# System User Manual
+
+## Get started quickly
+
+> Please refer to [Quick Start](quick-start.html)
+
+## Operation guide
+
+### 1. Home
+
+The home page contains task status statistics, process status statistics, and workflow definition statistics for all projects of the user.
+
+<p align="center">
+<img src="/img/home_en.png" width="80%" />
+</p>
+
+### 2. Project management
+
+#### 2.1 Create project
+
+- Click "Project Management" to enter the project management page, click the "Create Project" button, enter the project name, project description, and click "Submit" to create a new project.
+
+  <p align="center">
+      <img src="/img/create_project_en1.png" width="80%" />
+  </p>
+
+#### 2.2 Project home
+
+- Click the project name link on the project management page to enter the project home page, as shown in the figure below, the project home page contains the task status statistics, process status statistics, and workflow definition statistics of the project.
+  <p align="center">
+     <img src="/img/project_home_en.png" width="80%" />
+  </p>
+
+- Task status statistics: within the specified time range, count the number of tasks in the task instance as successful submission, running, ready to pause, pause, ready to stop, stop, failure, success, fault tolerance, kill, and waiting threads

Review comment:
       ```suggestion
   - Task status statistics: within the specified time range, count the number of task instances as successful submission, running, ready to pause, pause, ready to stop, stop, failure, success, fault tolerance, kill, and waiting threads
   ```


----------------------------------------------------------------
This is an automated message from the Apache Git Service.
To respond to the message, please log on to GitHub and use the
URL above to go to the specific comment.

For queries about this service, please contact Infrastructure at:
users@infra.apache.org
[GitHub] [incubator-dolphinscheduler-website] AhahaGe commented on a change in pull request #190: [Feature][Docs] Add English version of "system-manual" to the documentation
Posted by GitBox <gi...@apache.org>.
AhahaGe commented on a change in pull request #190:
URL: https://github.com/apache/incubator-dolphinscheduler-website/pull/190#discussion_r503862699


##########
File path: docs/en-us/1.3.2/user_doc/system-manual.md
##########
@@ -0,0 +1,876 @@
+# System User Manual
+
+## Get started quickly
+
+> Please refer to [Quick Start](quick-start.html)
+
+## Operation guide
+
+### 1. Home
+
+The home page contains task status statistics, process status statistics, and workflow definition statistics for all projects of the user.
+
+<p align="center">
+<img src="/img/home_en.png" width="80%" />
+</p>
+
+### 2. Project management
+
+#### 2.1 Create project
+
+- Click "Project Management" to enter the project management page, click the "Create Project" button, enter the project name, project description, and click "Submit" to create a new project.
+
+  <p align="center">
+      <img src="/img/create_project_en1.png" width="80%" />
+  </p>
+
+#### 2.2 Project home
+
+- Click the project name link on the project management page to enter the project home page, as shown in the figure below, the project home page contains the task status statistics, process status statistics, and workflow definition statistics of the project.
+  <p align="center">
+     <img src="/img/project_home_en.png" width="80%" />
+  </p>
+
+- Task status statistics: within the specified time range, count the number of task instances as successful submission, running, ready to pause, pause, ready to stop, stop, failure, success, fault tolerance, kill, and waiting threads
+- Process status statistics: within the specified time range, count the number of the status of the workflow instance as submission success, running, ready to pause, pause, ready to stop, stop, failure, success, fault tolerance, kill, and waiting threads
+- Workflow definition statistics: Count the workflow definitions created by this user and the workflow definitions granted to this user by the administrator
+
+#### 2.3 Workflow definition
+
+#### <span id=creatDag>2.3.1 Create workflow definition</span>
+
+- Click Project Management -> Workflow -> Workflow Definition to enter the workflow definition page, and click the "Create Workflow" button to enter the **workflow DAG edit** page, as shown in the following figure:
+  <p align="center">
+      <img src="/img/dag5.png" width="80%" />
+  </p>
+- Drag in the toolbar <img src="/img/shell.png" width="35"/> Add a Shell task to the drawing board, as shown in the figure below:
+  <p align="center">
+      <img src="/img/shell-en.png" width="80%" />
+  </p>
+- **Add parameter settings for this shell task:**
+
+1. Fill in the "Node Name", "Description", and "Script" fields;
+2. Check “Normal” for “Run Flag”. If “Prohibit Execution” is checked, the task will not be executed when the workflow runs;
+3. Select "Task Priority": When the number of worker threads is insufficient, high-level tasks will be executed first in the execution queue, and tasks with the same priority will be executed in the order of first in, first out;
+4. Timeout alarm (optional): Check the timeout alarm, timeout failure, and fill in the "timeout period". When the task execution time exceeds **timeout period**, an alert email will be sent and the task timeout fails;
+5. Resources (optional). Resource files are files created or uploaded on the Resource Center -> File Management page. For example, the file name is `test.sh`, and the command to call the resource in the script is `sh test.sh`;
+6. Custom parameters (optional), refer to [Custom Parameters](#UserDefinedParameters);
+7. Click the "Confirm Add" button to save the task settings.
+
+- **Increase the order of task execution:** Click the icon in the upper right corner <img src="/img/line.png" width="35"/> to connect the task; as shown in the figure below, task 2 and task 3 are executed in parallel, When task 1 finished execute, tasks 2 and 3 will be executed simultaneously.
+
+  <p align="center">
+     <img src="/img/dag6.png" width="80%" />
+  </p>
+
+- **Delete dependencies:** Click the "arrow" icon in the upper right corner <img src="/img/arrow.png" width="35"/>, select the connection line, and click the "Delete" icon in the upper right corner <img src= "/img/delete.png" width="35"/>, delete dependencies between tasks.
+  <p align="center">
+     <img src="/img/dag7.png" width="80%" />
+  </p>
+
+- **Save workflow definition:** Click the "Save" button, and the "Set DAG chart name" pop-up box will pop up, as shown in the figure below. Enter the workflow definition name, workflow definition description, and set global parameters (optional, refer to [ Custom parameters](#UserDefinedParameters)), click the "Add" button, and the workflow definition is created successfully.
+  <p align="center">
+     <img src="/img/dag8.png" width="80%" />
+   </p>
+> For other types of tasks, please refer to [Task Node Type and Parameter Settings](#TaskParamers).
+
+#### 2.3.2 Workflow definition operation function
+
+Click Project Management -> Workflow -> Workflow Definition to enter the workflow definition page, as shown below:
+
+<p align="center">
+<img src="/img/work_list_en.png" width="80%" />
+</p>
+The operation functions of the workflow definition list are as follows:
+
+- **Edit:** Only "offline" workflow definitions can be edited. Workflow DAG editing is the same as [Create Workflow Definition](#creatDag).
+- **Online:** When the workflow status is "Offline", used to online workflow. Only the workflow in the "Online" state can run, but cannot be edited.
+- **Offline:** When the workflow status is "Online", used to offline workflow. Only the workflow in the "Offline" state can be edited, but not run.
+- **Run:** Only workflow in the online state can run. See [2.3.3 Run Workflow](#runWorkflow) for the operation steps
+- **Timing:** Timing can only be set in online workflows, and the system automatically schedules the workflow to run on a regular basis. The status after creating a timing is "offline", and the timing must be online on the timing management page to take effect. See [2.3.4 Workflow Timing](#creatTiming) for timing operation steps.
+- **Timing Management:** The timing management page can be edited, online/offline, and deleted.
+- **Delete:** Delete the workflow definition.
+- **Download:** Download workflow definition to local.
+- **Tree Diagram:** Display the task node type and task status in a tree structure, as shown in the figure below:
+  <p align="center">
+      <img src="/img/tree_en.png" width="80%" />
+  </p>
+
+#### <span id=runWorkflow>2.3.3 Run the workflow</span>
+
+- Click Project Management -> Workflow -> Workflow Definition to enter the workflow definition page, as shown in the figure below, click the "Go Online" button <img src="/img/online.png" width="35"/>,Go online workflow.
+  <p align="center">
+      <img src="/img/work_list_en.png" width="80%" />
+  </p>
+
+- Click the "Run" button to pop up the startup parameter setting pop-up box, as shown in the figure below, set the startup parameters, click the "Run" button in the pop-up box, the workflow starts running, and the workflow instance page generates a workflow instance.
+     <p align="center">
+       <img src="/img/run_work_en.png" width="80%" />
+     </p>
+  <span id=runParamers>Description of workflow operating parameters:</span>
+
+      * Failure strategy: When a task node fails to execute, other parallel task nodes need to execute the strategy. "Continue" means: after a certain task fails, other task nodes execute normally; "End" means: terminate all tasks being executed, and terminate the entire process.
+      * Notification strategy: When the process is over, the process execution information notification email is sent according to the process status, including any status is not sent, successful sent, failed sent, successful or failed sent.
+      * Process priority: The priority of process operation, divided into five levels: highest (HIGHEST), high (HIGH), medium (MEDIUM), low (LOW), and lowest (LOWEST). When the number of master threads is insufficient, high-level processes will be executed first in the execution queue, and processes with the same priority will be executed in a first-in first-out order.
+      * Worker group: The process can only be executed in the specified worker machine group. The default is Default, which can be executed on any worker.
+      * Notification group: select notification strategy||timeout alarm||when fault tolerance occurs, process information or email will be sent to all members in the notification group.
+      * Recipient: Select notification policy||Timeout alarm||When fault tolerance occurs, process information or alarm email will be sent to the recipient list.
+      * Cc: Select the notification strategy||Timeout alarm||When fault tolerance occurs, the process information or warning email will be copied to the CC list.
+      * Complement: Two modes including serial complement and parallel complement. Serial complement: within the specified time range, the complement is executed sequentially from the start date to the end date, and only one process instance is generated; parallel complement: within the specified time range, multiple days are complemented at the same time to generate N process instances.
+    * supplement the data from September 19 to October 16
+
+```date not the same as cn version
+    <p align="center">
+        <img src="/img/complement_en.png" width="80%" />
+    </p>
+
+  > Serial mode: The complement is executed sequentially from September 19 to October 16, and a process instance is generated on the process instance page;
+
+  > Parallel mode: The tasks from September 19 to October 16 are executed simultaneously, and 28 process instances are generated on the process instance page.
+
+#### <span id=creatTiming>2.3.4 Workflow timing</span>
+
+- Create timing: Click Project Management->Workflow->Workflow Definition, enter the workflow definition page, go online the workflow, click the "timing" button <img src="/img/timing.png" width="35"/> ,The timing parameter setting dialog box pops up, as shown in the figure below:
+  <p align="center">
+      <img src="/img/time_schedule_en.png" width="80%" />
+  </p>
+- Choose the start and end time. In the start and end time range, the workflow is run at regular intervals; not in the start and end time range, no more regular workflow instances are generated.
+- Add a timing that is executed once every day at 5 AM, as shown in the following figure:
+  <p align="center">
+      <img src="/img/timer-en.png" width="80%" />
+  </p>
+- Failure strategy, notification strategy, process priority, worker group, notification group, recipient, and CC are the same as [workflow running parameters](#runParamers).
+- Click the "Create" button to create the timing successfully. At this time, the timing status is "**Offline**" and the timing needs to be **Online** to take effect.
+- Timing online: Click the "timing management" button <img src="/img/timeManagement.png" width="35"/>, enter the timing management page, click the "online" button, the timing status will change to "online", as shown in the below figure, the workflow takes effect regularly.
+  <p align="center">
+      <img src="/img/time-manage-list-en.png" width="80%" />
+  </p>
+
+#### 2.3.5 Import workflow
+
+Click Project Management -> Workflow -> Workflow Definition to enter the workflow definition page, click the "Import Workflow" button to import the local workflow file, the workflow definition list displays the imported workflow, and the status is offline.
+
+#### 2.4 Workflow example
+
+#### 2.4.1 View workflow example

Review comment:
       ```suggestion
   #### 2.4.1 View workflow instance
   ```

##########
File path: docs/en-us/1.3.2/user_doc/system-manual.md
##########
@@ -0,0 +1,876 @@
+# System User Manual
+
+## Get started quickly
+
+> Please refer to [Quick Start](quick-start.html)
+
+## Operation guide
+
+### 1. Home
+
+The home page contains task status statistics, process status statistics, and workflow definition statistics for all projects of the user.
+
+<p align="center">
+<img src="/img/home_en.png" width="80%" />
+</p>
+
+### 2. Project management
+
+#### 2.1 Create project
+
+- Click "Project Management" to enter the project management page, click the "Create Project" button, enter the project name, project description, and click "Submit" to create a new project.
+
+  <p align="center">
+      <img src="/img/create_project_en1.png" width="80%" />
+  </p>
+
+#### 2.2 Project home
+
+- Click the project name link on the project management page to enter the project home page, as shown in the figure below, the project home page contains the task status statistics, process status statistics, and workflow definition statistics of the project.
+  <p align="center">
+     <img src="/img/project_home_en.png" width="80%" />
+  </p>
+
+- Task status statistics: within the specified time range, count the number of task instances as successful submission, running, ready to pause, pause, ready to stop, stop, failure, success, fault tolerance, kill, and waiting threads
+- Process status statistics: within the specified time range, count the number of the status of the workflow instance as submission success, running, ready to pause, pause, ready to stop, stop, failure, success, fault tolerance, kill, and waiting threads
+- Workflow definition statistics: Count the workflow definitions created by this user and the workflow definitions granted to this user by the administrator
+
+#### 2.3 Workflow definition
+
+#### <span id=creatDag>2.3.1 Create workflow definition</span>
+
+- Click Project Management -> Workflow -> Workflow Definition to enter the workflow definition page, and click the "Create Workflow" button to enter the **workflow DAG edit** page, as shown in the following figure:
+  <p align="center">
+      <img src="/img/dag5.png" width="80%" />
+  </p>
+- Drag in the toolbar <img src="/img/shell.png" width="35"/> Add a Shell task to the drawing board, as shown in the figure below:
+  <p align="center">
+      <img src="/img/shell-en.png" width="80%" />
+  </p>
+- **Add parameter settings for this shell task:**
+
+1. Fill in the "Node Name", "Description", and "Script" fields;
+2. Check “Normal” for “Run Flag”. If “Prohibit Execution” is checked, the task will not be executed when the workflow runs;
+3. Select "Task Priority": When the number of worker threads is insufficient, high-level tasks will be executed first in the execution queue, and tasks with the same priority will be executed in the order of first in, first out;
+4. Timeout alarm (optional): Check the timeout alarm, timeout failure, and fill in the "timeout period". When the task execution time exceeds **timeout period**, an alert email will be sent and the task timeout fails;
+5. Resources (optional). Resource files are files created or uploaded on the Resource Center -> File Management page. For example, the file name is `test.sh`, and the command to call the resource in the script is `sh test.sh`;
+6. Custom parameters (optional), refer to [Custom Parameters](#UserDefinedParameters);
+7. Click the "Confirm Add" button to save the task settings.
+
+- **Increase the order of task execution:** Click the icon in the upper right corner <img src="/img/line.png" width="35"/> to connect the task; as shown in the figure below, task 2 and task 3 are executed in parallel, When task 1 finished execute, tasks 2 and 3 will be executed simultaneously.
+
+  <p align="center">
+     <img src="/img/dag6.png" width="80%" />
+  </p>
+
+- **Delete dependencies:** Click the "arrow" icon in the upper right corner <img src="/img/arrow.png" width="35"/>, select the connection line, and click the "Delete" icon in the upper right corner <img src= "/img/delete.png" width="35"/>, delete dependencies between tasks.
+  <p align="center">
+     <img src="/img/dag7.png" width="80%" />
+  </p>
+
+- **Save workflow definition:** Click the "Save" button, and the "Set DAG chart name" pop-up box will pop up, as shown in the figure below. Enter the workflow definition name, workflow definition description, and set global parameters (optional, refer to [ Custom parameters](#UserDefinedParameters)), click the "Add" button, and the workflow definition is created successfully.
+  <p align="center">
+     <img src="/img/dag8.png" width="80%" />
+   </p>
+> For other types of tasks, please refer to [Task Node Type and Parameter Settings](#TaskParamers).
+
+#### 2.3.2 Workflow definition operation function
+
+Click Project Management -> Workflow -> Workflow Definition to enter the workflow definition page, as shown below:
+
+<p align="center">
+<img src="/img/work_list_en.png" width="80%" />
+</p>
+The operation functions of the workflow definition list are as follows:
+
+- **Edit:** Only "offline" workflow definitions can be edited. Workflow DAG editing is the same as [Create Workflow Definition](#creatDag).
+- **Online:** When the workflow status is "Offline", used to online workflow. Only the workflow in the "Online" state can run, but cannot be edited.
+- **Offline:** When the workflow status is "Online", used to offline workflow. Only the workflow in the "Offline" state can be edited, but not run.
+- **Run:** Only workflow in the online state can run. See [2.3.3 Run Workflow](#runWorkflow) for the operation steps
+- **Timing:** Timing can only be set in online workflows, and the system automatically schedules the workflow to run on a regular basis. The status after creating a timing is "offline", and the timing must be online on the timing management page to take effect. See [2.3.4 Workflow Timing](#creatTiming) for timing operation steps.
+- **Timing Management:** The timing management page can be edited, online/offline, and deleted.
+- **Delete:** Delete the workflow definition.
+- **Download:** Download workflow definition to local.
+- **Tree Diagram:** Display the task node type and task status in a tree structure, as shown in the figure below:
+  <p align="center">
+      <img src="/img/tree_en.png" width="80%" />
+  </p>
+
+#### <span id=runWorkflow>2.3.3 Run the workflow</span>
+
+- Click Project Management -> Workflow -> Workflow Definition to enter the workflow definition page, as shown in the figure below, click the "Go Online" button <img src="/img/online.png" width="35"/>,Go online workflow.
+  <p align="center">
+      <img src="/img/work_list_en.png" width="80%" />
+  </p>
+
+- Click the "Run" button to pop up the startup parameter setting pop-up box, as shown in the figure below, set the startup parameters, click the "Run" button in the pop-up box, the workflow starts running, and the workflow instance page generates a workflow instance.
+     <p align="center">
+       <img src="/img/run_work_en.png" width="80%" />
+     </p>
+  <span id=runParamers>Description of workflow operating parameters:</span>
+
+      * Failure strategy: When a task node fails to execute, other parallel task nodes need to execute the strategy. "Continue" means: after a certain task fails, other task nodes execute normally; "End" means: terminate all tasks being executed, and terminate the entire process.
+      * Notification strategy: When the process is over, the process execution information notification email is sent according to the process status, including any status is not sent, successful sent, failed sent, successful or failed sent.
+      * Process priority: The priority of process operation, divided into five levels: highest (HIGHEST), high (HIGH), medium (MEDIUM), low (LOW), and lowest (LOWEST). When the number of master threads is insufficient, high-level processes will be executed first in the execution queue, and processes with the same priority will be executed in a first-in first-out order.
+      * Worker group: The process can only be executed in the specified worker machine group. The default is Default, which can be executed on any worker.
+      * Notification group: select notification strategy||timeout alarm||when fault tolerance occurs, process information or email will be sent to all members in the notification group.
+      * Recipient: Select notification policy||Timeout alarm||When fault tolerance occurs, process information or alarm email will be sent to the recipient list.
+      * Cc: Select the notification strategy||Timeout alarm||When fault tolerance occurs, the process information or warning email will be copied to the CC list.
+      * Complement: Two modes including serial complement and parallel complement. Serial complement: within the specified time range, the complement is executed sequentially from the start date to the end date, and only one process instance is generated; parallel complement: within the specified time range, multiple days are complemented at the same time to generate N process instances.
+    * supplement the data from September 19 to October 16
+
+```date not the same as cn version
+    <p align="center">
+        <img src="/img/complement_en.png" width="80%" />
+    </p>
+
+  > Serial mode: The complement is executed sequentially from September 19 to October 16, and a process instance is generated on the process instance page;
+
+  > Parallel mode: The tasks from September 19 to October 16 are executed simultaneously, and 28 process instances are generated on the process instance page.
+
+#### <span id=creatTiming>2.3.4 Workflow timing</span>
+
+- Create timing: Click Project Management->Workflow->Workflow Definition, enter the workflow definition page, go online the workflow, click the "timing" button <img src="/img/timing.png" width="35"/> ,The timing parameter setting dialog box pops up, as shown in the figure below:
+  <p align="center">
+      <img src="/img/time_schedule_en.png" width="80%" />
+  </p>
+- Choose the start and end time. In the start and end time range, the workflow is run at regular intervals; not in the start and end time range, no more regular workflow instances are generated.
+- Add a timing that is executed once every day at 5 AM, as shown in the following figure:
+  <p align="center">
+      <img src="/img/timer-en.png" width="80%" />
+  </p>
+- Failure strategy, notification strategy, process priority, worker group, notification group, recipient, and CC are the same as [workflow running parameters](#runParamers).
+- Click the "Create" button to create the timing successfully. At this time, the timing status is "**Offline**" and the timing needs to be **Online** to take effect.
+- Timing online: Click the "timing management" button <img src="/img/timeManagement.png" width="35"/>, enter the timing management page, click the "online" button, the timing status will change to "online", as shown in the below figure, the workflow takes effect regularly.
+  <p align="center">
+      <img src="/img/time-manage-list-en.png" width="80%" />
+  </p>
+
+#### 2.3.5 Import workflow
+
+Click Project Management -> Workflow -> Workflow Definition to enter the workflow definition page, click the "Import Workflow" button to import the local workflow file, the workflow definition list displays the imported workflow, and the status is offline.
+
+#### 2.4 Workflow example
+
+#### 2.4.1 View workflow example
+
+- Click Project Management -> Workflow -> Workflow Instance to enter the Workflow Instance page, as shown in the figure below:
+     <p align="center">
+        <img src="/img/instance-list-en.png" width="80%" />
+     </p>
+- Click the workflow name to enter the DAG view page to view the task execution status, as shown in the figure below.
+  <p align="center">
+    <img src="/img/instance-runs-en.png" width="80%" />
+  </p>
+
+#### 2.4.2 View task log
+
+- Enter the workflow instance page, click the workflow name, enter the DAG view page, double-click the task node, as shown in the following figure:
+   <p align="center">
+     <img src="/img/instanceViewLog-en.png" width="80%" />
+   </p>
+- Click "View Log", a log pop-up box will pop up, as shown in the figure below, the task log can also be viewed on the task instance page, refer to [Task View Log](#taskLog)。
+   <p align="center">
+     <img src="/img/task-log-en.png" width="80%" />
+   </p>
+
+#### 2.4.3 View task history
+
+- Click Project Management -> Workflow -> Workflow Instance to enter the workflow instance page, and click the workflow name to enter the workflow DAG page;
+- Double-click the task node, as shown in the figure below, click "View History" to jump to the task instance page, and display a list of task instances running by the workflow instance
+   <p align="center">
+     <img src="/img/task_history_en.png" width="80%" />
+   </p>
+
+#### 2.4.4 View operating parameters
+
+- Click Project Management -> Workflow -> Workflow Instance to enter the workflow instance page, and click the workflow name to enter the workflow DAG page;
+- Click the icon in the upper left corner<img src="/img/run_params_button.png" width="35"/>,View the startup parameters of the workflow instance; click the icon<img src="/img/global_param.png" width="35"/>,View the global and local parameters of the workflow instance, as shown in the following figure:

Review comment:
       ```suggestion
   - Click the icon in the upper left corner<img src="/img/run_params_button.png" width="35"/>,View the startup parameters of the workflow instance; click the icon<img src="/img/global_param.png" width="35"/>, View the global and local parameters of the workflow instance, as shown in the following figure:
   ```

##########
File path: docs/en-us/1.3.2/user_doc/system-manual.md
##########
@@ -0,0 +1,876 @@
+# System User Manual
+
+## Get started quickly
+
+> Please refer to [Quick Start](quick-start.html)
+
+## Operation guide
+
+### 1. Home
+
+The home page contains task status statistics, process status statistics, and workflow definition statistics for all projects of the user.
+
+<p align="center">
+<img src="/img/home_en.png" width="80%" />
+</p>
+
+### 2. Project management
+
+#### 2.1 Create project
+
+- Click "Project Management" to enter the project management page, click the "Create Project" button, enter the project name, project description, and click "Submit" to create a new project.
+
+  <p align="center">
+      <img src="/img/create_project_en1.png" width="80%" />
+  </p>
+
+#### 2.2 Project home
+
+- Click the project name link on the project management page to enter the project home page, as shown in the figure below, the project home page contains the task status statistics, process status statistics, and workflow definition statistics of the project.
+  <p align="center">
+     <img src="/img/project_home_en.png" width="80%" />
+  </p>
+
+- Task status statistics: within the specified time range, count the number of task instances as successful submission, running, ready to pause, pause, ready to stop, stop, failure, success, fault tolerance, kill, and waiting threads
+- Process status statistics: within the specified time range, count the number of the status of the workflow instance as submission success, running, ready to pause, pause, ready to stop, stop, failure, success, fault tolerance, kill, and waiting threads
+- Workflow definition statistics: Count the workflow definitions created by this user and the workflow definitions granted to this user by the administrator
+
+#### 2.3 Workflow definition
+
+#### <span id=creatDag>2.3.1 Create workflow definition</span>
+
+- Click Project Management -> Workflow -> Workflow Definition to enter the workflow definition page, and click the "Create Workflow" button to enter the **workflow DAG edit** page, as shown in the following figure:
+  <p align="center">
+      <img src="/img/dag5.png" width="80%" />
+  </p>
+- Drag in the toolbar <img src="/img/shell.png" width="35"/> Add a Shell task to the drawing board, as shown in the figure below:
+  <p align="center">
+      <img src="/img/shell-en.png" width="80%" />
+  </p>
+- **Add parameter settings for this shell task:**
+
+1. Fill in the "Node Name", "Description", and "Script" fields;
+2. Check “Normal” for “Run Flag”. If “Prohibit Execution” is checked, the task will not be executed when the workflow runs;
+3. Select "Task Priority": When the number of worker threads is insufficient, high-level tasks will be executed first in the execution queue, and tasks with the same priority will be executed in the order of first in, first out;
+4. Timeout alarm (optional): Check the timeout alarm, timeout failure, and fill in the "timeout period". When the task execution time exceeds **timeout period**, an alert email will be sent and the task timeout fails;
+5. Resources (optional). Resource files are files created or uploaded on the Resource Center -> File Management page. For example, the file name is `test.sh`, and the command to call the resource in the script is `sh test.sh`;
+6. Custom parameters (optional), refer to [Custom Parameters](#UserDefinedParameters);
+7. Click the "Confirm Add" button to save the task settings.
+
+- **Increase the order of task execution:** Click the icon in the upper right corner <img src="/img/line.png" width="35"/> to connect the task; as shown in the figure below, task 2 and task 3 are executed in parallel, When task 1 finished execute, tasks 2 and 3 will be executed simultaneously.
+
+  <p align="center">
+     <img src="/img/dag6.png" width="80%" />
+  </p>
+
+- **Delete dependencies:** Click the "arrow" icon in the upper right corner <img src="/img/arrow.png" width="35"/>, select the connection line, and click the "Delete" icon in the upper right corner <img src= "/img/delete.png" width="35"/>, delete dependencies between tasks.
+  <p align="center">
+     <img src="/img/dag7.png" width="80%" />
+  </p>
+
+- **Save workflow definition:** Click the "Save" button, and the "Set DAG chart name" pop-up box will pop up, as shown in the figure below. Enter the workflow definition name, workflow definition description, and set global parameters (optional, refer to [ Custom parameters](#UserDefinedParameters)), click the "Add" button, and the workflow definition is created successfully.
+  <p align="center">
+     <img src="/img/dag8.png" width="80%" />
+   </p>
+> For other types of tasks, please refer to [Task Node Type and Parameter Settings](#TaskParamers).
+
+#### 2.3.2 Workflow definition operation function
+
+Click Project Management -> Workflow -> Workflow Definition to enter the workflow definition page, as shown below:
+
+<p align="center">
+<img src="/img/work_list_en.png" width="80%" />
+</p>
+The operation functions of the workflow definition list are as follows:
+
+- **Edit:** Only "offline" workflow definitions can be edited. Workflow DAG editing is the same as [Create Workflow Definition](#creatDag).
+- **Online:** When the workflow status is "Offline", used to online workflow. Only the workflow in the "Online" state can run, but cannot be edited.
+- **Offline:** When the workflow status is "Online", used to offline workflow. Only the workflow in the "Offline" state can be edited, but not run.
+- **Run:** Only workflow in the online state can run. See [2.3.3 Run Workflow](#runWorkflow) for the operation steps
+- **Timing:** Timing can only be set in online workflows, and the system automatically schedules the workflow to run on a regular basis. The status after creating a timing is "offline", and the timing must be online on the timing management page to take effect. See [2.3.4 Workflow Timing](#creatTiming) for timing operation steps.
+- **Timing Management:** The timing management page can be edited, online/offline, and deleted.
+- **Delete:** Delete the workflow definition.
+- **Download:** Download workflow definition to local.
+- **Tree Diagram:** Display the task node type and task status in a tree structure, as shown in the figure below:
+  <p align="center">
+      <img src="/img/tree_en.png" width="80%" />
+  </p>
+
+#### <span id=runWorkflow>2.3.3 Run the workflow</span>
+
+- Click Project Management -> Workflow -> Workflow Definition to enter the workflow definition page, as shown in the figure below, click the "Go Online" button <img src="/img/online.png" width="35"/>,Go online workflow.
+  <p align="center">
+      <img src="/img/work_list_en.png" width="80%" />
+  </p>
+
+- Click the "Run" button to pop up the startup parameter setting pop-up box, as shown in the figure below, set the startup parameters, click the "Run" button in the pop-up box, the workflow starts running, and the workflow instance page generates a workflow instance.
+     <p align="center">
+       <img src="/img/run_work_en.png" width="80%" />
+     </p>
+  <span id=runParamers>Description of workflow operating parameters:</span>
+
+      * Failure strategy: When a task node fails to execute, other parallel task nodes need to execute the strategy. "Continue" means: after a certain task fails, other task nodes execute normally; "End" means: terminate all tasks being executed, and terminate the entire process.
+      * Notification strategy: When the process is over, the process execution information notification email is sent according to the process status, including any status is not sent, successful sent, failed sent, successful or failed sent.
+      * Process priority: The priority of process operation, divided into five levels: highest (HIGHEST), high (HIGH), medium (MEDIUM), low (LOW), and lowest (LOWEST). When the number of master threads is insufficient, high-level processes will be executed first in the execution queue, and processes with the same priority will be executed in a first-in first-out order.
+      * Worker group: The process can only be executed in the specified worker machine group. The default is Default, which can be executed on any worker.
+      * Notification group: select notification strategy||timeout alarm||when fault tolerance occurs, process information or email will be sent to all members in the notification group.
+      * Recipient: Select notification policy||Timeout alarm||When fault tolerance occurs, process information or alarm email will be sent to the recipient list.
+      * Cc: Select the notification strategy||Timeout alarm||When fault tolerance occurs, the process information or warning email will be copied to the CC list.
+      * Complement: Two modes including serial complement and parallel complement. Serial complement: within the specified time range, the complement is executed sequentially from the start date to the end date, and only one process instance is generated; parallel complement: within the specified time range, multiple days are complemented at the same time to generate N process instances.
+    * supplement the data from September 19 to October 16
+
+```date not the same as cn version
+    <p align="center">
+        <img src="/img/complement_en.png" width="80%" />
+    </p>
+
+  > Serial mode: The complement is executed sequentially from September 19 to October 16, and a process instance is generated on the process instance page;
+
+  > Parallel mode: The tasks from September 19 to October 16 are executed simultaneously, and 28 process instances are generated on the process instance page.
+
+#### <span id=creatTiming>2.3.4 Workflow timing</span>
+
+- Create timing: Click Project Management->Workflow->Workflow Definition, enter the workflow definition page, go online the workflow, click the "timing" button <img src="/img/timing.png" width="35"/> ,The timing parameter setting dialog box pops up, as shown in the figure below:
+  <p align="center">
+      <img src="/img/time_schedule_en.png" width="80%" />
+  </p>
+- Choose the start and end time. In the start and end time range, the workflow is run at regular intervals; not in the start and end time range, no more regular workflow instances are generated.
+- Add a timing that is executed once every day at 5 AM, as shown in the following figure:
+  <p align="center">
+      <img src="/img/timer-en.png" width="80%" />
+  </p>
+- Failure strategy, notification strategy, process priority, worker group, notification group, recipient, and CC are the same as [workflow running parameters](#runParamers).
+- Click the "Create" button to create the timing successfully. At this time, the timing status is "**Offline**" and the timing needs to be **Online** to take effect.
+- Timing online: Click the "timing management" button <img src="/img/timeManagement.png" width="35"/>, enter the timing management page, click the "online" button, the timing status will change to "online", as shown in the below figure, the workflow takes effect regularly.
+  <p align="center">
+      <img src="/img/time-manage-list-en.png" width="80%" />
+  </p>
+
+#### 2.3.5 Import workflow
+
+Click Project Management -> Workflow -> Workflow Definition to enter the workflow definition page, click the "Import Workflow" button to import the local workflow file, the workflow definition list displays the imported workflow, and the status is offline.
+
+#### 2.4 Workflow example
+
+#### 2.4.1 View workflow example
+
+- Click Project Management -> Workflow -> Workflow Instance to enter the Workflow Instance page, as shown in the figure below:
+     <p align="center">
+        <img src="/img/instance-list-en.png" width="80%" />
+     </p>
+- Click the workflow name to enter the DAG view page to view the task execution status, as shown in the figure below.
+  <p align="center">
+    <img src="/img/instance-runs-en.png" width="80%" />
+  </p>
+
+#### 2.4.2 View task log
+
+- Enter the workflow instance page, click the workflow name, enter the DAG view page, double-click the task node, as shown in the following figure:
+   <p align="center">
+     <img src="/img/instanceViewLog-en.png" width="80%" />
+   </p>
+- Click "View Log", a log pop-up box will pop up, as shown in the figure below, the task log can also be viewed on the task instance page, refer to [Task View Log](#taskLog)。
+   <p align="center">
+     <img src="/img/task-log-en.png" width="80%" />
+   </p>
+
+#### 2.4.3 View task history
+
+- Click Project Management -> Workflow -> Workflow Instance to enter the workflow instance page, and click the workflow name to enter the workflow DAG page;
+- Double-click the task node, as shown in the figure below, click "View History" to jump to the task instance page, and display a list of task instances running by the workflow instance
+   <p align="center">
+     <img src="/img/task_history_en.png" width="80%" />
+   </p>
+
+#### 2.4.4 View operating parameters
+
+- Click Project Management -> Workflow -> Workflow Instance to enter the workflow instance page, and click the workflow name to enter the workflow DAG page;
+- Click the icon in the upper left corner<img src="/img/run_params_button.png" width="35"/>,View the startup parameters of the workflow instance; click the icon<img src="/img/global_param.png" width="35"/>,View the global and local parameters of the workflow instance, as shown in the following figure:
+   <p align="center">
+     <img src="/img/run_params_en.png" width="80%" />
+   </p>
+
+#### 2.4.4 Workflow instance operation function
+
+Click Project Management -> Workflow -> Workflow Instance to enter the Workflow Instance page, as shown in the figure below:
+
+  <p align="center">
+    <img src="/img/instance-list-en.png" width="80%" />
+  </p>
+
+- **Edit:** Only terminated processes can be edited. Click the "Edit" button or the name of the workflow instance to enter the DAG editing page. After editing, click the "Save" button to pop up the Save DAG pop-up box, as shown in the figure below. In the pop-up box, check "Whether to update to workflow definition" and save After that, the workflow definition will be updated; if it is not checked, the workflow definition will not be updated.
+     <p align="center">
+       <img src="/img/editDag-en.png" width="80%" />
+     </p>
+- **Rerun:** Re-execute the terminated process.
+- **Recovery failed:** For failed processes, you can perform recovery operations, starting from the failed node.
+- **stop:** To **stop** the running process, the background will first `kill`worker process, and then execute `kill -9` operation
+- **Pause:** Perform a **pause** operation on the running process, the system status will change to **waiting for execution**, it will wait for the end of the task being executed, and pause the next task to be executed.
+- **Resume pause:** To resume the paused process, start running directly from the **paused node**
+- **Delete:** Delete the workflow instance and the task instance under the workflow instance
+- **Gantt chart:** The vertical axis of the Gantt chart is the topological sorting of task instances under a certain workflow instance, and the horizontal axis is the running time of the task instances, as shown in the figure:
+     <p align="center">
+         <img src="/img/gantt-en.png" width="80%" />
+     </p>
+
+#### 2.5 Task instance
+
+- Click Project Management -> Workflow -> Task Instance to enter the task instance page, as shown in the figure below, click the name of the workflow instance, you can jump to the workflow instance DAG chart to view the task status.
+     <p align="center">
+        <img src="/img/task-list-en.png" width="80%" />
+     </p>
+
+- <span id=taskLog>View log:</span>Click the "view log" button in the operation column to view the log of task execution.
+     <p align="center">
+        <img src="/img/task-log2-en.png" width="80%" />
+     </p>
+
+### 3. Resource Center
+
+#### 3.1 hdfs resource configuration
+
+- Upload resource files and udf functions, all uploaded files and resources will be stored on hdfs, so the following configuration items are required:
+
+```
+
+conf/common/common.properties # Users who have permission to create directories under the HDFS root path
+hdfs.root.user=hdfs # data base dir, resource file will store to this hadoop hdfs path, self configuration, please make sure the directory exists on hdfs and have read write permissions。"/escheduler" is recommended
+data.store2hdfs.basepath=/dolphinscheduler # resource upload startup type : HDFS,S3,NONE
+res.upload.startup.type=HDFS # whether kerberos starts
+hadoop.security.authentication.startup.state=false # java.security.krb5.conf path

Review comment:
       ```suggestion
   hadoop.security.authentication.startup.state=false
   # java.security.krb5.conf path
   ```

##########
File path: docs/en-us/1.3.2/user_doc/system-manual.md
##########
@@ -0,0 +1,876 @@
+# System User Manual
+
+## Get started quickly
+
+> Please refer to [Quick Start](quick-start.html)
+
+## Operation guide
+
+### 1. Home
+
+The home page contains task status statistics, process status statistics, and workflow definition statistics for all projects of the user.
+
+<p align="center">
+<img src="/img/home_en.png" width="80%" />
+</p>
+
+### 2. Project management
+
+#### 2.1 Create project
+
+- Click "Project Management" to enter the project management page, click the "Create Project" button, enter the project name, project description, and click "Submit" to create a new project.
+
+  <p align="center">
+      <img src="/img/create_project_en1.png" width="80%" />
+  </p>
+
+#### 2.2 Project home
+
+- Click the project name link on the project management page to enter the project home page, as shown in the figure below, the project home page contains the task status statistics, process status statistics, and workflow definition statistics of the project.
+  <p align="center">
+     <img src="/img/project_home_en.png" width="80%" />
+  </p>
+
+- Task status statistics: within the specified time range, count the number of task instances as successful submission, running, ready to pause, pause, ready to stop, stop, failure, success, fault tolerance, kill, and waiting threads
+- Process status statistics: within the specified time range, count the number of the status of the workflow instance as submission success, running, ready to pause, pause, ready to stop, stop, failure, success, fault tolerance, kill, and waiting threads
+- Workflow definition statistics: Count the workflow definitions created by this user and the workflow definitions granted to this user by the administrator
+
+#### 2.3 Workflow definition
+
+#### <span id=creatDag>2.3.1 Create workflow definition</span>
+
+- Click Project Management -> Workflow -> Workflow Definition to enter the workflow definition page, and click the "Create Workflow" button to enter the **workflow DAG edit** page, as shown in the following figure:
+  <p align="center">
+      <img src="/img/dag5.png" width="80%" />
+  </p>
+- Drag in the toolbar <img src="/img/shell.png" width="35"/> Add a Shell task to the drawing board, as shown in the figure below:
+  <p align="center">
+      <img src="/img/shell-en.png" width="80%" />
+  </p>
+- **Add parameter settings for this shell task:**
+
+1. Fill in the "Node Name", "Description", and "Script" fields;
+2. Check “Normal” for “Run Flag”. If “Prohibit Execution” is checked, the task will not be executed when the workflow runs;
+3. Select "Task Priority": When the number of worker threads is insufficient, high-level tasks will be executed first in the execution queue, and tasks with the same priority will be executed in the order of first in, first out;
+4. Timeout alarm (optional): Check the timeout alarm, timeout failure, and fill in the "timeout period". When the task execution time exceeds **timeout period**, an alert email will be sent and the task timeout fails;
+5. Resources (optional). Resource files are files created or uploaded on the Resource Center -> File Management page. For example, the file name is `test.sh`, and the command to call the resource in the script is `sh test.sh`;
+6. Custom parameters (optional), refer to [Custom Parameters](#UserDefinedParameters);
+7. Click the "Confirm Add" button to save the task settings.
+
+- **Increase the order of task execution:** Click the icon in the upper right corner <img src="/img/line.png" width="35"/> to connect the task; as shown in the figure below, task 2 and task 3 are executed in parallel, When task 1 finished execute, tasks 2 and 3 will be executed simultaneously.
+
+  <p align="center">
+     <img src="/img/dag6.png" width="80%" />
+  </p>
+
+- **Delete dependencies:** Click the "arrow" icon in the upper right corner <img src="/img/arrow.png" width="35"/>, select the connection line, and click the "Delete" icon in the upper right corner <img src= "/img/delete.png" width="35"/>, delete dependencies between tasks.
+  <p align="center">
+     <img src="/img/dag7.png" width="80%" />
+  </p>
+
+- **Save workflow definition:** Click the "Save" button, and the "Set DAG chart name" pop-up box will pop up, as shown in the figure below. Enter the workflow definition name, workflow definition description, and set global parameters (optional, refer to [ Custom parameters](#UserDefinedParameters)), click the "Add" button, and the workflow definition is created successfully.
+  <p align="center">
+     <img src="/img/dag8.png" width="80%" />
+   </p>
+> For other types of tasks, please refer to [Task Node Type and Parameter Settings](#TaskParamers).
+
+#### 2.3.2 Workflow definition operation function
+
+Click Project Management -> Workflow -> Workflow Definition to enter the workflow definition page, as shown below:
+
+<p align="center">
+<img src="/img/work_list_en.png" width="80%" />
+</p>
+The operation functions of the workflow definition list are as follows:
+
+- **Edit:** Only "offline" workflow definitions can be edited. Workflow DAG editing is the same as [Create Workflow Definition](#creatDag).
+- **Online:** When the workflow status is "Offline", used to online workflow. Only the workflow in the "Online" state can run, but cannot be edited.
+- **Offline:** When the workflow status is "Online", used to offline workflow. Only the workflow in the "Offline" state can be edited, but not run.
+- **Run:** Only workflow in the online state can run. See [2.3.3 Run Workflow](#runWorkflow) for the operation steps
+- **Timing:** Timing can only be set in online workflows, and the system automatically schedules the workflow to run on a regular basis. The status after creating a timing is "offline", and the timing must be online on the timing management page to take effect. See [2.3.4 Workflow Timing](#creatTiming) for timing operation steps.
+- **Timing Management:** The timing management page can be edited, online/offline, and deleted.
+- **Delete:** Delete the workflow definition.
+- **Download:** Download workflow definition to local.
+- **Tree Diagram:** Display the task node type and task status in a tree structure, as shown in the figure below:
+  <p align="center">
+      <img src="/img/tree_en.png" width="80%" />
+  </p>
+
+#### <span id=runWorkflow>2.3.3 Run the workflow</span>
+
+- Click Project Management -> Workflow -> Workflow Definition to enter the workflow definition page, as shown in the figure below, click the "Go Online" button <img src="/img/online.png" width="35"/>,Go online workflow.
+  <p align="center">
+      <img src="/img/work_list_en.png" width="80%" />
+  </p>
+
+- Click the "Run" button to pop up the startup parameter setting pop-up box, as shown in the figure below, set the startup parameters, click the "Run" button in the pop-up box, the workflow starts running, and the workflow instance page generates a workflow instance.
+     <p align="center">
+       <img src="/img/run_work_en.png" width="80%" />
+     </p>
+  <span id=runParamers>Description of workflow operating parameters:</span>
+
+      * Failure strategy: When a task node fails to execute, other parallel task nodes need to execute the strategy. "Continue" means: after a certain task fails, other task nodes execute normally; "End" means: terminate all tasks being executed, and terminate the entire process.
+      * Notification strategy: When the process is over, the process execution information notification email is sent according to the process status, including any status is not sent, successful sent, failed sent, successful or failed sent.
+      * Process priority: The priority of process operation, divided into five levels: highest (HIGHEST), high (HIGH), medium (MEDIUM), low (LOW), and lowest (LOWEST). When the number of master threads is insufficient, high-level processes will be executed first in the execution queue, and processes with the same priority will be executed in a first-in first-out order.
+      * Worker group: The process can only be executed in the specified worker machine group. The default is Default, which can be executed on any worker.
+      * Notification group: select notification strategy||timeout alarm||when fault tolerance occurs, process information or email will be sent to all members in the notification group.
+      * Recipient: Select notification policy||Timeout alarm||When fault tolerance occurs, process information or alarm email will be sent to the recipient list.
+      * Cc: Select the notification strategy||Timeout alarm||When fault tolerance occurs, the process information or warning email will be copied to the CC list.
+      * Complement: Two modes including serial complement and parallel complement. Serial complement: within the specified time range, the complement is executed sequentially from the start date to the end date, and only one process instance is generated; parallel complement: within the specified time range, multiple days are complemented at the same time to generate N process instances.
+    * supplement the data from September 19 to October 16
+
+```date not the same as cn version
+    <p align="center">
+        <img src="/img/complement_en.png" width="80%" />
+    </p>
+
+  > Serial mode: The complement is executed sequentially from September 19 to October 16, and a process instance is generated on the process instance page;
+
+  > Parallel mode: The tasks from September 19 to October 16 are executed simultaneously, and 28 process instances are generated on the process instance page.
+
+#### <span id=creatTiming>2.3.4 Workflow timing</span>
+
+- Create timing: Click Project Management->Workflow->Workflow Definition, enter the workflow definition page, go online the workflow, click the "timing" button <img src="/img/timing.png" width="35"/> ,The timing parameter setting dialog box pops up, as shown in the figure below:
+  <p align="center">
+      <img src="/img/time_schedule_en.png" width="80%" />
+  </p>
+- Choose the start and end time. In the start and end time range, the workflow is run at regular intervals; not in the start and end time range, no more regular workflow instances are generated.
+- Add a timing that is executed once every day at 5 AM, as shown in the following figure:
+  <p align="center">
+      <img src="/img/timer-en.png" width="80%" />
+  </p>
+- Failure strategy, notification strategy, process priority, worker group, notification group, recipient, and CC are the same as [workflow running parameters](#runParamers).
+- Click the "Create" button to create the timing successfully. At this time, the timing status is "**Offline**" and the timing needs to be **Online** to take effect.
+- Timing online: Click the "timing management" button <img src="/img/timeManagement.png" width="35"/>, enter the timing management page, click the "online" button, the timing status will change to "online", as shown in the below figure, the workflow takes effect regularly.
+  <p align="center">
+      <img src="/img/time-manage-list-en.png" width="80%" />
+  </p>
+
+#### 2.3.5 Import workflow
+
+Click Project Management -> Workflow -> Workflow Definition to enter the workflow definition page, click the "Import Workflow" button to import the local workflow file, the workflow definition list displays the imported workflow, and the status is offline.
+
+#### 2.4 Workflow example
+
+#### 2.4.1 View workflow example
+
+- Click Project Management -> Workflow -> Workflow Instance to enter the Workflow Instance page, as shown in the figure below:
+     <p align="center">
+        <img src="/img/instance-list-en.png" width="80%" />
+     </p>
+- Click the workflow name to enter the DAG view page to view the task execution status, as shown in the figure below.
+  <p align="center">
+    <img src="/img/instance-runs-en.png" width="80%" />
+  </p>
+
+#### 2.4.2 View task log
+
+- Enter the workflow instance page, click the workflow name, enter the DAG view page, double-click the task node, as shown in the following figure:
+   <p align="center">
+     <img src="/img/instanceViewLog-en.png" width="80%" />
+   </p>
+- Click "View Log", a log pop-up box will pop up, as shown in the figure below, the task log can also be viewed on the task instance page, refer to [Task View Log](#taskLog)。
+   <p align="center">
+     <img src="/img/task-log-en.png" width="80%" />
+   </p>
+
+#### 2.4.3 View task history
+
+- Click Project Management -> Workflow -> Workflow Instance to enter the workflow instance page, and click the workflow name to enter the workflow DAG page;
+- Double-click the task node, as shown in the figure below, click "View History" to jump to the task instance page, and display a list of task instances running by the workflow instance
+   <p align="center">
+     <img src="/img/task_history_en.png" width="80%" />
+   </p>
+
+#### 2.4.4 View operating parameters
+
+- Click Project Management -> Workflow -> Workflow Instance to enter the workflow instance page, and click the workflow name to enter the workflow DAG page;
+- Click the icon in the upper left corner<img src="/img/run_params_button.png" width="35"/>,View the startup parameters of the workflow instance; click the icon<img src="/img/global_param.png" width="35"/>,View the global and local parameters of the workflow instance, as shown in the following figure:
+   <p align="center">
+     <img src="/img/run_params_en.png" width="80%" />
+   </p>
+
+#### 2.4.4 Workflow instance operation function
+
+Click Project Management -> Workflow -> Workflow Instance to enter the Workflow Instance page, as shown in the figure below:
+
+  <p align="center">
+    <img src="/img/instance-list-en.png" width="80%" />
+  </p>
+
+- **Edit:** Only terminated processes can be edited. Click the "Edit" button or the name of the workflow instance to enter the DAG editing page. After editing, click the "Save" button to pop up the Save DAG pop-up box, as shown in the figure below. In the pop-up box, check "Whether to update to workflow definition" and save After that, the workflow definition will be updated; if it is not checked, the workflow definition will not be updated.
+     <p align="center">
+       <img src="/img/editDag-en.png" width="80%" />
+     </p>
+- **Rerun:** Re-execute the terminated process.
+- **Recovery failed:** For failed processes, you can perform recovery operations, starting from the failed node.
+- **stop:** To **stop** the running process, the background will first `kill`worker process, and then execute `kill -9` operation
+- **Pause:** Perform a **pause** operation on the running process, the system status will change to **waiting for execution**, it will wait for the end of the task being executed, and pause the next task to be executed.
+- **Resume pause:** To resume the paused process, start running directly from the **paused node**
+- **Delete:** Delete the workflow instance and the task instance under the workflow instance
+- **Gantt chart:** The vertical axis of the Gantt chart is the topological sorting of task instances under a certain workflow instance, and the horizontal axis is the running time of the task instances, as shown in the figure:
+     <p align="center">
+         <img src="/img/gantt-en.png" width="80%" />
+     </p>
+
+#### 2.5 Task instance
+
+- Click Project Management -> Workflow -> Task Instance to enter the task instance page, as shown in the figure below, click the name of the workflow instance, you can jump to the workflow instance DAG chart to view the task status.
+     <p align="center">
+        <img src="/img/task-list-en.png" width="80%" />
+     </p>
+
+- <span id=taskLog>View log:</span>Click the "view log" button in the operation column to view the log of task execution.
+     <p align="center">
+        <img src="/img/task-log2-en.png" width="80%" />
+     </p>
+
+### 3. Resource Center
+
+#### 3.1 hdfs resource configuration
+
+- Upload resource files and udf functions, all uploaded files and resources will be stored on hdfs, so the following configuration items are required:
+
+```
+
+conf/common/common.properties # Users who have permission to create directories under the HDFS root path
+hdfs.root.user=hdfs # data base dir, resource file will store to this hadoop hdfs path, self configuration, please make sure the directory exists on hdfs and have read write permissions。"/escheduler" is recommended
+data.store2hdfs.basepath=/dolphinscheduler # resource upload startup type : HDFS,S3,NONE
+res.upload.startup.type=HDFS # whether kerberos starts
+hadoop.security.authentication.startup.state=false # java.security.krb5.conf path
+java.security.krb5.conf.path=/opt/krb5.conf # loginUserFromKeytab user

Review comment:
       ```suggestion
   java.security.krb5.conf.path=/opt/krb5.conf
   # loginUserFromKeytab user
   ```

##########
File path: docs/en-us/1.3.2/user_doc/system-manual.md
##########
@@ -0,0 +1,876 @@
+# System User Manual
+
+## Get started quickly
+
+> Please refer to [Quick Start](quick-start.html)
+
+## Operation guide
+
+### 1. Home
+
+The home page contains task status statistics, process status statistics, and workflow definition statistics for all projects of the user.
+
+<p align="center">
+<img src="/img/home_en.png" width="80%" />
+</p>
+
+### 2. Project management
+
+#### 2.1 Create project
+
+- Click "Project Management" to enter the project management page, click the "Create Project" button, enter the project name, project description, and click "Submit" to create a new project.
+
+  <p align="center">
+      <img src="/img/create_project_en1.png" width="80%" />
+  </p>
+
+#### 2.2 Project home
+
+- Click the project name link on the project management page to enter the project home page, as shown in the figure below, the project home page contains the task status statistics, process status statistics, and workflow definition statistics of the project.
+  <p align="center">
+     <img src="/img/project_home_en.png" width="80%" />
+  </p>
+
+- Task status statistics: within the specified time range, count the number of task instances as successful submission, running, ready to pause, pause, ready to stop, stop, failure, success, fault tolerance, kill, and waiting threads
+- Process status statistics: within the specified time range, count the number of the status of the workflow instance as submission success, running, ready to pause, pause, ready to stop, stop, failure, success, fault tolerance, kill, and waiting threads
+- Workflow definition statistics: Count the workflow definitions created by this user and the workflow definitions granted to this user by the administrator
+
+#### 2.3 Workflow definition
+
+#### <span id=creatDag>2.3.1 Create workflow definition</span>
+
+- Click Project Management -> Workflow -> Workflow Definition to enter the workflow definition page, and click the "Create Workflow" button to enter the **workflow DAG edit** page, as shown in the following figure:
+  <p align="center">
+      <img src="/img/dag5.png" width="80%" />
+  </p>
+- Drag in the toolbar <img src="/img/shell.png" width="35"/> Add a Shell task to the drawing board, as shown in the figure below:
+  <p align="center">
+      <img src="/img/shell-en.png" width="80%" />
+  </p>
+- **Add parameter settings for this shell task:**
+
+1. Fill in the "Node Name", "Description", and "Script" fields;
+2. Check “Normal” for “Run Flag”. If “Prohibit Execution” is checked, the task will not be executed when the workflow runs;
+3. Select "Task Priority": When the number of worker threads is insufficient, high-level tasks will be executed first in the execution queue, and tasks with the same priority will be executed in the order of first in, first out;
+4. Timeout alarm (optional): Check the timeout alarm, timeout failure, and fill in the "timeout period". When the task execution time exceeds **timeout period**, an alert email will be sent and the task timeout fails;
+5. Resources (optional). Resource files are files created or uploaded on the Resource Center -> File Management page. For example, the file name is `test.sh`, and the command to call the resource in the script is `sh test.sh`;
+6. Custom parameters (optional), refer to [Custom Parameters](#UserDefinedParameters);
+7. Click the "Confirm Add" button to save the task settings.
+
+- **Increase the order of task execution:** Click the icon in the upper right corner <img src="/img/line.png" width="35"/> to connect the task; as shown in the figure below, task 2 and task 3 are executed in parallel, When task 1 finished execute, tasks 2 and 3 will be executed simultaneously.
+
+  <p align="center">
+     <img src="/img/dag6.png" width="80%" />
+  </p>
+
+- **Delete dependencies:** Click the "arrow" icon in the upper right corner <img src="/img/arrow.png" width="35"/>, select the connection line, and click the "Delete" icon in the upper right corner <img src= "/img/delete.png" width="35"/>, delete dependencies between tasks.
+  <p align="center">
+     <img src="/img/dag7.png" width="80%" />
+  </p>
+
+- **Save workflow definition:** Click the "Save" button, and the "Set DAG chart name" pop-up box will pop up, as shown in the figure below. Enter the workflow definition name, workflow definition description, and set global parameters (optional, refer to [ Custom parameters](#UserDefinedParameters)), click the "Add" button, and the workflow definition is created successfully.
+  <p align="center">
+     <img src="/img/dag8.png" width="80%" />
+   </p>
+> For other types of tasks, please refer to [Task Node Type and Parameter Settings](#TaskParamers).
+
+#### 2.3.2 Workflow definition operation function
+
+Click Project Management -> Workflow -> Workflow Definition to enter the workflow definition page, as shown below:
+
+<p align="center">
+<img src="/img/work_list_en.png" width="80%" />
+</p>
+The operation functions of the workflow definition list are as follows:
+
+- **Edit:** Only "offline" workflow definitions can be edited. Workflow DAG editing is the same as [Create Workflow Definition](#creatDag).
+- **Online:** When the workflow status is "Offline", used to online workflow. Only the workflow in the "Online" state can run, but cannot be edited.
+- **Offline:** When the workflow status is "Online", used to offline workflow. Only the workflow in the "Offline" state can be edited, but not run.
+- **Run:** Only workflow in the online state can run. See [2.3.3 Run Workflow](#runWorkflow) for the operation steps
+- **Timing:** Timing can only be set in online workflows, and the system automatically schedules the workflow to run on a regular basis. The status after creating a timing is "offline", and the timing must be online on the timing management page to take effect. See [2.3.4 Workflow Timing](#creatTiming) for timing operation steps.
+- **Timing Management:** The timing management page can be edited, online/offline, and deleted.
+- **Delete:** Delete the workflow definition.
+- **Download:** Download workflow definition to local.
+- **Tree Diagram:** Display the task node type and task status in a tree structure, as shown in the figure below:
+  <p align="center">
+      <img src="/img/tree_en.png" width="80%" />
+  </p>
+
+#### <span id=runWorkflow>2.3.3 Run the workflow</span>
+
+- Click Project Management -> Workflow -> Workflow Definition to enter the workflow definition page, as shown in the figure below, click the "Go Online" button <img src="/img/online.png" width="35"/>,Go online workflow.
+  <p align="center">
+      <img src="/img/work_list_en.png" width="80%" />
+  </p>
+
+- Click the "Run" button to pop up the startup parameter setting pop-up box, as shown in the figure below, set the startup parameters, click the "Run" button in the pop-up box, the workflow starts running, and the workflow instance page generates a workflow instance.
+     <p align="center">
+       <img src="/img/run_work_en.png" width="80%" />
+     </p>
+  <span id=runParamers>Description of workflow operating parameters:</span>
+
+      * Failure strategy: When a task node fails to execute, other parallel task nodes need to execute the strategy. "Continue" means: after a certain task fails, other task nodes execute normally; "End" means: terminate all tasks being executed, and terminate the entire process.
+      * Notification strategy: When the process is over, the process execution information notification email is sent according to the process status, including any status is not sent, successful sent, failed sent, successful or failed sent.
+      * Process priority: The priority of process operation, divided into five levels: highest (HIGHEST), high (HIGH), medium (MEDIUM), low (LOW), and lowest (LOWEST). When the number of master threads is insufficient, high-level processes will be executed first in the execution queue, and processes with the same priority will be executed in a first-in first-out order.
+      * Worker group: The process can only be executed in the specified worker machine group. The default is Default, which can be executed on any worker.
+      * Notification group: select notification strategy||timeout alarm||when fault tolerance occurs, process information or email will be sent to all members in the notification group.
+      * Recipient: Select notification policy||Timeout alarm||When fault tolerance occurs, process information or alarm email will be sent to the recipient list.
+      * Cc: Select the notification strategy||Timeout alarm||When fault tolerance occurs, the process information or warning email will be copied to the CC list.
+      * Complement: Two modes including serial complement and parallel complement. Serial complement: within the specified time range, the complement is executed sequentially from the start date to the end date, and only one process instance is generated; parallel complement: within the specified time range, multiple days are complemented at the same time to generate N process instances.
+    * supplement the data from September 19 to October 16
+
+```date not the same as cn version
+    <p align="center">
+        <img src="/img/complement_en.png" width="80%" />
+    </p>
+
+  > Serial mode: The complement is executed sequentially from September 19 to October 16, and a process instance is generated on the process instance page;
+
+  > Parallel mode: The tasks from September 19 to October 16 are executed simultaneously, and 28 process instances are generated on the process instance page.
+
+#### <span id=creatTiming>2.3.4 Workflow timing</span>
+
+- Create timing: Click Project Management->Workflow->Workflow Definition, enter the workflow definition page, go online the workflow, click the "timing" button <img src="/img/timing.png" width="35"/> ,The timing parameter setting dialog box pops up, as shown in the figure below:
+  <p align="center">
+      <img src="/img/time_schedule_en.png" width="80%" />
+  </p>
+- Choose the start and end time. In the start and end time range, the workflow is run at regular intervals; not in the start and end time range, no more regular workflow instances are generated.
+- Add a timing that is executed once every day at 5 AM, as shown in the following figure:
+  <p align="center">
+      <img src="/img/timer-en.png" width="80%" />
+  </p>
+- Failure strategy, notification strategy, process priority, worker group, notification group, recipient, and CC are the same as [workflow running parameters](#runParamers).
+- Click the "Create" button to create the timing successfully. At this time, the timing status is "**Offline**" and the timing needs to be **Online** to take effect.
+- Timing online: Click the "timing management" button <img src="/img/timeManagement.png" width="35"/>, enter the timing management page, click the "online" button, the timing status will change to "online", as shown in the below figure, the workflow takes effect regularly.
+  <p align="center">
+      <img src="/img/time-manage-list-en.png" width="80%" />
+  </p>
+
+#### 2.3.5 Import workflow
+
+Click Project Management -> Workflow -> Workflow Definition to enter the workflow definition page, click the "Import Workflow" button to import the local workflow file, the workflow definition list displays the imported workflow, and the status is offline.
+
+#### 2.4 Workflow example
+
+#### 2.4.1 View workflow example
+
+- Click Project Management -> Workflow -> Workflow Instance to enter the Workflow Instance page, as shown in the figure below:
+     <p align="center">
+        <img src="/img/instance-list-en.png" width="80%" />
+     </p>
+- Click the workflow name to enter the DAG view page to view the task execution status, as shown in the figure below.
+  <p align="center">
+    <img src="/img/instance-runs-en.png" width="80%" />
+  </p>
+
+#### 2.4.2 View task log
+
+- Enter the workflow instance page, click the workflow name, enter the DAG view page, double-click the task node, as shown in the following figure:
+   <p align="center">
+     <img src="/img/instanceViewLog-en.png" width="80%" />
+   </p>
+- Click "View Log", a log pop-up box will pop up, as shown in the figure below, the task log can also be viewed on the task instance page, refer to [Task View Log](#taskLog)。
+   <p align="center">
+     <img src="/img/task-log-en.png" width="80%" />
+   </p>
+
+#### 2.4.3 View task history
+
+- Click Project Management -> Workflow -> Workflow Instance to enter the workflow instance page, and click the workflow name to enter the workflow DAG page;
+- Double-click the task node, as shown in the figure below, click "View History" to jump to the task instance page, and display a list of task instances running by the workflow instance
+   <p align="center">
+     <img src="/img/task_history_en.png" width="80%" />
+   </p>
+
+#### 2.4.4 View operating parameters
+
+- Click Project Management -> Workflow -> Workflow Instance to enter the workflow instance page, and click the workflow name to enter the workflow DAG page;
+- Click the icon in the upper left corner<img src="/img/run_params_button.png" width="35"/>,View the startup parameters of the workflow instance; click the icon<img src="/img/global_param.png" width="35"/>,View the global and local parameters of the workflow instance, as shown in the following figure:
+   <p align="center">
+     <img src="/img/run_params_en.png" width="80%" />
+   </p>
+
+#### 2.4.4 Workflow instance operation function
+
+Click Project Management -> Workflow -> Workflow Instance to enter the Workflow Instance page, as shown in the figure below:
+
+  <p align="center">
+    <img src="/img/instance-list-en.png" width="80%" />
+  </p>
+
+- **Edit:** Only terminated processes can be edited. Click the "Edit" button or the name of the workflow instance to enter the DAG editing page. After editing, click the "Save" button to pop up the Save DAG pop-up box, as shown in the figure below. In the pop-up box, check "Whether to update to workflow definition" and save After that, the workflow definition will be updated; if it is not checked, the workflow definition will not be updated.
+     <p align="center">
+       <img src="/img/editDag-en.png" width="80%" />
+     </p>
+- **Rerun:** Re-execute the terminated process.
+- **Recovery failed:** For failed processes, you can perform recovery operations, starting from the failed node.
+- **stop:** To **stop** the running process, the background will first `kill`worker process, and then execute `kill -9` operation
+- **Pause:** Perform a **pause** operation on the running process, the system status will change to **waiting for execution**, it will wait for the end of the task being executed, and pause the next task to be executed.
+- **Resume pause:** To resume the paused process, start running directly from the **paused node**
+- **Delete:** Delete the workflow instance and the task instance under the workflow instance
+- **Gantt chart:** The vertical axis of the Gantt chart is the topological sorting of task instances under a certain workflow instance, and the horizontal axis is the running time of the task instances, as shown in the figure:
+     <p align="center">
+         <img src="/img/gantt-en.png" width="80%" />
+     </p>
+
+#### 2.5 Task instance
+
+- Click Project Management -> Workflow -> Task Instance to enter the task instance page, as shown in the figure below, click the name of the workflow instance, you can jump to the workflow instance DAG chart to view the task status.
+     <p align="center">
+        <img src="/img/task-list-en.png" width="80%" />
+     </p>
+
+- <span id=taskLog>View log:</span>Click the "view log" button in the operation column to view the log of task execution.
+     <p align="center">
+        <img src="/img/task-log2-en.png" width="80%" />
+     </p>
+
+### 3. Resource Center
+
+#### 3.1 hdfs resource configuration
+
+- Upload resource files and udf functions, all uploaded files and resources will be stored on hdfs, so the following configuration items are required:
+
+```
+
+conf/common/common.properties # Users who have permission to create directories under the HDFS root path
+hdfs.root.user=hdfs # data base dir, resource file will store to this hadoop hdfs path, self configuration, please make sure the directory exists on hdfs and have read write permissions。"/escheduler" is recommended
+data.store2hdfs.basepath=/dolphinscheduler # resource upload startup type : HDFS,S3,NONE
+res.upload.startup.type=HDFS # whether kerberos starts
+hadoop.security.authentication.startup.state=false # java.security.krb5.conf path
+java.security.krb5.conf.path=/opt/krb5.conf # loginUserFromKeytab user
+login.user.keytab.username=hdfs-mycluster@ESZ.COM # loginUserFromKeytab path
+login.user.keytab.path=/opt/hdfs.headless.keytab
+
+conf/common/hadoop.properties # ha or single namenode,If namenode ha needs to copy core-site.xml and hdfs-site.xml # to the conf directory,support s3,for example : s3a://dolphinscheduler
+fs.defaultFS=hdfs://mycluster:8020
+#resourcemanager ha note this need ips , this empty if single
+yarn.resourcemanager.ha.rm.ids=192.168.xx.xx,192.168.xx.xx # If it is a single resourcemanager, you only need to configure one host name. If it is resourcemanager HA, the default configuration is fine
+yarn.application.status.address=http://xxxx:8088/ws/v1/cluster/apps/%s
+
+````
+
+- Only one address needs to be configured for yarn.resourcemanager.ha.rm.ids and yarn.application.status.address, and the other address is empty.
+- You need to copy core-site.xml and hdfs-site.xml from the conf directory of the Hadoop cluster to the conf directory of the dolphinscheduler project, and restart the api-server service.
+
+#### 3.2 File management
+
+> It is the management of various resource files, including creating basic txt/log/sh/conf/py/java and other files, uploading jar packages and other types of files, which can be edited, renamed, downloaded, deleted and other operations.

Review comment:
       ```suggestion
   > It is the management of various resource files, including creating basic txt/log/sh/conf/py/java and other files, uploading jar packages and other types of files, and can do edit, rename, download, delete and other operations.
   ```

##########
File path: docs/en-us/1.3.2/user_doc/system-manual.md
##########
@@ -0,0 +1,876 @@
+# System User Manual
+
+## Get started quickly
+
+> Please refer to [Quick Start](quick-start.html)
+
+## Operation guide
+
+### 1. Home
+
+The home page contains task status statistics, process status statistics, and workflow definition statistics for all projects of the user.
+
+<p align="center">
+<img src="/img/home_en.png" width="80%" />
+</p>
+
+### 2. Project management
+
+#### 2.1 Create project
+
+- Click "Project Management" to enter the project management page, click the "Create Project" button, enter the project name, project description, and click "Submit" to create a new project.
+
+  <p align="center">
+      <img src="/img/create_project_en1.png" width="80%" />
+  </p>
+
+#### 2.2 Project home
+
+- Click the project name link on the project management page to enter the project home page, as shown in the figure below, the project home page contains the task status statistics, process status statistics, and workflow definition statistics of the project.
+  <p align="center">
+     <img src="/img/project_home_en.png" width="80%" />
+  </p>
+
+- Task status statistics: within the specified time range, count the number of task instances as successful submission, running, ready to pause, pause, ready to stop, stop, failure, success, fault tolerance, kill, and waiting threads
+- Process status statistics: within the specified time range, count the number of the status of the workflow instance as submission success, running, ready to pause, pause, ready to stop, stop, failure, success, fault tolerance, kill, and waiting threads
+- Workflow definition statistics: Count the workflow definitions created by this user and the workflow definitions granted to this user by the administrator
+
+#### 2.3 Workflow definition
+
+#### <span id=creatDag>2.3.1 Create workflow definition</span>
+
+- Click Project Management -> Workflow -> Workflow Definition to enter the workflow definition page, and click the "Create Workflow" button to enter the **workflow DAG edit** page, as shown in the following figure:
+  <p align="center">
+      <img src="/img/dag5.png" width="80%" />
+  </p>
+- Drag in the toolbar <img src="/img/shell.png" width="35"/> Add a Shell task to the drawing board, as shown in the figure below:
+  <p align="center">
+      <img src="/img/shell-en.png" width="80%" />
+  </p>
+- **Add parameter settings for this shell task:**
+
+1. Fill in the "Node Name", "Description", and "Script" fields;
+2. Check “Normal” for “Run Flag”. If “Prohibit Execution” is checked, the task will not be executed when the workflow runs;
+3. Select "Task Priority": When the number of worker threads is insufficient, high-level tasks will be executed first in the execution queue, and tasks with the same priority will be executed in the order of first in, first out;
+4. Timeout alarm (optional): Check the timeout alarm, timeout failure, and fill in the "timeout period". When the task execution time exceeds **timeout period**, an alert email will be sent and the task timeout fails;
+5. Resources (optional). Resource files are files created or uploaded on the Resource Center -> File Management page. For example, the file name is `test.sh`, and the command to call the resource in the script is `sh test.sh`;
+6. Custom parameters (optional), refer to [Custom Parameters](#UserDefinedParameters);
+7. Click the "Confirm Add" button to save the task settings.
+
+- **Increase the order of task execution:** Click the icon in the upper right corner <img src="/img/line.png" width="35"/> to connect the task; as shown in the figure below, task 2 and task 3 are executed in parallel, When task 1 finished execute, tasks 2 and 3 will be executed simultaneously.
+
+  <p align="center">
+     <img src="/img/dag6.png" width="80%" />
+  </p>
+
+- **Delete dependencies:** Click the "arrow" icon in the upper right corner <img src="/img/arrow.png" width="35"/>, select the connection line, and click the "Delete" icon in the upper right corner <img src= "/img/delete.png" width="35"/>, delete dependencies between tasks.
+  <p align="center">
+     <img src="/img/dag7.png" width="80%" />
+  </p>
+
+- **Save workflow definition:** Click the "Save" button, and the "Set DAG chart name" pop-up box will pop up, as shown in the figure below. Enter the workflow definition name, workflow definition description, and set global parameters (optional, refer to [ Custom parameters](#UserDefinedParameters)), click the "Add" button, and the workflow definition is created successfully.
+  <p align="center">
+     <img src="/img/dag8.png" width="80%" />
+   </p>
+> For other types of tasks, please refer to [Task Node Type and Parameter Settings](#TaskParamers).
+
+#### 2.3.2 Workflow definition operation function
+
+Click Project Management -> Workflow -> Workflow Definition to enter the workflow definition page, as shown below:
+
+<p align="center">
+<img src="/img/work_list_en.png" width="80%" />
+</p>
+The operation functions of the workflow definition list are as follows:
+
+- **Edit:** Only "offline" workflow definitions can be edited. Workflow DAG editing is the same as [Create Workflow Definition](#creatDag).
+- **Online:** When the workflow status is "Offline", used to online workflow. Only the workflow in the "Online" state can run, but cannot be edited.
+- **Offline:** When the workflow status is "Online", used to offline workflow. Only the workflow in the "Offline" state can be edited, but not run.
+- **Run:** Only workflow in the online state can run. See [2.3.3 Run Workflow](#runWorkflow) for the operation steps
+- **Timing:** Timing can only be set in online workflows, and the system automatically schedules the workflow to run on a regular basis. The status after creating a timing is "offline", and the timing must be online on the timing management page to take effect. See [2.3.4 Workflow Timing](#creatTiming) for timing operation steps.
+- **Timing Management:** The timing management page can be edited, online/offline, and deleted.
+- **Delete:** Delete the workflow definition.
+- **Download:** Download workflow definition to local.
+- **Tree Diagram:** Display the task node type and task status in a tree structure, as shown in the figure below:
+  <p align="center">
+      <img src="/img/tree_en.png" width="80%" />
+  </p>
+
+#### <span id=runWorkflow>2.3.3 Run the workflow</span>
+
+- Click Project Management -> Workflow -> Workflow Definition to enter the workflow definition page, as shown in the figure below, click the "Go Online" button <img src="/img/online.png" width="35"/>,Go online workflow.
+  <p align="center">
+      <img src="/img/work_list_en.png" width="80%" />
+  </p>
+
+- Click the "Run" button to pop up the startup parameter setting pop-up box, as shown in the figure below, set the startup parameters, click the "Run" button in the pop-up box, the workflow starts running, and the workflow instance page generates a workflow instance.
+     <p align="center">
+       <img src="/img/run_work_en.png" width="80%" />
+     </p>
+  <span id=runParamers>Description of workflow operating parameters:</span>
+
+      * Failure strategy: When a task node fails to execute, other parallel task nodes need to execute the strategy. "Continue" means: after a certain task fails, other task nodes execute normally; "End" means: terminate all tasks being executed, and terminate the entire process.
+      * Notification strategy: When the process is over, the process execution information notification email is sent according to the process status, including any status is not sent, successful sent, failed sent, successful or failed sent.
+      * Process priority: The priority of process operation, divided into five levels: highest (HIGHEST), high (HIGH), medium (MEDIUM), low (LOW), and lowest (LOWEST). When the number of master threads is insufficient, high-level processes will be executed first in the execution queue, and processes with the same priority will be executed in a first-in first-out order.
+      * Worker group: The process can only be executed in the specified worker machine group. The default is Default, which can be executed on any worker.
+      * Notification group: select notification strategy||timeout alarm||when fault tolerance occurs, process information or email will be sent to all members in the notification group.
+      * Recipient: Select notification policy||Timeout alarm||When fault tolerance occurs, process information or alarm email will be sent to the recipient list.
+      * Cc: Select the notification strategy||Timeout alarm||When fault tolerance occurs, the process information or warning email will be copied to the CC list.
+      * Complement: Two modes including serial complement and parallel complement. Serial complement: within the specified time range, the complement is executed sequentially from the start date to the end date, and only one process instance is generated; parallel complement: within the specified time range, multiple days are complemented at the same time to generate N process instances.
+    * supplement the data from September 19 to October 16
+
+```date not the same as cn version
+    <p align="center">
+        <img src="/img/complement_en.png" width="80%" />
+    </p>
+
+  > Serial mode: The complement is executed sequentially from September 19 to October 16, and a process instance is generated on the process instance page;
+
+  > Parallel mode: The tasks from September 19 to October 16 are executed simultaneously, and 28 process instances are generated on the process instance page.
+
+#### <span id=creatTiming>2.3.4 Workflow timing</span>
+
+- Create timing: Click Project Management->Workflow->Workflow Definition, enter the workflow definition page, go online the workflow, click the "timing" button <img src="/img/timing.png" width="35"/> ,The timing parameter setting dialog box pops up, as shown in the figure below:
+  <p align="center">
+      <img src="/img/time_schedule_en.png" width="80%" />
+  </p>
+- Choose the start and end time. In the start and end time range, the workflow is run at regular intervals; not in the start and end time range, no more regular workflow instances are generated.
+- Add a timing that is executed once every day at 5 AM, as shown in the following figure:
+  <p align="center">
+      <img src="/img/timer-en.png" width="80%" />
+  </p>
+- Failure strategy, notification strategy, process priority, worker group, notification group, recipient, and CC are the same as [workflow running parameters](#runParamers).
+- Click the "Create" button to create the timing successfully. At this time, the timing status is "**Offline**" and the timing needs to be **Online** to take effect.
+- Timing online: Click the "timing management" button <img src="/img/timeManagement.png" width="35"/>, enter the timing management page, click the "online" button, the timing status will change to "online", as shown in the below figure, the workflow takes effect regularly.
+  <p align="center">
+      <img src="/img/time-manage-list-en.png" width="80%" />
+  </p>
+
+#### 2.3.5 Import workflow
+
+Click Project Management -> Workflow -> Workflow Definition to enter the workflow definition page, click the "Import Workflow" button to import the local workflow file, the workflow definition list displays the imported workflow, and the status is offline.
+
+#### 2.4 Workflow example
+
+#### 2.4.1 View workflow example
+
+- Click Project Management -> Workflow -> Workflow Instance to enter the Workflow Instance page, as shown in the figure below:
+     <p align="center">
+        <img src="/img/instance-list-en.png" width="80%" />
+     </p>
+- Click the workflow name to enter the DAG view page to view the task execution status, as shown in the figure below.
+  <p align="center">
+    <img src="/img/instance-runs-en.png" width="80%" />
+  </p>
+
+#### 2.4.2 View task log
+
+- Enter the workflow instance page, click the workflow name, enter the DAG view page, double-click the task node, as shown in the following figure:
+   <p align="center">
+     <img src="/img/instanceViewLog-en.png" width="80%" />
+   </p>
+- Click "View Log", a log pop-up box will pop up, as shown in the figure below, the task log can also be viewed on the task instance page, refer to [Task View Log](#taskLog)。
+   <p align="center">
+     <img src="/img/task-log-en.png" width="80%" />
+   </p>
+
+#### 2.4.3 View task history
+
+- Click Project Management -> Workflow -> Workflow Instance to enter the workflow instance page, and click the workflow name to enter the workflow DAG page;
+- Double-click the task node, as shown in the figure below, click "View History" to jump to the task instance page, and display a list of task instances running by the workflow instance
+   <p align="center">
+     <img src="/img/task_history_en.png" width="80%" />
+   </p>
+
+#### 2.4.4 View operating parameters
+
+- Click Project Management -> Workflow -> Workflow Instance to enter the workflow instance page, and click the workflow name to enter the workflow DAG page;
+- Click the icon in the upper left corner<img src="/img/run_params_button.png" width="35"/>,View the startup parameters of the workflow instance; click the icon<img src="/img/global_param.png" width="35"/>,View the global and local parameters of the workflow instance, as shown in the following figure:
+   <p align="center">
+     <img src="/img/run_params_en.png" width="80%" />
+   </p>
+
+#### 2.4.4 Workflow instance operation function
+
+Click Project Management -> Workflow -> Workflow Instance to enter the Workflow Instance page, as shown in the figure below:
+
+  <p align="center">
+    <img src="/img/instance-list-en.png" width="80%" />
+  </p>
+
+- **Edit:** Only terminated processes can be edited. Click the "Edit" button or the name of the workflow instance to enter the DAG editing page. After editing, click the "Save" button to pop up the Save DAG pop-up box, as shown in the figure below. In the pop-up box, check "Whether to update to workflow definition" and save After that, the workflow definition will be updated; if it is not checked, the workflow definition will not be updated.

Review comment:
       ```suggestion
   - **Edit:** Only terminated processes can be edited. Click the "Edit" button or the name of the workflow instance to enter the DAG edit page. After edit, click the "Save" button to pop up the Save DAG pop-up box, as shown in the figure below. In the pop-up box, check "Whether to update to workflow definition" and save After that, the workflow definition will be updated; if it is not checked, the workflow definition will not be updated.
   ```

##########
File path: docs/en-us/1.3.2/user_doc/system-manual.md
##########
@@ -0,0 +1,876 @@
+# System User Manual
+
+## Get started quickly
+
+> Please refer to [Quick Start](quick-start.html)
+
+## Operation guide
+
+### 1. Home
+
+The home page contains task status statistics, process status statistics, and workflow definition statistics for all projects of the user.
+
+<p align="center">
+<img src="/img/home_en.png" width="80%" />
+</p>
+
+### 2. Project management
+
+#### 2.1 Create project
+
+- Click "Project Management" to enter the project management page, click the "Create Project" button, enter the project name, project description, and click "Submit" to create a new project.
+
+  <p align="center">
+      <img src="/img/create_project_en1.png" width="80%" />
+  </p>
+
+#### 2.2 Project home
+
+- Click the project name link on the project management page to enter the project home page, as shown in the figure below, the project home page contains the task status statistics, process status statistics, and workflow definition statistics of the project.
+  <p align="center">
+     <img src="/img/project_home_en.png" width="80%" />
+  </p>
+
+- Task status statistics: within the specified time range, count the number of task instances as successful submission, running, ready to pause, pause, ready to stop, stop, failure, success, fault tolerance, kill, and waiting threads
+- Process status statistics: within the specified time range, count the number of the status of the workflow instance as submission success, running, ready to pause, pause, ready to stop, stop, failure, success, fault tolerance, kill, and waiting threads
+- Workflow definition statistics: Count the workflow definitions created by this user and the workflow definitions granted to this user by the administrator
+
+#### 2.3 Workflow definition
+
+#### <span id=creatDag>2.3.1 Create workflow definition</span>
+
+- Click Project Management -> Workflow -> Workflow Definition to enter the workflow definition page, and click the "Create Workflow" button to enter the **workflow DAG edit** page, as shown in the following figure:
+  <p align="center">
+      <img src="/img/dag5.png" width="80%" />
+  </p>
+- Drag in the toolbar <img src="/img/shell.png" width="35"/> Add a Shell task to the drawing board, as shown in the figure below:
+  <p align="center">
+      <img src="/img/shell-en.png" width="80%" />
+  </p>
+- **Add parameter settings for this shell task:**
+
+1. Fill in the "Node Name", "Description", and "Script" fields;
+2. Check “Normal” for “Run Flag”. If “Prohibit Execution” is checked, the task will not be executed when the workflow runs;
+3. Select "Task Priority": When the number of worker threads is insufficient, high-level tasks will be executed first in the execution queue, and tasks with the same priority will be executed in the order of first in, first out;
+4. Timeout alarm (optional): Check the timeout alarm, timeout failure, and fill in the "timeout period". When the task execution time exceeds **timeout period**, an alert email will be sent and the task timeout fails;
+5. Resources (optional). Resource files are files created or uploaded on the Resource Center -> File Management page. For example, the file name is `test.sh`, and the command to call the resource in the script is `sh test.sh`;
+6. Custom parameters (optional), refer to [Custom Parameters](#UserDefinedParameters);
+7. Click the "Confirm Add" button to save the task settings.
+
+- **Increase the order of task execution:** Click the icon in the upper right corner <img src="/img/line.png" width="35"/> to connect the task; as shown in the figure below, task 2 and task 3 are executed in parallel, When task 1 finished execute, tasks 2 and 3 will be executed simultaneously.
+
+  <p align="center">
+     <img src="/img/dag6.png" width="80%" />
+  </p>
+
+- **Delete dependencies:** Click the "arrow" icon in the upper right corner <img src="/img/arrow.png" width="35"/>, select the connection line, and click the "Delete" icon in the upper right corner <img src= "/img/delete.png" width="35"/>, delete dependencies between tasks.
+  <p align="center">
+     <img src="/img/dag7.png" width="80%" />
+  </p>
+
+- **Save workflow definition:** Click the "Save" button, and the "Set DAG chart name" pop-up box will pop up, as shown in the figure below. Enter the workflow definition name, workflow definition description, and set global parameters (optional, refer to [ Custom parameters](#UserDefinedParameters)), click the "Add" button, and the workflow definition is created successfully.
+  <p align="center">
+     <img src="/img/dag8.png" width="80%" />
+   </p>
+> For other types of tasks, please refer to [Task Node Type and Parameter Settings](#TaskParamers).
+
+#### 2.3.2 Workflow definition operation function
+
+Click Project Management -> Workflow -> Workflow Definition to enter the workflow definition page, as shown below:
+
+<p align="center">
+<img src="/img/work_list_en.png" width="80%" />
+</p>
+The operation functions of the workflow definition list are as follows:
+
+- **Edit:** Only "offline" workflow definitions can be edited. Workflow DAG editing is the same as [Create Workflow Definition](#creatDag).
+- **Online:** When the workflow status is "Offline", used to online workflow. Only the workflow in the "Online" state can run, but cannot be edited.
+- **Offline:** When the workflow status is "Online", used to offline workflow. Only the workflow in the "Offline" state can be edited, but not run.
+- **Run:** Only workflow in the online state can run. See [2.3.3 Run Workflow](#runWorkflow) for the operation steps
+- **Timing:** Timing can only be set in online workflows, and the system automatically schedules the workflow to run on a regular basis. The status after creating a timing is "offline", and the timing must be online on the timing management page to take effect. See [2.3.4 Workflow Timing](#creatTiming) for timing operation steps.
+- **Timing Management:** The timing management page can be edited, online/offline, and deleted.
+- **Delete:** Delete the workflow definition.
+- **Download:** Download workflow definition to local.
+- **Tree Diagram:** Display the task node type and task status in a tree structure, as shown in the figure below:
+  <p align="center">
+      <img src="/img/tree_en.png" width="80%" />
+  </p>
+
+#### <span id=runWorkflow>2.3.3 Run the workflow</span>
+
+- Click Project Management -> Workflow -> Workflow Definition to enter the workflow definition page, as shown in the figure below, click the "Go Online" button <img src="/img/online.png" width="35"/>,Go online workflow.
+  <p align="center">
+      <img src="/img/work_list_en.png" width="80%" />
+  </p>
+
+- Click the "Run" button to pop up the startup parameter setting pop-up box, as shown in the figure below, set the startup parameters, click the "Run" button in the pop-up box, the workflow starts running, and the workflow instance page generates a workflow instance.
+     <p align="center">
+       <img src="/img/run_work_en.png" width="80%" />
+     </p>
+  <span id=runParamers>Description of workflow operating parameters:</span>
+
+      * Failure strategy: When a task node fails to execute, other parallel task nodes need to execute the strategy. "Continue" means: after a certain task fails, other task nodes execute normally; "End" means: terminate all tasks being executed, and terminate the entire process.
+      * Notification strategy: When the process is over, the process execution information notification email is sent according to the process status, including any status is not sent, successful sent, failed sent, successful or failed sent.
+      * Process priority: The priority of process operation, divided into five levels: highest (HIGHEST), high (HIGH), medium (MEDIUM), low (LOW), and lowest (LOWEST). When the number of master threads is insufficient, high-level processes will be executed first in the execution queue, and processes with the same priority will be executed in a first-in first-out order.
+      * Worker group: The process can only be executed in the specified worker machine group. The default is Default, which can be executed on any worker.
+      * Notification group: select notification strategy||timeout alarm||when fault tolerance occurs, process information or email will be sent to all members in the notification group.
+      * Recipient: Select notification policy||Timeout alarm||When fault tolerance occurs, process information or alarm email will be sent to the recipient list.
+      * Cc: Select the notification strategy||Timeout alarm||When fault tolerance occurs, the process information or warning email will be copied to the CC list.
+      * Complement: Two modes including serial complement and parallel complement. Serial complement: within the specified time range, the complement is executed sequentially from the start date to the end date, and only one process instance is generated; parallel complement: within the specified time range, multiple days are complemented at the same time to generate N process instances.
+    * supplement the data from September 19 to October 16
+
+```date not the same as cn version
+    <p align="center">
+        <img src="/img/complement_en.png" width="80%" />
+    </p>
+
+  > Serial mode: The complement is executed sequentially from September 19 to October 16, and a process instance is generated on the process instance page;
+
+  > Parallel mode: The tasks from September 19 to October 16 are executed simultaneously, and 28 process instances are generated on the process instance page.
+
+#### <span id=creatTiming>2.3.4 Workflow timing</span>
+
+- Create timing: Click Project Management->Workflow->Workflow Definition, enter the workflow definition page, go online the workflow, click the "timing" button <img src="/img/timing.png" width="35"/> ,The timing parameter setting dialog box pops up, as shown in the figure below:
+  <p align="center">
+      <img src="/img/time_schedule_en.png" width="80%" />
+  </p>
+- Choose the start and end time. In the start and end time range, the workflow is run at regular intervals; not in the start and end time range, no more regular workflow instances are generated.
+- Add a timing that is executed once every day at 5 AM, as shown in the following figure:
+  <p align="center">
+      <img src="/img/timer-en.png" width="80%" />
+  </p>
+- Failure strategy, notification strategy, process priority, worker group, notification group, recipient, and CC are the same as [workflow running parameters](#runParamers).
+- Click the "Create" button to create the timing successfully. At this time, the timing status is "**Offline**" and the timing needs to be **Online** to take effect.
+- Timing online: Click the "timing management" button <img src="/img/timeManagement.png" width="35"/>, enter the timing management page, click the "online" button, the timing status will change to "online", as shown in the below figure, the workflow takes effect regularly.
+  <p align="center">
+      <img src="/img/time-manage-list-en.png" width="80%" />
+  </p>
+
+#### 2.3.5 Import workflow
+
+Click Project Management -> Workflow -> Workflow Definition to enter the workflow definition page, click the "Import Workflow" button to import the local workflow file, the workflow definition list displays the imported workflow, and the status is offline.
+
+#### 2.4 Workflow example
+
+#### 2.4.1 View workflow example
+
+- Click Project Management -> Workflow -> Workflow Instance to enter the Workflow Instance page, as shown in the figure below:
+     <p align="center">
+        <img src="/img/instance-list-en.png" width="80%" />
+     </p>
+- Click the workflow name to enter the DAG view page to view the task execution status, as shown in the figure below.
+  <p align="center">
+    <img src="/img/instance-runs-en.png" width="80%" />
+  </p>
+
+#### 2.4.2 View task log
+
+- Enter the workflow instance page, click the workflow name, enter the DAG view page, double-click the task node, as shown in the following figure:
+   <p align="center">
+     <img src="/img/instanceViewLog-en.png" width="80%" />
+   </p>
+- Click "View Log", a log pop-up box will pop up, as shown in the figure below, the task log can also be viewed on the task instance page, refer to [Task View Log](#taskLog)。
+   <p align="center">
+     <img src="/img/task-log-en.png" width="80%" />
+   </p>
+
+#### 2.4.3 View task history
+
+- Click Project Management -> Workflow -> Workflow Instance to enter the workflow instance page, and click the workflow name to enter the workflow DAG page;
+- Double-click the task node, as shown in the figure below, click "View History" to jump to the task instance page, and display a list of task instances running by the workflow instance
+   <p align="center">
+     <img src="/img/task_history_en.png" width="80%" />
+   </p>
+
+#### 2.4.4 View operating parameters
+
+- Click Project Management -> Workflow -> Workflow Instance to enter the workflow instance page, and click the workflow name to enter the workflow DAG page;
+- Click the icon in the upper left corner<img src="/img/run_params_button.png" width="35"/>,View the startup parameters of the workflow instance; click the icon<img src="/img/global_param.png" width="35"/>,View the global and local parameters of the workflow instance, as shown in the following figure:
+   <p align="center">
+     <img src="/img/run_params_en.png" width="80%" />
+   </p>
+
+#### 2.4.4 Workflow instance operation function
+
+Click Project Management -> Workflow -> Workflow Instance to enter the Workflow Instance page, as shown in the figure below:
+
+  <p align="center">
+    <img src="/img/instance-list-en.png" width="80%" />
+  </p>
+
+- **Edit:** Only terminated processes can be edited. Click the "Edit" button or the name of the workflow instance to enter the DAG editing page. After editing, click the "Save" button to pop up the Save DAG pop-up box, as shown in the figure below. In the pop-up box, check "Whether to update to workflow definition" and save After that, the workflow definition will be updated; if it is not checked, the workflow definition will not be updated.
+     <p align="center">
+       <img src="/img/editDag-en.png" width="80%" />
+     </p>
+- **Rerun:** Re-execute the terminated process.
+- **Recovery failed:** For failed processes, you can perform recovery operations, starting from the failed node.
+- **stop:** To **stop** the running process, the background will first `kill`worker process, and then execute `kill -9` operation
+- **Pause:** Perform a **pause** operation on the running process, the system status will change to **waiting for execution**, it will wait for the end of the task being executed, and pause the next task to be executed.
+- **Resume pause:** To resume the paused process, start running directly from the **paused node**
+- **Delete:** Delete the workflow instance and the task instance under the workflow instance
+- **Gantt chart:** The vertical axis of the Gantt chart is the topological sorting of task instances under a certain workflow instance, and the horizontal axis is the running time of the task instances, as shown in the figure:
+     <p align="center">
+         <img src="/img/gantt-en.png" width="80%" />
+     </p>
+
+#### 2.5 Task instance
+
+- Click Project Management -> Workflow -> Task Instance to enter the task instance page, as shown in the figure below, click the name of the workflow instance, you can jump to the workflow instance DAG chart to view the task status.
+     <p align="center">
+        <img src="/img/task-list-en.png" width="80%" />
+     </p>
+
+- <span id=taskLog>View log:</span>Click the "view log" button in the operation column to view the log of task execution.
+     <p align="center">
+        <img src="/img/task-log2-en.png" width="80%" />
+     </p>
+
+### 3. Resource Center
+
+#### 3.1 hdfs resource configuration
+
+- Upload resource files and udf functions, all uploaded files and resources will be stored on hdfs, so the following configuration items are required:
+
+```
+
+conf/common/common.properties # Users who have permission to create directories under the HDFS root path

Review comment:
       ```suggestion
   conf/common/common.properties
   # Users who have permission to create directories under the HDFS root path
   ```

##########
File path: docs/en-us/1.3.2/user_doc/system-manual.md
##########
@@ -0,0 +1,876 @@
+# System User Manual
+
+## Get started quickly
+
+> Please refer to [Quick Start](quick-start.html)
+
+## Operation guide
+
+### 1. Home
+
+The home page contains task status statistics, process status statistics, and workflow definition statistics for all projects of the user.
+
+<p align="center">
+<img src="/img/home_en.png" width="80%" />
+</p>
+
+### 2. Project management
+
+#### 2.1 Create project
+
+- Click "Project Management" to enter the project management page, click the "Create Project" button, enter the project name, project description, and click "Submit" to create a new project.
+
+  <p align="center">
+      <img src="/img/create_project_en1.png" width="80%" />
+  </p>
+
+#### 2.2 Project home
+
+- Click the project name link on the project management page to enter the project home page, as shown in the figure below, the project home page contains the task status statistics, process status statistics, and workflow definition statistics of the project.
+  <p align="center">
+     <img src="/img/project_home_en.png" width="80%" />
+  </p>
+
+- Task status statistics: within the specified time range, count the number of task instances as successful submission, running, ready to pause, pause, ready to stop, stop, failure, success, fault tolerance, kill, and waiting threads
+- Process status statistics: within the specified time range, count the number of the status of the workflow instance as submission success, running, ready to pause, pause, ready to stop, stop, failure, success, fault tolerance, kill, and waiting threads
+- Workflow definition statistics: Count the workflow definitions created by this user and the workflow definitions granted to this user by the administrator
+
+#### 2.3 Workflow definition
+
+#### <span id=creatDag>2.3.1 Create workflow definition</span>
+
+- Click Project Management -> Workflow -> Workflow Definition to enter the workflow definition page, and click the "Create Workflow" button to enter the **workflow DAG edit** page, as shown in the following figure:
+  <p align="center">
+      <img src="/img/dag5.png" width="80%" />
+  </p>
+- Drag in the toolbar <img src="/img/shell.png" width="35"/> Add a Shell task to the drawing board, as shown in the figure below:
+  <p align="center">
+      <img src="/img/shell-en.png" width="80%" />
+  </p>
+- **Add parameter settings for this shell task:**
+
+1. Fill in the "Node Name", "Description", and "Script" fields;
+2. Check “Normal” for “Run Flag”. If “Prohibit Execution” is checked, the task will not be executed when the workflow runs;
+3. Select "Task Priority": When the number of worker threads is insufficient, high-level tasks will be executed first in the execution queue, and tasks with the same priority will be executed in the order of first in, first out;
+4. Timeout alarm (optional): Check the timeout alarm, timeout failure, and fill in the "timeout period". When the task execution time exceeds **timeout period**, an alert email will be sent and the task timeout fails;
+5. Resources (optional). Resource files are files created or uploaded on the Resource Center -> File Management page. For example, the file name is `test.sh`, and the command to call the resource in the script is `sh test.sh`;
+6. Custom parameters (optional), refer to [Custom Parameters](#UserDefinedParameters);
+7. Click the "Confirm Add" button to save the task settings.
+
+- **Increase the order of task execution:** Click the icon in the upper right corner <img src="/img/line.png" width="35"/> to connect the task; as shown in the figure below, task 2 and task 3 are executed in parallel, When task 1 finished execute, tasks 2 and 3 will be executed simultaneously.
+
+  <p align="center">
+     <img src="/img/dag6.png" width="80%" />
+  </p>
+
+- **Delete dependencies:** Click the "arrow" icon in the upper right corner <img src="/img/arrow.png" width="35"/>, select the connection line, and click the "Delete" icon in the upper right corner <img src= "/img/delete.png" width="35"/>, delete dependencies between tasks.
+  <p align="center">
+     <img src="/img/dag7.png" width="80%" />
+  </p>
+
+- **Save workflow definition:** Click the "Save" button, and the "Set DAG chart name" pop-up box will pop up, as shown in the figure below. Enter the workflow definition name, workflow definition description, and set global parameters (optional, refer to [ Custom parameters](#UserDefinedParameters)), click the "Add" button, and the workflow definition is created successfully.
+  <p align="center">
+     <img src="/img/dag8.png" width="80%" />
+   </p>
+> For other types of tasks, please refer to [Task Node Type and Parameter Settings](#TaskParamers).
+
+#### 2.3.2 Workflow definition operation function
+
+Click Project Management -> Workflow -> Workflow Definition to enter the workflow definition page, as shown below:
+
+<p align="center">
+<img src="/img/work_list_en.png" width="80%" />
+</p>
+The operation functions of the workflow definition list are as follows:
+
+- **Edit:** Only "offline" workflow definitions can be edited. Workflow DAG editing is the same as [Create Workflow Definition](#creatDag).
+- **Online:** When the workflow status is "Offline", used to online workflow. Only the workflow in the "Online" state can run, but cannot be edited.
+- **Offline:** When the workflow status is "Online", used to offline workflow. Only the workflow in the "Offline" state can be edited, but not run.
+- **Run:** Only workflow in the online state can run. See [2.3.3 Run Workflow](#runWorkflow) for the operation steps
+- **Timing:** Timing can only be set in online workflows, and the system automatically schedules the workflow to run on a regular basis. The status after creating a timing is "offline", and the timing must be online on the timing management page to take effect. See [2.3.4 Workflow Timing](#creatTiming) for timing operation steps.
+- **Timing Management:** The timing management page can be edited, online/offline, and deleted.
+- **Delete:** Delete the workflow definition.
+- **Download:** Download workflow definition to local.
+- **Tree Diagram:** Display the task node type and task status in a tree structure, as shown in the figure below:
+  <p align="center">
+      <img src="/img/tree_en.png" width="80%" />
+  </p>
+
+#### <span id=runWorkflow>2.3.3 Run the workflow</span>
+
+- Click Project Management -> Workflow -> Workflow Definition to enter the workflow definition page, as shown in the figure below, click the "Go Online" button <img src="/img/online.png" width="35"/>,Go online workflow.
+  <p align="center">
+      <img src="/img/work_list_en.png" width="80%" />
+  </p>
+
+- Click the "Run" button to pop up the startup parameter setting pop-up box, as shown in the figure below, set the startup parameters, click the "Run" button in the pop-up box, the workflow starts running, and the workflow instance page generates a workflow instance.
+     <p align="center">
+       <img src="/img/run_work_en.png" width="80%" />
+     </p>
+  <span id=runParamers>Description of workflow operating parameters:</span>
+
+      * Failure strategy: When a task node fails to execute, other parallel task nodes need to execute the strategy. "Continue" means: after a certain task fails, other task nodes execute normally; "End" means: terminate all tasks being executed, and terminate the entire process.
+      * Notification strategy: When the process is over, the process execution information notification email is sent according to the process status, including any status is not sent, successful sent, failed sent, successful or failed sent.
+      * Process priority: The priority of process operation, divided into five levels: highest (HIGHEST), high (HIGH), medium (MEDIUM), low (LOW), and lowest (LOWEST). When the number of master threads is insufficient, high-level processes will be executed first in the execution queue, and processes with the same priority will be executed in a first-in first-out order.
+      * Worker group: The process can only be executed in the specified worker machine group. The default is Default, which can be executed on any worker.
+      * Notification group: select notification strategy||timeout alarm||when fault tolerance occurs, process information or email will be sent to all members in the notification group.
+      * Recipient: Select notification policy||Timeout alarm||When fault tolerance occurs, process information or alarm email will be sent to the recipient list.
+      * Cc: Select the notification strategy||Timeout alarm||When fault tolerance occurs, the process information or warning email will be copied to the CC list.
+      * Complement: Two modes including serial complement and parallel complement. Serial complement: within the specified time range, the complement is executed sequentially from the start date to the end date, and only one process instance is generated; parallel complement: within the specified time range, multiple days are complemented at the same time to generate N process instances.
+    * supplement the data from September 19 to October 16
+
+```date not the same as cn version
+    <p align="center">
+        <img src="/img/complement_en.png" width="80%" />
+    </p>
+
+  > Serial mode: The complement is executed sequentially from September 19 to October 16, and a process instance is generated on the process instance page;
+
+  > Parallel mode: The tasks from September 19 to October 16 are executed simultaneously, and 28 process instances are generated on the process instance page.
+
+#### <span id=creatTiming>2.3.4 Workflow timing</span>
+
+- Create timing: Click Project Management->Workflow->Workflow Definition, enter the workflow definition page, go online the workflow, click the "timing" button <img src="/img/timing.png" width="35"/> ,The timing parameter setting dialog box pops up, as shown in the figure below:
+  <p align="center">
+      <img src="/img/time_schedule_en.png" width="80%" />
+  </p>
+- Choose the start and end time. In the start and end time range, the workflow is run at regular intervals; not in the start and end time range, no more regular workflow instances are generated.
+- Add a timing that is executed once every day at 5 AM, as shown in the following figure:
+  <p align="center">
+      <img src="/img/timer-en.png" width="80%" />
+  </p>
+- Failure strategy, notification strategy, process priority, worker group, notification group, recipient, and CC are the same as [workflow running parameters](#runParamers).
+- Click the "Create" button to create the timing successfully. At this time, the timing status is "**Offline**" and the timing needs to be **Online** to take effect.
+- Timing online: Click the "timing management" button <img src="/img/timeManagement.png" width="35"/>, enter the timing management page, click the "online" button, the timing status will change to "online", as shown in the below figure, the workflow takes effect regularly.
+  <p align="center">
+      <img src="/img/time-manage-list-en.png" width="80%" />
+  </p>
+
+#### 2.3.5 Import workflow
+
+Click Project Management -> Workflow -> Workflow Definition to enter the workflow definition page, click the "Import Workflow" button to import the local workflow file, the workflow definition list displays the imported workflow, and the status is offline.
+
+#### 2.4 Workflow example
+
+#### 2.4.1 View workflow example
+
+- Click Project Management -> Workflow -> Workflow Instance to enter the Workflow Instance page, as shown in the figure below:
+     <p align="center">
+        <img src="/img/instance-list-en.png" width="80%" />
+     </p>
+- Click the workflow name to enter the DAG view page to view the task execution status, as shown in the figure below.
+  <p align="center">
+    <img src="/img/instance-runs-en.png" width="80%" />
+  </p>
+
+#### 2.4.2 View task log
+
+- Enter the workflow instance page, click the workflow name, enter the DAG view page, double-click the task node, as shown in the following figure:
+   <p align="center">
+     <img src="/img/instanceViewLog-en.png" width="80%" />
+   </p>
+- Click "View Log", a log pop-up box will pop up, as shown in the figure below, the task log can also be viewed on the task instance page, refer to [Task View Log](#taskLog)。
+   <p align="center">
+     <img src="/img/task-log-en.png" width="80%" />
+   </p>
+
+#### 2.4.3 View task history
+
+- Click Project Management -> Workflow -> Workflow Instance to enter the workflow instance page, and click the workflow name to enter the workflow DAG page;
+- Double-click the task node, as shown in the figure below, click "View History" to jump to the task instance page, and display a list of task instances running by the workflow instance
+   <p align="center">
+     <img src="/img/task_history_en.png" width="80%" />
+   </p>
+
+#### 2.4.4 View operating parameters
+
+- Click Project Management -> Workflow -> Workflow Instance to enter the workflow instance page, and click the workflow name to enter the workflow DAG page;
+- Click the icon in the upper left corner<img src="/img/run_params_button.png" width="35"/>,View the startup parameters of the workflow instance; click the icon<img src="/img/global_param.png" width="35"/>,View the global and local parameters of the workflow instance, as shown in the following figure:
+   <p align="center">
+     <img src="/img/run_params_en.png" width="80%" />
+   </p>
+
+#### 2.4.4 Workflow instance operation function
+
+Click Project Management -> Workflow -> Workflow Instance to enter the Workflow Instance page, as shown in the figure below:
+
+  <p align="center">
+    <img src="/img/instance-list-en.png" width="80%" />
+  </p>
+
+- **Edit:** Only terminated processes can be edited. Click the "Edit" button or the name of the workflow instance to enter the DAG editing page. After editing, click the "Save" button to pop up the Save DAG pop-up box, as shown in the figure below. In the pop-up box, check "Whether to update to workflow definition" and save After that, the workflow definition will be updated; if it is not checked, the workflow definition will not be updated.
+     <p align="center">
+       <img src="/img/editDag-en.png" width="80%" />
+     </p>
+- **Rerun:** Re-execute the terminated process.
+- **Recovery failed:** For failed processes, you can perform recovery operations, starting from the failed node.
+- **stop:** To **stop** the running process, the background will first `kill`worker process, and then execute `kill -9` operation
+- **Pause:** Perform a **pause** operation on the running process, the system status will change to **waiting for execution**, it will wait for the end of the task being executed, and pause the next task to be executed.
+- **Resume pause:** To resume the paused process, start running directly from the **paused node**
+- **Delete:** Delete the workflow instance and the task instance under the workflow instance
+- **Gantt chart:** The vertical axis of the Gantt chart is the topological sorting of task instances under a certain workflow instance, and the horizontal axis is the running time of the task instances, as shown in the figure:
+     <p align="center">
+         <img src="/img/gantt-en.png" width="80%" />
+     </p>
+
+#### 2.5 Task instance
+
+- Click Project Management -> Workflow -> Task Instance to enter the task instance page, as shown in the figure below, click the name of the workflow instance, you can jump to the workflow instance DAG chart to view the task status.
+     <p align="center">
+        <img src="/img/task-list-en.png" width="80%" />
+     </p>
+
+- <span id=taskLog>View log:</span>Click the "view log" button in the operation column to view the log of task execution.
+     <p align="center">
+        <img src="/img/task-log2-en.png" width="80%" />
+     </p>
+
+### 3. Resource Center
+
+#### 3.1 hdfs resource configuration
+
+- Upload resource files and udf functions, all uploaded files and resources will be stored on hdfs, so the following configuration items are required:
+
+```
+
+conf/common/common.properties # Users who have permission to create directories under the HDFS root path
+hdfs.root.user=hdfs # data base dir, resource file will store to this hadoop hdfs path, self configuration, please make sure the directory exists on hdfs and have read write permissions。"/escheduler" is recommended

Review comment:
       ```suggestion
   hdfs.root.user=hdfs
   # data base dir, resource file will store to this hadoop hdfs path, self configuration, please make sure the directory exists on hdfs and have read write permissions。"/escheduler" is recommended
   ```

##########
File path: docs/en-us/1.3.2/user_doc/system-manual.md
##########
@@ -0,0 +1,876 @@
+# System User Manual
+
+## Get started quickly
+
+> Please refer to [Quick Start](quick-start.html)
+
+## Operation guide
+
+### 1. Home
+
+The home page contains task status statistics, process status statistics, and workflow definition statistics for all projects of the user.
+
+<p align="center">
+<img src="/img/home_en.png" width="80%" />
+</p>
+
+### 2. Project management
+
+#### 2.1 Create project
+
+- Click "Project Management" to enter the project management page, click the "Create Project" button, enter the project name, project description, and click "Submit" to create a new project.
+
+  <p align="center">
+      <img src="/img/create_project_en1.png" width="80%" />
+  </p>
+
+#### 2.2 Project home
+
+- Click the project name link on the project management page to enter the project home page, as shown in the figure below, the project home page contains the task status statistics, process status statistics, and workflow definition statistics of the project.
+  <p align="center">
+     <img src="/img/project_home_en.png" width="80%" />
+  </p>
+
+- Task status statistics: within the specified time range, count the number of task instances as successful submission, running, ready to pause, pause, ready to stop, stop, failure, success, fault tolerance, kill, and waiting threads
+- Process status statistics: within the specified time range, count the number of the status of the workflow instance as submission success, running, ready to pause, pause, ready to stop, stop, failure, success, fault tolerance, kill, and waiting threads
+- Workflow definition statistics: Count the workflow definitions created by this user and the workflow definitions granted to this user by the administrator
+
+#### 2.3 Workflow definition
+
+#### <span id=creatDag>2.3.1 Create workflow definition</span>
+
+- Click Project Management -> Workflow -> Workflow Definition to enter the workflow definition page, and click the "Create Workflow" button to enter the **workflow DAG edit** page, as shown in the following figure:
+  <p align="center">
+      <img src="/img/dag5.png" width="80%" />
+  </p>
+- Drag in the toolbar <img src="/img/shell.png" width="35"/> Add a Shell task to the drawing board, as shown in the figure below:
+  <p align="center">
+      <img src="/img/shell-en.png" width="80%" />
+  </p>
+- **Add parameter settings for this shell task:**
+
+1. Fill in the "Node Name", "Description", and "Script" fields;
+2. Check “Normal” for “Run Flag”. If “Prohibit Execution” is checked, the task will not be executed when the workflow runs;
+3. Select "Task Priority": When the number of worker threads is insufficient, high-level tasks will be executed first in the execution queue, and tasks with the same priority will be executed in the order of first in, first out;
+4. Timeout alarm (optional): Check the timeout alarm, timeout failure, and fill in the "timeout period". When the task execution time exceeds **timeout period**, an alert email will be sent and the task timeout fails;
+5. Resources (optional). Resource files are files created or uploaded on the Resource Center -> File Management page. For example, the file name is `test.sh`, and the command to call the resource in the script is `sh test.sh`;
+6. Custom parameters (optional), refer to [Custom Parameters](#UserDefinedParameters);
+7. Click the "Confirm Add" button to save the task settings.
+
+- **Increase the order of task execution:** Click the icon in the upper right corner <img src="/img/line.png" width="35"/> to connect the task; as shown in the figure below, task 2 and task 3 are executed in parallel, When task 1 finished execute, tasks 2 and 3 will be executed simultaneously.
+
+  <p align="center">
+     <img src="/img/dag6.png" width="80%" />
+  </p>
+
+- **Delete dependencies:** Click the "arrow" icon in the upper right corner <img src="/img/arrow.png" width="35"/>, select the connection line, and click the "Delete" icon in the upper right corner <img src= "/img/delete.png" width="35"/>, delete dependencies between tasks.
+  <p align="center">
+     <img src="/img/dag7.png" width="80%" />
+  </p>
+
+- **Save workflow definition:** Click the "Save" button, and the "Set DAG chart name" pop-up box will pop up, as shown in the figure below. Enter the workflow definition name, workflow definition description, and set global parameters (optional, refer to [ Custom parameters](#UserDefinedParameters)), click the "Add" button, and the workflow definition is created successfully.
+  <p align="center">
+     <img src="/img/dag8.png" width="80%" />
+   </p>
+> For other types of tasks, please refer to [Task Node Type and Parameter Settings](#TaskParamers).
+
+#### 2.3.2 Workflow definition operation function
+
+Click Project Management -> Workflow -> Workflow Definition to enter the workflow definition page, as shown below:
+
+<p align="center">
+<img src="/img/work_list_en.png" width="80%" />
+</p>
+The operation functions of the workflow definition list are as follows:
+
+- **Edit:** Only "offline" workflow definitions can be edited. Workflow DAG editing is the same as [Create Workflow Definition](#creatDag).
+- **Online:** When the workflow status is "Offline", used to online workflow. Only the workflow in the "Online" state can run, but cannot be edited.
+- **Offline:** When the workflow status is "Online", used to offline workflow. Only the workflow in the "Offline" state can be edited, but not run.
+- **Run:** Only workflow in the online state can run. See [2.3.3 Run Workflow](#runWorkflow) for the operation steps
+- **Timing:** Timing can only be set in online workflows, and the system automatically schedules the workflow to run on a regular basis. The status after creating a timing is "offline", and the timing must be online on the timing management page to take effect. See [2.3.4 Workflow Timing](#creatTiming) for timing operation steps.
+- **Timing Management:** The timing management page can be edited, online/offline, and deleted.
+- **Delete:** Delete the workflow definition.
+- **Download:** Download workflow definition to local.
+- **Tree Diagram:** Display the task node type and task status in a tree structure, as shown in the figure below:
+  <p align="center">
+      <img src="/img/tree_en.png" width="80%" />
+  </p>
+
+#### <span id=runWorkflow>2.3.3 Run the workflow</span>
+
+- Click Project Management -> Workflow -> Workflow Definition to enter the workflow definition page, as shown in the figure below, click the "Go Online" button <img src="/img/online.png" width="35"/>,Go online workflow.
+  <p align="center">
+      <img src="/img/work_list_en.png" width="80%" />
+  </p>
+
+- Click the "Run" button to pop up the startup parameter setting pop-up box, as shown in the figure below, set the startup parameters, click the "Run" button in the pop-up box, the workflow starts running, and the workflow instance page generates a workflow instance.
+     <p align="center">
+       <img src="/img/run_work_en.png" width="80%" />
+     </p>
+  <span id=runParamers>Description of workflow operating parameters:</span>
+
+      * Failure strategy: When a task node fails to execute, other parallel task nodes need to execute the strategy. "Continue" means: after a certain task fails, other task nodes execute normally; "End" means: terminate all tasks being executed, and terminate the entire process.
+      * Notification strategy: When the process is over, the process execution information notification email is sent according to the process status, including any status is not sent, successful sent, failed sent, successful or failed sent.
+      * Process priority: The priority of process operation, divided into five levels: highest (HIGHEST), high (HIGH), medium (MEDIUM), low (LOW), and lowest (LOWEST). When the number of master threads is insufficient, high-level processes will be executed first in the execution queue, and processes with the same priority will be executed in a first-in first-out order.
+      * Worker group: The process can only be executed in the specified worker machine group. The default is Default, which can be executed on any worker.
+      * Notification group: select notification strategy||timeout alarm||when fault tolerance occurs, process information or email will be sent to all members in the notification group.
+      * Recipient: Select notification policy||Timeout alarm||When fault tolerance occurs, process information or alarm email will be sent to the recipient list.
+      * Cc: Select the notification strategy||Timeout alarm||When fault tolerance occurs, the process information or warning email will be copied to the CC list.
+      * Complement: Two modes including serial complement and parallel complement. Serial complement: within the specified time range, the complement is executed sequentially from the start date to the end date, and only one process instance is generated; parallel complement: within the specified time range, multiple days are complemented at the same time to generate N process instances.
+    * supplement the data from September 19 to October 16
+
+```date not the same as cn version
+    <p align="center">
+        <img src="/img/complement_en.png" width="80%" />
+    </p>
+
+  > Serial mode: The complement is executed sequentially from September 19 to October 16, and a process instance is generated on the process instance page;
+
+  > Parallel mode: The tasks from September 19 to October 16 are executed simultaneously, and 28 process instances are generated on the process instance page.
+
+#### <span id=creatTiming>2.3.4 Workflow timing</span>
+
+- Create timing: Click Project Management->Workflow->Workflow Definition, enter the workflow definition page, go online the workflow, click the "timing" button <img src="/img/timing.png" width="35"/> ,The timing parameter setting dialog box pops up, as shown in the figure below:
+  <p align="center">
+      <img src="/img/time_schedule_en.png" width="80%" />
+  </p>
+- Choose the start and end time. In the start and end time range, the workflow is run at regular intervals; not in the start and end time range, no more regular workflow instances are generated.
+- Add a timing that is executed once every day at 5 AM, as shown in the following figure:
+  <p align="center">
+      <img src="/img/timer-en.png" width="80%" />
+  </p>
+- Failure strategy, notification strategy, process priority, worker group, notification group, recipient, and CC are the same as [workflow running parameters](#runParamers).
+- Click the "Create" button to create the timing successfully. At this time, the timing status is "**Offline**" and the timing needs to be **Online** to take effect.
+- Timing online: Click the "timing management" button <img src="/img/timeManagement.png" width="35"/>, enter the timing management page, click the "online" button, the timing status will change to "online", as shown in the below figure, the workflow takes effect regularly.
+  <p align="center">
+      <img src="/img/time-manage-list-en.png" width="80%" />
+  </p>
+
+#### 2.3.5 Import workflow
+
+Click Project Management -> Workflow -> Workflow Definition to enter the workflow definition page, click the "Import Workflow" button to import the local workflow file, the workflow definition list displays the imported workflow, and the status is offline.
+
+#### 2.4 Workflow example
+
+#### 2.4.1 View workflow example
+
+- Click Project Management -> Workflow -> Workflow Instance to enter the Workflow Instance page, as shown in the figure below:
+     <p align="center">
+        <img src="/img/instance-list-en.png" width="80%" />
+     </p>
+- Click the workflow name to enter the DAG view page to view the task execution status, as shown in the figure below.
+  <p align="center">
+    <img src="/img/instance-runs-en.png" width="80%" />
+  </p>
+
+#### 2.4.2 View task log
+
+- Enter the workflow instance page, click the workflow name, enter the DAG view page, double-click the task node, as shown in the following figure:
+   <p align="center">
+     <img src="/img/instanceViewLog-en.png" width="80%" />
+   </p>
+- Click "View Log", a log pop-up box will pop up, as shown in the figure below, the task log can also be viewed on the task instance page, refer to [Task View Log](#taskLog)。
+   <p align="center">
+     <img src="/img/task-log-en.png" width="80%" />
+   </p>
+
+#### 2.4.3 View task history
+
+- Click Project Management -> Workflow -> Workflow Instance to enter the workflow instance page, and click the workflow name to enter the workflow DAG page;
+- Double-click the task node, as shown in the figure below, click "View History" to jump to the task instance page, and display a list of task instances running by the workflow instance
+   <p align="center">
+     <img src="/img/task_history_en.png" width="80%" />
+   </p>
+
+#### 2.4.4 View operating parameters
+
+- Click Project Management -> Workflow -> Workflow Instance to enter the workflow instance page, and click the workflow name to enter the workflow DAG page;
+- Click the icon in the upper left corner<img src="/img/run_params_button.png" width="35"/>,View the startup parameters of the workflow instance; click the icon<img src="/img/global_param.png" width="35"/>,View the global and local parameters of the workflow instance, as shown in the following figure:
+   <p align="center">
+     <img src="/img/run_params_en.png" width="80%" />
+   </p>
+
+#### 2.4.4 Workflow instance operation function
+
+Click Project Management -> Workflow -> Workflow Instance to enter the Workflow Instance page, as shown in the figure below:
+
+  <p align="center">
+    <img src="/img/instance-list-en.png" width="80%" />
+  </p>
+
+- **Edit:** Only terminated processes can be edited. Click the "Edit" button or the name of the workflow instance to enter the DAG editing page. After editing, click the "Save" button to pop up the Save DAG pop-up box, as shown in the figure below. In the pop-up box, check "Whether to update to workflow definition" and save After that, the workflow definition will be updated; if it is not checked, the workflow definition will not be updated.
+     <p align="center">
+       <img src="/img/editDag-en.png" width="80%" />
+     </p>
+- **Rerun:** Re-execute the terminated process.
+- **Recovery failed:** For failed processes, you can perform recovery operations, starting from the failed node.
+- **stop:** To **stop** the running process, the background will first `kill`worker process, and then execute `kill -9` operation

Review comment:
       ```suggestion
   - **stop:** To **stop** the running process, the background will first `kill`worker process, and then execute `kill -9` operation       just kill process, why we need to kill worker process?
   ```

##########
File path: docs/en-us/1.3.2/user_doc/system-manual.md
##########
@@ -0,0 +1,876 @@
+# System User Manual
+
+## Get started quickly
+
+> Please refer to [Quick Start](quick-start.html)
+
+## Operation guide
+
+### 1. Home
+
+The home page contains task status statistics, process status statistics, and workflow definition statistics for all projects of the user.
+
+<p align="center">
+<img src="/img/home_en.png" width="80%" />
+</p>
+
+### 2. Project management
+
+#### 2.1 Create project
+
+- Click "Project Management" to enter the project management page, click the "Create Project" button, enter the project name, project description, and click "Submit" to create a new project.
+
+  <p align="center">
+      <img src="/img/create_project_en1.png" width="80%" />
+  </p>
+
+#### 2.2 Project home
+
+- Click the project name link on the project management page to enter the project home page, as shown in the figure below, the project home page contains the task status statistics, process status statistics, and workflow definition statistics of the project.
+  <p align="center">
+     <img src="/img/project_home_en.png" width="80%" />
+  </p>
+
+- Task status statistics: within the specified time range, count the number of task instances as successful submission, running, ready to pause, pause, ready to stop, stop, failure, success, fault tolerance, kill, and waiting threads
+- Process status statistics: within the specified time range, count the number of the status of the workflow instance as submission success, running, ready to pause, pause, ready to stop, stop, failure, success, fault tolerance, kill, and waiting threads
+- Workflow definition statistics: Count the workflow definitions created by this user and the workflow definitions granted to this user by the administrator
+
+#### 2.3 Workflow definition
+
+#### <span id=creatDag>2.3.1 Create workflow definition</span>
+
+- Click Project Management -> Workflow -> Workflow Definition to enter the workflow definition page, and click the "Create Workflow" button to enter the **workflow DAG edit** page, as shown in the following figure:
+  <p align="center">
+      <img src="/img/dag5.png" width="80%" />
+  </p>
+- Drag in the toolbar <img src="/img/shell.png" width="35"/> Add a Shell task to the drawing board, as shown in the figure below:
+  <p align="center">
+      <img src="/img/shell-en.png" width="80%" />
+  </p>
+- **Add parameter settings for this shell task:**
+
+1. Fill in the "Node Name", "Description", and "Script" fields;
+2. Check “Normal” for “Run Flag”. If “Prohibit Execution” is checked, the task will not be executed when the workflow runs;
+3. Select "Task Priority": When the number of worker threads is insufficient, high-level tasks will be executed first in the execution queue, and tasks with the same priority will be executed in the order of first in, first out;
+4. Timeout alarm (optional): Check the timeout alarm, timeout failure, and fill in the "timeout period". When the task execution time exceeds **timeout period**, an alert email will be sent and the task timeout fails;
+5. Resources (optional). Resource files are files created or uploaded on the Resource Center -> File Management page. For example, the file name is `test.sh`, and the command to call the resource in the script is `sh test.sh`;
+6. Custom parameters (optional), refer to [Custom Parameters](#UserDefinedParameters);
+7. Click the "Confirm Add" button to save the task settings.
+
+- **Increase the order of task execution:** Click the icon in the upper right corner <img src="/img/line.png" width="35"/> to connect the task; as shown in the figure below, task 2 and task 3 are executed in parallel, When task 1 finished execute, tasks 2 and 3 will be executed simultaneously.
+
+  <p align="center">
+     <img src="/img/dag6.png" width="80%" />
+  </p>
+
+- **Delete dependencies:** Click the "arrow" icon in the upper right corner <img src="/img/arrow.png" width="35"/>, select the connection line, and click the "Delete" icon in the upper right corner <img src= "/img/delete.png" width="35"/>, delete dependencies between tasks.
+  <p align="center">
+     <img src="/img/dag7.png" width="80%" />
+  </p>
+
+- **Save workflow definition:** Click the "Save" button, and the "Set DAG chart name" pop-up box will pop up, as shown in the figure below. Enter the workflow definition name, workflow definition description, and set global parameters (optional, refer to [ Custom parameters](#UserDefinedParameters)), click the "Add" button, and the workflow definition is created successfully.
+  <p align="center">
+     <img src="/img/dag8.png" width="80%" />
+   </p>
+> For other types of tasks, please refer to [Task Node Type and Parameter Settings](#TaskParamers).
+
+#### 2.3.2 Workflow definition operation function
+
+Click Project Management -> Workflow -> Workflow Definition to enter the workflow definition page, as shown below:
+
+<p align="center">
+<img src="/img/work_list_en.png" width="80%" />
+</p>
+The operation functions of the workflow definition list are as follows:
+
+- **Edit:** Only "offline" workflow definitions can be edited. Workflow DAG editing is the same as [Create Workflow Definition](#creatDag).
+- **Online:** When the workflow status is "Offline", used to online workflow. Only the workflow in the "Online" state can run, but cannot be edited.
+- **Offline:** When the workflow status is "Online", used to offline workflow. Only the workflow in the "Offline" state can be edited, but not run.
+- **Run:** Only workflow in the online state can run. See [2.3.3 Run Workflow](#runWorkflow) for the operation steps
+- **Timing:** Timing can only be set in online workflows, and the system automatically schedules the workflow to run on a regular basis. The status after creating a timing is "offline", and the timing must be online on the timing management page to take effect. See [2.3.4 Workflow Timing](#creatTiming) for timing operation steps.
+- **Timing Management:** The timing management page can be edited, online/offline, and deleted.
+- **Delete:** Delete the workflow definition.
+- **Download:** Download workflow definition to local.
+- **Tree Diagram:** Display the task node type and task status in a tree structure, as shown in the figure below:
+  <p align="center">
+      <img src="/img/tree_en.png" width="80%" />
+  </p>
+
+#### <span id=runWorkflow>2.3.3 Run the workflow</span>
+
+- Click Project Management -> Workflow -> Workflow Definition to enter the workflow definition page, as shown in the figure below, click the "Go Online" button <img src="/img/online.png" width="35"/>,Go online workflow.
+  <p align="center">
+      <img src="/img/work_list_en.png" width="80%" />
+  </p>
+
+- Click the "Run" button to pop up the startup parameter setting pop-up box, as shown in the figure below, set the startup parameters, click the "Run" button in the pop-up box, the workflow starts running, and the workflow instance page generates a workflow instance.
+     <p align="center">
+       <img src="/img/run_work_en.png" width="80%" />
+     </p>
+  <span id=runParamers>Description of workflow operating parameters:</span>
+
+      * Failure strategy: When a task node fails to execute, other parallel task nodes need to execute the strategy. "Continue" means: after a certain task fails, other task nodes execute normally; "End" means: terminate all tasks being executed, and terminate the entire process.
+      * Notification strategy: When the process is over, the process execution information notification email is sent according to the process status, including any status is not sent, successful sent, failed sent, successful or failed sent.
+      * Process priority: The priority of process operation, divided into five levels: highest (HIGHEST), high (HIGH), medium (MEDIUM), low (LOW), and lowest (LOWEST). When the number of master threads is insufficient, high-level processes will be executed first in the execution queue, and processes with the same priority will be executed in a first-in first-out order.
+      * Worker group: The process can only be executed in the specified worker machine group. The default is Default, which can be executed on any worker.
+      * Notification group: select notification strategy||timeout alarm||when fault tolerance occurs, process information or email will be sent to all members in the notification group.
+      * Recipient: Select notification policy||Timeout alarm||When fault tolerance occurs, process information or alarm email will be sent to the recipient list.
+      * Cc: Select the notification strategy||Timeout alarm||When fault tolerance occurs, the process information or warning email will be copied to the CC list.
+      * Complement: Two modes including serial complement and parallel complement. Serial complement: within the specified time range, the complement is executed sequentially from the start date to the end date, and only one process instance is generated; parallel complement: within the specified time range, multiple days are complemented at the same time to generate N process instances.
+    * supplement the data from September 19 to October 16
+
+```date not the same as cn version
+    <p align="center">
+        <img src="/img/complement_en.png" width="80%" />
+    </p>
+
+  > Serial mode: The complement is executed sequentially from September 19 to October 16, and a process instance is generated on the process instance page;
+
+  > Parallel mode: The tasks from September 19 to October 16 are executed simultaneously, and 28 process instances are generated on the process instance page.
+
+#### <span id=creatTiming>2.3.4 Workflow timing</span>
+
+- Create timing: Click Project Management->Workflow->Workflow Definition, enter the workflow definition page, go online the workflow, click the "timing" button <img src="/img/timing.png" width="35"/> ,The timing parameter setting dialog box pops up, as shown in the figure below:
+  <p align="center">
+      <img src="/img/time_schedule_en.png" width="80%" />
+  </p>
+- Choose the start and end time. In the start and end time range, the workflow is run at regular intervals; not in the start and end time range, no more regular workflow instances are generated.
+- Add a timing that is executed once every day at 5 AM, as shown in the following figure:
+  <p align="center">
+      <img src="/img/timer-en.png" width="80%" />
+  </p>
+- Failure strategy, notification strategy, process priority, worker group, notification group, recipient, and CC are the same as [workflow running parameters](#runParamers).
+- Click the "Create" button to create the timing successfully. At this time, the timing status is "**Offline**" and the timing needs to be **Online** to take effect.
+- Timing online: Click the "timing management" button <img src="/img/timeManagement.png" width="35"/>, enter the timing management page, click the "online" button, the timing status will change to "online", as shown in the below figure, the workflow takes effect regularly.
+  <p align="center">
+      <img src="/img/time-manage-list-en.png" width="80%" />
+  </p>
+
+#### 2.3.5 Import workflow
+
+Click Project Management -> Workflow -> Workflow Definition to enter the workflow definition page, click the "Import Workflow" button to import the local workflow file, the workflow definition list displays the imported workflow, and the status is offline.
+
+#### 2.4 Workflow example
+
+#### 2.4.1 View workflow example
+
+- Click Project Management -> Workflow -> Workflow Instance to enter the Workflow Instance page, as shown in the figure below:
+     <p align="center">
+        <img src="/img/instance-list-en.png" width="80%" />
+     </p>
+- Click the workflow name to enter the DAG view page to view the task execution status, as shown in the figure below.
+  <p align="center">
+    <img src="/img/instance-runs-en.png" width="80%" />
+  </p>
+
+#### 2.4.2 View task log
+
+- Enter the workflow instance page, click the workflow name, enter the DAG view page, double-click the task node, as shown in the following figure:
+   <p align="center">
+     <img src="/img/instanceViewLog-en.png" width="80%" />
+   </p>
+- Click "View Log", a log pop-up box will pop up, as shown in the figure below, the task log can also be viewed on the task instance page, refer to [Task View Log](#taskLog)。
+   <p align="center">
+     <img src="/img/task-log-en.png" width="80%" />
+   </p>
+
+#### 2.4.3 View task history
+
+- Click Project Management -> Workflow -> Workflow Instance to enter the workflow instance page, and click the workflow name to enter the workflow DAG page;
+- Double-click the task node, as shown in the figure below, click "View History" to jump to the task instance page, and display a list of task instances running by the workflow instance
+   <p align="center">
+     <img src="/img/task_history_en.png" width="80%" />
+   </p>
+
+#### 2.4.4 View operating parameters
+
+- Click Project Management -> Workflow -> Workflow Instance to enter the workflow instance page, and click the workflow name to enter the workflow DAG page;
+- Click the icon in the upper left corner<img src="/img/run_params_button.png" width="35"/>,View the startup parameters of the workflow instance; click the icon<img src="/img/global_param.png" width="35"/>,View the global and local parameters of the workflow instance, as shown in the following figure:
+   <p align="center">
+     <img src="/img/run_params_en.png" width="80%" />
+   </p>
+
+#### 2.4.4 Workflow instance operation function
+
+Click Project Management -> Workflow -> Workflow Instance to enter the Workflow Instance page, as shown in the figure below:
+
+  <p align="center">
+    <img src="/img/instance-list-en.png" width="80%" />
+  </p>
+
+- **Edit:** Only terminated processes can be edited. Click the "Edit" button or the name of the workflow instance to enter the DAG editing page. After editing, click the "Save" button to pop up the Save DAG pop-up box, as shown in the figure below. In the pop-up box, check "Whether to update to workflow definition" and save After that, the workflow definition will be updated; if it is not checked, the workflow definition will not be updated.
+     <p align="center">
+       <img src="/img/editDag-en.png" width="80%" />
+     </p>
+- **Rerun:** Re-execute the terminated process.
+- **Recovery failed:** For failed processes, you can perform recovery operations, starting from the failed node.
+- **stop:** To **stop** the running process, the background will first `kill`worker process, and then execute `kill -9` operation
+- **Pause:** Perform a **pause** operation on the running process, the system status will change to **waiting for execution**, it will wait for the end of the task being executed, and pause the next task to be executed.
+- **Resume pause:** To resume the paused process, start running directly from the **paused node**
+- **Delete:** Delete the workflow instance and the task instance under the workflow instance
+- **Gantt chart:** The vertical axis of the Gantt chart is the topological sorting of task instances under a certain workflow instance, and the horizontal axis is the running time of the task instances, as shown in the figure:
+     <p align="center">
+         <img src="/img/gantt-en.png" width="80%" />
+     </p>
+
+#### 2.5 Task instance
+
+- Click Project Management -> Workflow -> Task Instance to enter the task instance page, as shown in the figure below, click the name of the workflow instance, you can jump to the workflow instance DAG chart to view the task status.
+     <p align="center">
+        <img src="/img/task-list-en.png" width="80%" />
+     </p>
+
+- <span id=taskLog>View log:</span>Click the "view log" button in the operation column to view the log of task execution.
+     <p align="center">
+        <img src="/img/task-log2-en.png" width="80%" />
+     </p>
+
+### 3. Resource Center
+
+#### 3.1 hdfs resource configuration
+
+- Upload resource files and udf functions, all uploaded files and resources will be stored on hdfs, so the following configuration items are required:
+
+```
+
+conf/common/common.properties # Users who have permission to create directories under the HDFS root path
+hdfs.root.user=hdfs # data base dir, resource file will store to this hadoop hdfs path, self configuration, please make sure the directory exists on hdfs and have read write permissions。"/escheduler" is recommended
+data.store2hdfs.basepath=/dolphinscheduler # resource upload startup type : HDFS,S3,NONE

Review comment:
       ```suggestion
   data.store2hdfs.basepath=/dolphinscheduler
   # resource upload startup type : HDFS,S3,NONE
   ```

##########
File path: docs/en-us/1.3.2/user_doc/system-manual.md
##########
@@ -0,0 +1,876 @@
+# System User Manual
+
+## Get started quickly
+
+> Please refer to [Quick Start](quick-start.html)
+
+## Operation guide
+
+### 1. Home
+
+The home page contains task status statistics, process status statistics, and workflow definition statistics for all projects of the user.
+
+<p align="center">
+<img src="/img/home_en.png" width="80%" />
+</p>
+
+### 2. Project management
+
+#### 2.1 Create project
+
+- Click "Project Management" to enter the project management page, click the "Create Project" button, enter the project name, project description, and click "Submit" to create a new project.
+
+  <p align="center">
+      <img src="/img/create_project_en1.png" width="80%" />
+  </p>
+
+#### 2.2 Project home
+
+- Click the project name link on the project management page to enter the project home page, as shown in the figure below, the project home page contains the task status statistics, process status statistics, and workflow definition statistics of the project.
+  <p align="center">
+     <img src="/img/project_home_en.png" width="80%" />
+  </p>
+
+- Task status statistics: within the specified time range, count the number of task instances as successful submission, running, ready to pause, pause, ready to stop, stop, failure, success, fault tolerance, kill, and waiting threads
+- Process status statistics: within the specified time range, count the number of the status of the workflow instance as submission success, running, ready to pause, pause, ready to stop, stop, failure, success, fault tolerance, kill, and waiting threads
+- Workflow definition statistics: Count the workflow definitions created by this user and the workflow definitions granted to this user by the administrator
+
+#### 2.3 Workflow definition
+
+#### <span id=creatDag>2.3.1 Create workflow definition</span>
+
+- Click Project Management -> Workflow -> Workflow Definition to enter the workflow definition page, and click the "Create Workflow" button to enter the **workflow DAG edit** page, as shown in the following figure:
+  <p align="center">
+      <img src="/img/dag5.png" width="80%" />
+  </p>
+- Drag in the toolbar <img src="/img/shell.png" width="35"/> Add a Shell task to the drawing board, as shown in the figure below:
+  <p align="center">
+      <img src="/img/shell-en.png" width="80%" />
+  </p>
+- **Add parameter settings for this shell task:**
+
+1. Fill in the "Node Name", "Description", and "Script" fields;
+2. Check “Normal” for “Run Flag”. If “Prohibit Execution” is checked, the task will not be executed when the workflow runs;
+3. Select "Task Priority": When the number of worker threads is insufficient, high-level tasks will be executed first in the execution queue, and tasks with the same priority will be executed in the order of first in, first out;
+4. Timeout alarm (optional): Check the timeout alarm, timeout failure, and fill in the "timeout period". When the task execution time exceeds **timeout period**, an alert email will be sent and the task timeout fails;
+5. Resources (optional). Resource files are files created or uploaded on the Resource Center -> File Management page. For example, the file name is `test.sh`, and the command to call the resource in the script is `sh test.sh`;
+6. Custom parameters (optional), refer to [Custom Parameters](#UserDefinedParameters);
+7. Click the "Confirm Add" button to save the task settings.
+
+- **Increase the order of task execution:** Click the icon in the upper right corner <img src="/img/line.png" width="35"/> to connect the task; as shown in the figure below, task 2 and task 3 are executed in parallel, When task 1 finished execute, tasks 2 and 3 will be executed simultaneously.
+
+  <p align="center">
+     <img src="/img/dag6.png" width="80%" />
+  </p>
+
+- **Delete dependencies:** Click the "arrow" icon in the upper right corner <img src="/img/arrow.png" width="35"/>, select the connection line, and click the "Delete" icon in the upper right corner <img src= "/img/delete.png" width="35"/>, delete dependencies between tasks.
+  <p align="center">
+     <img src="/img/dag7.png" width="80%" />
+  </p>
+
+- **Save workflow definition:** Click the "Save" button, and the "Set DAG chart name" pop-up box will pop up, as shown in the figure below. Enter the workflow definition name, workflow definition description, and set global parameters (optional, refer to [ Custom parameters](#UserDefinedParameters)), click the "Add" button, and the workflow definition is created successfully.
+  <p align="center">
+     <img src="/img/dag8.png" width="80%" />
+   </p>
+> For other types of tasks, please refer to [Task Node Type and Parameter Settings](#TaskParamers).
+
+#### 2.3.2 Workflow definition operation function
+
+Click Project Management -> Workflow -> Workflow Definition to enter the workflow definition page, as shown below:
+
+<p align="center">
+<img src="/img/work_list_en.png" width="80%" />
+</p>
+The operation functions of the workflow definition list are as follows:
+
+- **Edit:** Only "offline" workflow definitions can be edited. Workflow DAG editing is the same as [Create Workflow Definition](#creatDag).
+- **Online:** When the workflow status is "Offline", used to online workflow. Only the workflow in the "Online" state can run, but cannot be edited.
+- **Offline:** When the workflow status is "Online", used to offline workflow. Only the workflow in the "Offline" state can be edited, but not run.
+- **Run:** Only workflow in the online state can run. See [2.3.3 Run Workflow](#runWorkflow) for the operation steps
+- **Timing:** Timing can only be set in online workflows, and the system automatically schedules the workflow to run on a regular basis. The status after creating a timing is "offline", and the timing must be online on the timing management page to take effect. See [2.3.4 Workflow Timing](#creatTiming) for timing operation steps.
+- **Timing Management:** The timing management page can be edited, online/offline, and deleted.
+- **Delete:** Delete the workflow definition.
+- **Download:** Download workflow definition to local.
+- **Tree Diagram:** Display the task node type and task status in a tree structure, as shown in the figure below:
+  <p align="center">
+      <img src="/img/tree_en.png" width="80%" />
+  </p>
+
+#### <span id=runWorkflow>2.3.3 Run the workflow</span>
+
+- Click Project Management -> Workflow -> Workflow Definition to enter the workflow definition page, as shown in the figure below, click the "Go Online" button <img src="/img/online.png" width="35"/>,Go online workflow.
+  <p align="center">
+      <img src="/img/work_list_en.png" width="80%" />
+  </p>
+
+- Click the "Run" button to pop up the startup parameter setting pop-up box, as shown in the figure below, set the startup parameters, click the "Run" button in the pop-up box, the workflow starts running, and the workflow instance page generates a workflow instance.
+     <p align="center">
+       <img src="/img/run_work_en.png" width="80%" />
+     </p>
+  <span id=runParamers>Description of workflow operating parameters:</span>
+
+      * Failure strategy: When a task node fails to execute, other parallel task nodes need to execute the strategy. "Continue" means: after a certain task fails, other task nodes execute normally; "End" means: terminate all tasks being executed, and terminate the entire process.
+      * Notification strategy: When the process is over, the process execution information notification email is sent according to the process status, including any status is not sent, successful sent, failed sent, successful or failed sent.
+      * Process priority: The priority of process operation, divided into five levels: highest (HIGHEST), high (HIGH), medium (MEDIUM), low (LOW), and lowest (LOWEST). When the number of master threads is insufficient, high-level processes will be executed first in the execution queue, and processes with the same priority will be executed in a first-in first-out order.
+      * Worker group: The process can only be executed in the specified worker machine group. The default is Default, which can be executed on any worker.
+      * Notification group: select notification strategy||timeout alarm||when fault tolerance occurs, process information or email will be sent to all members in the notification group.
+      * Recipient: Select notification policy||Timeout alarm||When fault tolerance occurs, process information or alarm email will be sent to the recipient list.
+      * Cc: Select the notification strategy||Timeout alarm||When fault tolerance occurs, the process information or warning email will be copied to the CC list.
+      * Complement: Two modes including serial complement and parallel complement. Serial complement: within the specified time range, the complement is executed sequentially from the start date to the end date, and only one process instance is generated; parallel complement: within the specified time range, multiple days are complemented at the same time to generate N process instances.
+    * supplement the data from September 19 to October 16
+
+```date not the same as cn version
+    <p align="center">
+        <img src="/img/complement_en.png" width="80%" />
+    </p>
+
+  > Serial mode: The complement is executed sequentially from September 19 to October 16, and a process instance is generated on the process instance page;
+
+  > Parallel mode: The tasks from September 19 to October 16 are executed simultaneously, and 28 process instances are generated on the process instance page.
+
+#### <span id=creatTiming>2.3.4 Workflow timing</span>
+
+- Create timing: Click Project Management->Workflow->Workflow Definition, enter the workflow definition page, go online the workflow, click the "timing" button <img src="/img/timing.png" width="35"/> ,The timing parameter setting dialog box pops up, as shown in the figure below:
+  <p align="center">
+      <img src="/img/time_schedule_en.png" width="80%" />
+  </p>
+- Choose the start and end time. In the start and end time range, the workflow is run at regular intervals; not in the start and end time range, no more regular workflow instances are generated.
+- Add a timing that is executed once every day at 5 AM, as shown in the following figure:
+  <p align="center">
+      <img src="/img/timer-en.png" width="80%" />
+  </p>
+- Failure strategy, notification strategy, process priority, worker group, notification group, recipient, and CC are the same as [workflow running parameters](#runParamers).
+- Click the "Create" button to create the timing successfully. At this time, the timing status is "**Offline**" and the timing needs to be **Online** to take effect.
+- Timing online: Click the "timing management" button <img src="/img/timeManagement.png" width="35"/>, enter the timing management page, click the "online" button, the timing status will change to "online", as shown in the below figure, the workflow takes effect regularly.
+  <p align="center">
+      <img src="/img/time-manage-list-en.png" width="80%" />
+  </p>
+
+#### 2.3.5 Import workflow
+
+Click Project Management -> Workflow -> Workflow Definition to enter the workflow definition page, click the "Import Workflow" button to import the local workflow file, the workflow definition list displays the imported workflow, and the status is offline.
+
+#### 2.4 Workflow example
+
+#### 2.4.1 View workflow example
+
+- Click Project Management -> Workflow -> Workflow Instance to enter the Workflow Instance page, as shown in the figure below:
+     <p align="center">
+        <img src="/img/instance-list-en.png" width="80%" />
+     </p>
+- Click the workflow name to enter the DAG view page to view the task execution status, as shown in the figure below.
+  <p align="center">
+    <img src="/img/instance-runs-en.png" width="80%" />
+  </p>
+
+#### 2.4.2 View task log
+
+- Enter the workflow instance page, click the workflow name, enter the DAG view page, double-click the task node, as shown in the following figure:
+   <p align="center">
+     <img src="/img/instanceViewLog-en.png" width="80%" />
+   </p>
+- Click "View Log", a log pop-up box will pop up, as shown in the figure below, the task log can also be viewed on the task instance page, refer to [Task View Log](#taskLog)。
+   <p align="center">
+     <img src="/img/task-log-en.png" width="80%" />
+   </p>
+
+#### 2.4.3 View task history
+
+- Click Project Management -> Workflow -> Workflow Instance to enter the workflow instance page, and click the workflow name to enter the workflow DAG page;
+- Double-click the task node, as shown in the figure below, click "View History" to jump to the task instance page, and display a list of task instances running by the workflow instance
+   <p align="center">
+     <img src="/img/task_history_en.png" width="80%" />
+   </p>
+
+#### 2.4.4 View operating parameters
+
+- Click Project Management -> Workflow -> Workflow Instance to enter the workflow instance page, and click the workflow name to enter the workflow DAG page;
+- Click the icon in the upper left corner<img src="/img/run_params_button.png" width="35"/>,View the startup parameters of the workflow instance; click the icon<img src="/img/global_param.png" width="35"/>,View the global and local parameters of the workflow instance, as shown in the following figure:
+   <p align="center">
+     <img src="/img/run_params_en.png" width="80%" />
+   </p>
+
+#### 2.4.4 Workflow instance operation function
+
+Click Project Management -> Workflow -> Workflow Instance to enter the Workflow Instance page, as shown in the figure below:
+
+  <p align="center">
+    <img src="/img/instance-list-en.png" width="80%" />
+  </p>
+
+- **Edit:** Only terminated processes can be edited. Click the "Edit" button or the name of the workflow instance to enter the DAG editing page. After editing, click the "Save" button to pop up the Save DAG pop-up box, as shown in the figure below. In the pop-up box, check "Whether to update to workflow definition" and save After that, the workflow definition will be updated; if it is not checked, the workflow definition will not be updated.
+     <p align="center">
+       <img src="/img/editDag-en.png" width="80%" />
+     </p>
+- **Rerun:** Re-execute the terminated process.
+- **Recovery failed:** For failed processes, you can perform recovery operations, starting from the failed node.
+- **stop:** To **stop** the running process, the background will first `kill`worker process, and then execute `kill -9` operation
+- **Pause:** Perform a **pause** operation on the running process, the system status will change to **waiting for execution**, it will wait for the end of the task being executed, and pause the next task to be executed.
+- **Resume pause:** To resume the paused process, start running directly from the **paused node**
+- **Delete:** Delete the workflow instance and the task instance under the workflow instance
+- **Gantt chart:** The vertical axis of the Gantt chart is the topological sorting of task instances under a certain workflow instance, and the horizontal axis is the running time of the task instances, as shown in the figure:
+     <p align="center">
+         <img src="/img/gantt-en.png" width="80%" />
+     </p>
+
+#### 2.5 Task instance
+
+- Click Project Management -> Workflow -> Task Instance to enter the task instance page, as shown in the figure below, click the name of the workflow instance, you can jump to the workflow instance DAG chart to view the task status.
+     <p align="center">
+        <img src="/img/task-list-en.png" width="80%" />
+     </p>
+
+- <span id=taskLog>View log:</span>Click the "view log" button in the operation column to view the log of task execution.
+     <p align="center">
+        <img src="/img/task-log2-en.png" width="80%" />
+     </p>
+
+### 3. Resource Center
+
+#### 3.1 hdfs resource configuration
+
+- Upload resource files and udf functions, all uploaded files and resources will be stored on hdfs, so the following configuration items are required:
+
+```
+
+conf/common/common.properties # Users who have permission to create directories under the HDFS root path
+hdfs.root.user=hdfs # data base dir, resource file will store to this hadoop hdfs path, self configuration, please make sure the directory exists on hdfs and have read write permissions。"/escheduler" is recommended
+data.store2hdfs.basepath=/dolphinscheduler # resource upload startup type : HDFS,S3,NONE
+res.upload.startup.type=HDFS # whether kerberos starts

Review comment:
       ```suggestion
   res.upload.startup.type=HDFS
   # whether kerberos starts
   ```

##########
File path: docs/en-us/1.3.2/user_doc/system-manual.md
##########
@@ -0,0 +1,876 @@
+# System User Manual
+
+## Get started quickly
+
+> Please refer to [Quick Start](quick-start.html)
+
+## Operation guide
+
+### 1. Home
+
+The home page contains task status statistics, process status statistics, and workflow definition statistics for all projects of the user.
+
+<p align="center">
+<img src="/img/home_en.png" width="80%" />
+</p>
+
+### 2. Project management
+
+#### 2.1 Create project
+
+- Click "Project Management" to enter the project management page, click the "Create Project" button, enter the project name, project description, and click "Submit" to create a new project.
+
+  <p align="center">
+      <img src="/img/create_project_en1.png" width="80%" />
+  </p>
+
+#### 2.2 Project home
+
+- Click the project name link on the project management page to enter the project home page, as shown in the figure below, the project home page contains the task status statistics, process status statistics, and workflow definition statistics of the project.
+  <p align="center">
+     <img src="/img/project_home_en.png" width="80%" />
+  </p>
+
+- Task status statistics: within the specified time range, count the number of task instances as successful submission, running, ready to pause, pause, ready to stop, stop, failure, success, fault tolerance, kill, and waiting threads
+- Process status statistics: within the specified time range, count the number of the status of the workflow instance as submission success, running, ready to pause, pause, ready to stop, stop, failure, success, fault tolerance, kill, and waiting threads
+- Workflow definition statistics: Count the workflow definitions created by this user and the workflow definitions granted to this user by the administrator
+
+#### 2.3 Workflow definition
+
+#### <span id=creatDag>2.3.1 Create workflow definition</span>
+
+- Click Project Management -> Workflow -> Workflow Definition to enter the workflow definition page, and click the "Create Workflow" button to enter the **workflow DAG edit** page, as shown in the following figure:
+  <p align="center">
+      <img src="/img/dag5.png" width="80%" />
+  </p>
+- Drag in the toolbar <img src="/img/shell.png" width="35"/> Add a Shell task to the drawing board, as shown in the figure below:
+  <p align="center">
+      <img src="/img/shell-en.png" width="80%" />
+  </p>
+- **Add parameter settings for this shell task:**
+
+1. Fill in the "Node Name", "Description", and "Script" fields;
+2. Check “Normal” for “Run Flag”. If “Prohibit Execution” is checked, the task will not be executed when the workflow runs;
+3. Select "Task Priority": When the number of worker threads is insufficient, high-level tasks will be executed first in the execution queue, and tasks with the same priority will be executed in the order of first in, first out;
+4. Timeout alarm (optional): Check the timeout alarm, timeout failure, and fill in the "timeout period". When the task execution time exceeds **timeout period**, an alert email will be sent and the task timeout fails;
+5. Resources (optional). Resource files are files created or uploaded on the Resource Center -> File Management page. For example, the file name is `test.sh`, and the command to call the resource in the script is `sh test.sh`;
+6. Custom parameters (optional), refer to [Custom Parameters](#UserDefinedParameters);
+7. Click the "Confirm Add" button to save the task settings.
+
+- **Increase the order of task execution:** Click the icon in the upper right corner <img src="/img/line.png" width="35"/> to connect the task; as shown in the figure below, task 2 and task 3 are executed in parallel, When task 1 finished execute, tasks 2 and 3 will be executed simultaneously.
+
+  <p align="center">
+     <img src="/img/dag6.png" width="80%" />
+  </p>
+
+- **Delete dependencies:** Click the "arrow" icon in the upper right corner <img src="/img/arrow.png" width="35"/>, select the connection line, and click the "Delete" icon in the upper right corner <img src= "/img/delete.png" width="35"/>, delete dependencies between tasks.
+  <p align="center">
+     <img src="/img/dag7.png" width="80%" />
+  </p>
+
+- **Save workflow definition:** Click the "Save" button, and the "Set DAG chart name" pop-up box will pop up, as shown in the figure below. Enter the workflow definition name, workflow definition description, and set global parameters (optional, refer to [ Custom parameters](#UserDefinedParameters)), click the "Add" button, and the workflow definition is created successfully.
+  <p align="center">
+     <img src="/img/dag8.png" width="80%" />
+   </p>
+> For other types of tasks, please refer to [Task Node Type and Parameter Settings](#TaskParamers).
+
+#### 2.3.2 Workflow definition operation function
+
+Click Project Management -> Workflow -> Workflow Definition to enter the workflow definition page, as shown below:
+
+<p align="center">
+<img src="/img/work_list_en.png" width="80%" />
+</p>
+The operation functions of the workflow definition list are as follows:
+
+- **Edit:** Only "offline" workflow definitions can be edited. Workflow DAG editing is the same as [Create Workflow Definition](#creatDag).
+- **Online:** When the workflow status is "Offline", used to online workflow. Only the workflow in the "Online" state can run, but cannot be edited.
+- **Offline:** When the workflow status is "Online", used to offline workflow. Only the workflow in the "Offline" state can be edited, but not run.
+- **Run:** Only workflow in the online state can run. See [2.3.3 Run Workflow](#runWorkflow) for the operation steps
+- **Timing:** Timing can only be set in online workflows, and the system automatically schedules the workflow to run on a regular basis. The status after creating a timing is "offline", and the timing must be online on the timing management page to take effect. See [2.3.4 Workflow Timing](#creatTiming) for timing operation steps.
+- **Timing Management:** The timing management page can be edited, online/offline, and deleted.
+- **Delete:** Delete the workflow definition.
+- **Download:** Download workflow definition to local.
+- **Tree Diagram:** Display the task node type and task status in a tree structure, as shown in the figure below:
+  <p align="center">
+      <img src="/img/tree_en.png" width="80%" />
+  </p>
+
+#### <span id=runWorkflow>2.3.3 Run the workflow</span>
+
+- Click Project Management -> Workflow -> Workflow Definition to enter the workflow definition page, as shown in the figure below, click the "Go Online" button <img src="/img/online.png" width="35"/>,Go online workflow.
+  <p align="center">
+      <img src="/img/work_list_en.png" width="80%" />
+  </p>
+
+- Click the "Run" button to pop up the startup parameter setting pop-up box, as shown in the figure below, set the startup parameters, click the "Run" button in the pop-up box, the workflow starts running, and the workflow instance page generates a workflow instance.
+     <p align="center">
+       <img src="/img/run_work_en.png" width="80%" />
+     </p>
+  <span id=runParamers>Description of workflow operating parameters:</span>
+
+      * Failure strategy: When a task node fails to execute, other parallel task nodes need to execute the strategy. "Continue" means: after a certain task fails, other task nodes execute normally; "End" means: terminate all tasks being executed, and terminate the entire process.
+      * Notification strategy: When the process is over, the process execution information notification email is sent according to the process status, including any status is not sent, successful sent, failed sent, successful or failed sent.
+      * Process priority: The priority of process operation, divided into five levels: highest (HIGHEST), high (HIGH), medium (MEDIUM), low (LOW), and lowest (LOWEST). When the number of master threads is insufficient, high-level processes will be executed first in the execution queue, and processes with the same priority will be executed in a first-in first-out order.
+      * Worker group: The process can only be executed in the specified worker machine group. The default is Default, which can be executed on any worker.
+      * Notification group: select notification strategy||timeout alarm||when fault tolerance occurs, process information or email will be sent to all members in the notification group.
+      * Recipient: Select notification policy||Timeout alarm||When fault tolerance occurs, process information or alarm email will be sent to the recipient list.
+      * Cc: Select the notification strategy||Timeout alarm||When fault tolerance occurs, the process information or warning email will be copied to the CC list.
+      * Complement: Two modes including serial complement and parallel complement. Serial complement: within the specified time range, the complement is executed sequentially from the start date to the end date, and only one process instance is generated; parallel complement: within the specified time range, multiple days are complemented at the same time to generate N process instances.
+    * supplement the data from September 19 to October 16
+
+```date not the same as cn version
+    <p align="center">
+        <img src="/img/complement_en.png" width="80%" />
+    </p>
+
+  > Serial mode: The complement is executed sequentially from September 19 to October 16, and a process instance is generated on the process instance page;
+
+  > Parallel mode: The tasks from September 19 to October 16 are executed simultaneously, and 28 process instances are generated on the process instance page.
+
+#### <span id=creatTiming>2.3.4 Workflow timing</span>
+
+- Create timing: Click Project Management->Workflow->Workflow Definition, enter the workflow definition page, go online the workflow, click the "timing" button <img src="/img/timing.png" width="35"/> ,The timing parameter setting dialog box pops up, as shown in the figure below:
+  <p align="center">
+      <img src="/img/time_schedule_en.png" width="80%" />
+  </p>
+- Choose the start and end time. In the start and end time range, the workflow is run at regular intervals; not in the start and end time range, no more regular workflow instances are generated.
+- Add a timing that is executed once every day at 5 AM, as shown in the following figure:
+  <p align="center">
+      <img src="/img/timer-en.png" width="80%" />
+  </p>
+- Failure strategy, notification strategy, process priority, worker group, notification group, recipient, and CC are the same as [workflow running parameters](#runParamers).
+- Click the "Create" button to create the timing successfully. At this time, the timing status is "**Offline**" and the timing needs to be **Online** to take effect.
+- Timing online: Click the "timing management" button <img src="/img/timeManagement.png" width="35"/>, enter the timing management page, click the "online" button, the timing status will change to "online", as shown in the below figure, the workflow takes effect regularly.
+  <p align="center">
+      <img src="/img/time-manage-list-en.png" width="80%" />
+  </p>
+
+#### 2.3.5 Import workflow
+
+Click Project Management -> Workflow -> Workflow Definition to enter the workflow definition page, click the "Import Workflow" button to import the local workflow file, the workflow definition list displays the imported workflow, and the status is offline.
+
+#### 2.4 Workflow example
+
+#### 2.4.1 View workflow example
+
+- Click Project Management -> Workflow -> Workflow Instance to enter the Workflow Instance page, as shown in the figure below:
+     <p align="center">
+        <img src="/img/instance-list-en.png" width="80%" />
+     </p>
+- Click the workflow name to enter the DAG view page to view the task execution status, as shown in the figure below.
+  <p align="center">
+    <img src="/img/instance-runs-en.png" width="80%" />
+  </p>
+
+#### 2.4.2 View task log
+
+- Enter the workflow instance page, click the workflow name, enter the DAG view page, double-click the task node, as shown in the following figure:
+   <p align="center">
+     <img src="/img/instanceViewLog-en.png" width="80%" />
+   </p>
+- Click "View Log", a log pop-up box will pop up, as shown in the figure below, the task log can also be viewed on the task instance page, refer to [Task View Log](#taskLog)。
+   <p align="center">
+     <img src="/img/task-log-en.png" width="80%" />
+   </p>
+
+#### 2.4.3 View task history
+
+- Click Project Management -> Workflow -> Workflow Instance to enter the workflow instance page, and click the workflow name to enter the workflow DAG page;
+- Double-click the task node, as shown in the figure below, click "View History" to jump to the task instance page, and display a list of task instances running by the workflow instance
+   <p align="center">
+     <img src="/img/task_history_en.png" width="80%" />
+   </p>
+
+#### 2.4.4 View operating parameters
+
+- Click Project Management -> Workflow -> Workflow Instance to enter the workflow instance page, and click the workflow name to enter the workflow DAG page;
+- Click the icon in the upper left corner<img src="/img/run_params_button.png" width="35"/>,View the startup parameters of the workflow instance; click the icon<img src="/img/global_param.png" width="35"/>,View the global and local parameters of the workflow instance, as shown in the following figure:
+   <p align="center">
+     <img src="/img/run_params_en.png" width="80%" />
+   </p>
+
+#### 2.4.4 Workflow instance operation function
+
+Click Project Management -> Workflow -> Workflow Instance to enter the Workflow Instance page, as shown in the figure below:
+
+  <p align="center">
+    <img src="/img/instance-list-en.png" width="80%" />
+  </p>
+
+- **Edit:** Only terminated processes can be edited. Click the "Edit" button or the name of the workflow instance to enter the DAG editing page. After editing, click the "Save" button to pop up the Save DAG pop-up box, as shown in the figure below. In the pop-up box, check "Whether to update to workflow definition" and save After that, the workflow definition will be updated; if it is not checked, the workflow definition will not be updated.
+     <p align="center">
+       <img src="/img/editDag-en.png" width="80%" />
+     </p>
+- **Rerun:** Re-execute the terminated process.
+- **Recovery failed:** For failed processes, you can perform recovery operations, starting from the failed node.
+- **stop:** To **stop** the running process, the background will first `kill`worker process, and then execute `kill -9` operation
+- **Pause:** Perform a **pause** operation on the running process, the system status will change to **waiting for execution**, it will wait for the end of the task being executed, and pause the next task to be executed.
+- **Resume pause:** To resume the paused process, start running directly from the **paused node**
+- **Delete:** Delete the workflow instance and the task instance under the workflow instance
+- **Gantt chart:** The vertical axis of the Gantt chart is the topological sorting of task instances under a certain workflow instance, and the horizontal axis is the running time of the task instances, as shown in the figure:
+     <p align="center">
+         <img src="/img/gantt-en.png" width="80%" />
+     </p>
+
+#### 2.5 Task instance
+
+- Click Project Management -> Workflow -> Task Instance to enter the task instance page, as shown in the figure below, click the name of the workflow instance, you can jump to the workflow instance DAG chart to view the task status.
+     <p align="center">
+        <img src="/img/task-list-en.png" width="80%" />
+     </p>
+
+- <span id=taskLog>View log:</span>Click the "view log" button in the operation column to view the log of task execution.
+     <p align="center">
+        <img src="/img/task-log2-en.png" width="80%" />
+     </p>
+
+### 3. Resource Center
+
+#### 3.1 hdfs resource configuration
+
+- Upload resource files and udf functions, all uploaded files and resources will be stored on hdfs, so the following configuration items are required:
+
+```
+
+conf/common/common.properties # Users who have permission to create directories under the HDFS root path
+hdfs.root.user=hdfs # data base dir, resource file will store to this hadoop hdfs path, self configuration, please make sure the directory exists on hdfs and have read write permissions。"/escheduler" is recommended
+data.store2hdfs.basepath=/dolphinscheduler # resource upload startup type : HDFS,S3,NONE
+res.upload.startup.type=HDFS # whether kerberos starts
+hadoop.security.authentication.startup.state=false # java.security.krb5.conf path
+java.security.krb5.conf.path=/opt/krb5.conf # loginUserFromKeytab user
+login.user.keytab.username=hdfs-mycluster@ESZ.COM # loginUserFromKeytab path
+login.user.keytab.path=/opt/hdfs.headless.keytab
+
+conf/common/hadoop.properties # ha or single namenode,If namenode ha needs to copy core-site.xml and hdfs-site.xml # to the conf directory,support s3,for example : s3a://dolphinscheduler
+fs.defaultFS=hdfs://mycluster:8020
+#resourcemanager ha note this need ips , this empty if single
+yarn.resourcemanager.ha.rm.ids=192.168.xx.xx,192.168.xx.xx # If it is a single resourcemanager, you only need to configure one host name. If it is resourcemanager HA, the default configuration is fine

Review comment:
       ```suggestion
   yarn.resourcemanager.ha.rm.ids=192.168.xx.xx,192.168.xx.xx
   # If it is a single resourcemanager, you only need to configure one host name. If it is resourcemanager HA, the default configuration is fine
   ```

##########
File path: docs/en-us/1.3.2/user_doc/system-manual.md
##########
@@ -0,0 +1,876 @@
+# System User Manual
+
+## Get started quickly
+
+> Please refer to [Quick Start](quick-start.html)
+
+## Operation guide
+
+### 1. Home
+
+The home page contains task status statistics, process status statistics, and workflow definition statistics for all projects of the user.
+
+<p align="center">
+<img src="/img/home_en.png" width="80%" />
+</p>
+
+### 2. Project management
+
+#### 2.1 Create project
+
+- Click "Project Management" to enter the project management page, click the "Create Project" button, enter the project name, project description, and click "Submit" to create a new project.
+
+  <p align="center">
+      <img src="/img/create_project_en1.png" width="80%" />
+  </p>
+
+#### 2.2 Project home
+
+- Click the project name link on the project management page to enter the project home page, as shown in the figure below, the project home page contains the task status statistics, process status statistics, and workflow definition statistics of the project.
+  <p align="center">
+     <img src="/img/project_home_en.png" width="80%" />
+  </p>
+
+- Task status statistics: within the specified time range, count the number of task instances as successful submission, running, ready to pause, pause, ready to stop, stop, failure, success, fault tolerance, kill, and waiting threads
+- Process status statistics: within the specified time range, count the number of the status of the workflow instance as submission success, running, ready to pause, pause, ready to stop, stop, failure, success, fault tolerance, kill, and waiting threads
+- Workflow definition statistics: Count the workflow definitions created by this user and the workflow definitions granted to this user by the administrator
+
+#### 2.3 Workflow definition
+
+#### <span id=creatDag>2.3.1 Create workflow definition</span>
+
+- Click Project Management -> Workflow -> Workflow Definition to enter the workflow definition page, and click the "Create Workflow" button to enter the **workflow DAG edit** page, as shown in the following figure:
+  <p align="center">
+      <img src="/img/dag5.png" width="80%" />
+  </p>
+- Drag in the toolbar <img src="/img/shell.png" width="35"/> Add a Shell task to the drawing board, as shown in the figure below:
+  <p align="center">
+      <img src="/img/shell-en.png" width="80%" />
+  </p>
+- **Add parameter settings for this shell task:**
+
+1. Fill in the "Node Name", "Description", and "Script" fields;
+2. Check “Normal” for “Run Flag”. If “Prohibit Execution” is checked, the task will not be executed when the workflow runs;
+3. Select "Task Priority": When the number of worker threads is insufficient, high-level tasks will be executed first in the execution queue, and tasks with the same priority will be executed in the order of first in, first out;
+4. Timeout alarm (optional): Check the timeout alarm, timeout failure, and fill in the "timeout period". When the task execution time exceeds **timeout period**, an alert email will be sent and the task timeout fails;
+5. Resources (optional). Resource files are files created or uploaded on the Resource Center -> File Management page. For example, the file name is `test.sh`, and the command to call the resource in the script is `sh test.sh`;
+6. Custom parameters (optional), refer to [Custom Parameters](#UserDefinedParameters);
+7. Click the "Confirm Add" button to save the task settings.
+
+- **Increase the order of task execution:** Click the icon in the upper right corner <img src="/img/line.png" width="35"/> to connect the task; as shown in the figure below, task 2 and task 3 are executed in parallel, When task 1 finished execute, tasks 2 and 3 will be executed simultaneously.
+
+  <p align="center">
+     <img src="/img/dag6.png" width="80%" />
+  </p>
+
+- **Delete dependencies:** Click the "arrow" icon in the upper right corner <img src="/img/arrow.png" width="35"/>, select the connection line, and click the "Delete" icon in the upper right corner <img src= "/img/delete.png" width="35"/>, delete dependencies between tasks.
+  <p align="center">
+     <img src="/img/dag7.png" width="80%" />
+  </p>
+
+- **Save workflow definition:** Click the "Save" button, and the "Set DAG chart name" pop-up box will pop up, as shown in the figure below. Enter the workflow definition name, workflow definition description, and set global parameters (optional, refer to [ Custom parameters](#UserDefinedParameters)), click the "Add" button, and the workflow definition is created successfully.
+  <p align="center">
+     <img src="/img/dag8.png" width="80%" />
+   </p>
+> For other types of tasks, please refer to [Task Node Type and Parameter Settings](#TaskParamers).
+
+#### 2.3.2 Workflow definition operation function
+
+Click Project Management -> Workflow -> Workflow Definition to enter the workflow definition page, as shown below:
+
+<p align="center">
+<img src="/img/work_list_en.png" width="80%" />
+</p>
+The operation functions of the workflow definition list are as follows:
+
+- **Edit:** Only "offline" workflow definitions can be edited. Workflow DAG editing is the same as [Create Workflow Definition](#creatDag).
+- **Online:** When the workflow status is "Offline", used to online workflow. Only the workflow in the "Online" state can run, but cannot be edited.
+- **Offline:** When the workflow status is "Online", used to offline workflow. Only the workflow in the "Offline" state can be edited, but not run.
+- **Run:** Only workflow in the online state can run. See [2.3.3 Run Workflow](#runWorkflow) for the operation steps
+- **Timing:** Timing can only be set in online workflows, and the system automatically schedules the workflow to run on a regular basis. The status after creating a timing is "offline", and the timing must be online on the timing management page to take effect. See [2.3.4 Workflow Timing](#creatTiming) for timing operation steps.
+- **Timing Management:** The timing management page can be edited, online/offline, and deleted.
+- **Delete:** Delete the workflow definition.
+- **Download:** Download workflow definition to local.
+- **Tree Diagram:** Display the task node type and task status in a tree structure, as shown in the figure below:
+  <p align="center">
+      <img src="/img/tree_en.png" width="80%" />
+  </p>
+
+#### <span id=runWorkflow>2.3.3 Run the workflow</span>
+
+- Click Project Management -> Workflow -> Workflow Definition to enter the workflow definition page, as shown in the figure below, click the "Go Online" button <img src="/img/online.png" width="35"/>,Go online workflow.
+  <p align="center">
+      <img src="/img/work_list_en.png" width="80%" />
+  </p>
+
+- Click the "Run" button to pop up the startup parameter setting pop-up box, as shown in the figure below, set the startup parameters, click the "Run" button in the pop-up box, the workflow starts running, and the workflow instance page generates a workflow instance.
+     <p align="center">
+       <img src="/img/run_work_en.png" width="80%" />
+     </p>
+  <span id=runParamers>Description of workflow operating parameters:</span>
+
+      * Failure strategy: When a task node fails to execute, other parallel task nodes need to execute the strategy. "Continue" means: after a certain task fails, other task nodes execute normally; "End" means: terminate all tasks being executed, and terminate the entire process.
+      * Notification strategy: When the process is over, the process execution information notification email is sent according to the process status, including any status is not sent, successful sent, failed sent, successful or failed sent.
+      * Process priority: The priority of process operation, divided into five levels: highest (HIGHEST), high (HIGH), medium (MEDIUM), low (LOW), and lowest (LOWEST). When the number of master threads is insufficient, high-level processes will be executed first in the execution queue, and processes with the same priority will be executed in a first-in first-out order.
+      * Worker group: The process can only be executed in the specified worker machine group. The default is Default, which can be executed on any worker.
+      * Notification group: select notification strategy||timeout alarm||when fault tolerance occurs, process information or email will be sent to all members in the notification group.
+      * Recipient: Select notification policy||Timeout alarm||When fault tolerance occurs, process information or alarm email will be sent to the recipient list.
+      * Cc: Select the notification strategy||Timeout alarm||When fault tolerance occurs, the process information or warning email will be copied to the CC list.
+      * Complement: Two modes including serial complement and parallel complement. Serial complement: within the specified time range, the complement is executed sequentially from the start date to the end date, and only one process instance is generated; parallel complement: within the specified time range, multiple days are complemented at the same time to generate N process instances.
+    * supplement the data from September 19 to October 16
+
+```date not the same as cn version
+    <p align="center">
+        <img src="/img/complement_en.png" width="80%" />
+    </p>
+
+  > Serial mode: The complement is executed sequentially from September 19 to October 16, and a process instance is generated on the process instance page;
+
+  > Parallel mode: The tasks from September 19 to October 16 are executed simultaneously, and 28 process instances are generated on the process instance page.
+
+#### <span id=creatTiming>2.3.4 Workflow timing</span>
+
+- Create timing: Click Project Management->Workflow->Workflow Definition, enter the workflow definition page, go online the workflow, click the "timing" button <img src="/img/timing.png" width="35"/> ,The timing parameter setting dialog box pops up, as shown in the figure below:
+  <p align="center">
+      <img src="/img/time_schedule_en.png" width="80%" />
+  </p>
+- Choose the start and end time. In the start and end time range, the workflow is run at regular intervals; not in the start and end time range, no more regular workflow instances are generated.
+- Add a timing that is executed once every day at 5 AM, as shown in the following figure:
+  <p align="center">
+      <img src="/img/timer-en.png" width="80%" />
+  </p>
+- Failure strategy, notification strategy, process priority, worker group, notification group, recipient, and CC are the same as [workflow running parameters](#runParamers).
+- Click the "Create" button to create the timing successfully. At this time, the timing status is "**Offline**" and the timing needs to be **Online** to take effect.
+- Timing online: Click the "timing management" button <img src="/img/timeManagement.png" width="35"/>, enter the timing management page, click the "online" button, the timing status will change to "online", as shown in the below figure, the workflow takes effect regularly.
+  <p align="center">
+      <img src="/img/time-manage-list-en.png" width="80%" />
+  </p>
+
+#### 2.3.5 Import workflow
+
+Click Project Management -> Workflow -> Workflow Definition to enter the workflow definition page, click the "Import Workflow" button to import the local workflow file, the workflow definition list displays the imported workflow, and the status is offline.
+
+#### 2.4 Workflow example
+
+#### 2.4.1 View workflow example
+
+- Click Project Management -> Workflow -> Workflow Instance to enter the Workflow Instance page, as shown in the figure below:
+     <p align="center">
+        <img src="/img/instance-list-en.png" width="80%" />
+     </p>
+- Click the workflow name to enter the DAG view page to view the task execution status, as shown in the figure below.
+  <p align="center">
+    <img src="/img/instance-runs-en.png" width="80%" />
+  </p>
+
+#### 2.4.2 View task log
+
+- Enter the workflow instance page, click the workflow name, enter the DAG view page, double-click the task node, as shown in the following figure:
+   <p align="center">
+     <img src="/img/instanceViewLog-en.png" width="80%" />
+   </p>
+- Click "View Log", a log pop-up box will pop up, as shown in the figure below, the task log can also be viewed on the task instance page, refer to [Task View Log](#taskLog)。
+   <p align="center">
+     <img src="/img/task-log-en.png" width="80%" />
+   </p>
+
+#### 2.4.3 View task history
+
+- Click Project Management -> Workflow -> Workflow Instance to enter the workflow instance page, and click the workflow name to enter the workflow DAG page;
+- Double-click the task node, as shown in the figure below, click "View History" to jump to the task instance page, and display a list of task instances running by the workflow instance
+   <p align="center">
+     <img src="/img/task_history_en.png" width="80%" />
+   </p>
+
+#### 2.4.4 View operating parameters
+
+- Click Project Management -> Workflow -> Workflow Instance to enter the workflow instance page, and click the workflow name to enter the workflow DAG page;
+- Click the icon in the upper left corner<img src="/img/run_params_button.png" width="35"/>,View the startup parameters of the workflow instance; click the icon<img src="/img/global_param.png" width="35"/>,View the global and local parameters of the workflow instance, as shown in the following figure:
+   <p align="center">
+     <img src="/img/run_params_en.png" width="80%" />
+   </p>
+
+#### 2.4.4 Workflow instance operation function
+
+Click Project Management -> Workflow -> Workflow Instance to enter the Workflow Instance page, as shown in the figure below:
+
+  <p align="center">
+    <img src="/img/instance-list-en.png" width="80%" />
+  </p>
+
+- **Edit:** Only terminated processes can be edited. Click the "Edit" button or the name of the workflow instance to enter the DAG editing page. After editing, click the "Save" button to pop up the Save DAG pop-up box, as shown in the figure below. In the pop-up box, check "Whether to update to workflow definition" and save After that, the workflow definition will be updated; if it is not checked, the workflow definition will not be updated.
+     <p align="center">
+       <img src="/img/editDag-en.png" width="80%" />
+     </p>
+- **Rerun:** Re-execute the terminated process.
+- **Recovery failed:** For failed processes, you can perform recovery operations, starting from the failed node.
+- **stop:** To **stop** the running process, the background will first `kill`worker process, and then execute `kill -9` operation
+- **Pause:** Perform a **pause** operation on the running process, the system status will change to **waiting for execution**, it will wait for the end of the task being executed, and pause the next task to be executed.
+- **Resume pause:** To resume the paused process, start running directly from the **paused node**
+- **Delete:** Delete the workflow instance and the task instance under the workflow instance
+- **Gantt chart:** The vertical axis of the Gantt chart is the topological sorting of task instances under a certain workflow instance, and the horizontal axis is the running time of the task instances, as shown in the figure:
+     <p align="center">
+         <img src="/img/gantt-en.png" width="80%" />
+     </p>
+
+#### 2.5 Task instance
+
+- Click Project Management -> Workflow -> Task Instance to enter the task instance page, as shown in the figure below, click the name of the workflow instance, you can jump to the workflow instance DAG chart to view the task status.
+     <p align="center">
+        <img src="/img/task-list-en.png" width="80%" />
+     </p>
+
+- <span id=taskLog>View log:</span>Click the "view log" button in the operation column to view the log of task execution.
+     <p align="center">
+        <img src="/img/task-log2-en.png" width="80%" />
+     </p>
+
+### 3. Resource Center
+
+#### 3.1 hdfs resource configuration
+
+- Upload resource files and udf functions, all uploaded files and resources will be stored on hdfs, so the following configuration items are required:
+
+```
+
+conf/common/common.properties # Users who have permission to create directories under the HDFS root path
+hdfs.root.user=hdfs # data base dir, resource file will store to this hadoop hdfs path, self configuration, please make sure the directory exists on hdfs and have read write permissions。"/escheduler" is recommended
+data.store2hdfs.basepath=/dolphinscheduler # resource upload startup type : HDFS,S3,NONE
+res.upload.startup.type=HDFS # whether kerberos starts
+hadoop.security.authentication.startup.state=false # java.security.krb5.conf path
+java.security.krb5.conf.path=/opt/krb5.conf # loginUserFromKeytab user
+login.user.keytab.username=hdfs-mycluster@ESZ.COM # loginUserFromKeytab path
+login.user.keytab.path=/opt/hdfs.headless.keytab
+
+conf/common/hadoop.properties # ha or single namenode,If namenode ha needs to copy core-site.xml and hdfs-site.xml # to the conf directory,support s3,for example : s3a://dolphinscheduler

Review comment:
       ```suggestion
   conf/common/hadoop.properties
   # ha or single namenode,If namenode ha needs to copy core-site.xml and hdfs-site.xml # to the conf directory,support s3,for example : s3a://dolphinscheduler
   ```

##########
File path: docs/en-us/1.3.2/user_doc/system-manual.md
##########
@@ -0,0 +1,876 @@
+# System User Manual
+
+## Get started quickly
+
+> Please refer to [Quick Start](quick-start.html)
+
+## Operation guide
+
+### 1. Home
+
+The home page contains task status statistics, process status statistics, and workflow definition statistics for all projects of the user.
+
+<p align="center">
+<img src="/img/home_en.png" width="80%" />
+</p>
+
+### 2. Project management
+
+#### 2.1 Create project
+
+- Click "Project Management" to enter the project management page, click the "Create Project" button, enter the project name, project description, and click "Submit" to create a new project.
+
+  <p align="center">
+      <img src="/img/create_project_en1.png" width="80%" />
+  </p>
+
+#### 2.2 Project home
+
+- Click the project name link on the project management page to enter the project home page, as shown in the figure below, the project home page contains the task status statistics, process status statistics, and workflow definition statistics of the project.
+  <p align="center">
+     <img src="/img/project_home_en.png" width="80%" />
+  </p>
+
+- Task status statistics: within the specified time range, count the number of task instances as successful submission, running, ready to pause, pause, ready to stop, stop, failure, success, fault tolerance, kill, and waiting threads
+- Process status statistics: within the specified time range, count the number of the status of the workflow instance as submission success, running, ready to pause, pause, ready to stop, stop, failure, success, fault tolerance, kill, and waiting threads
+- Workflow definition statistics: Count the workflow definitions created by this user and the workflow definitions granted to this user by the administrator
+
+#### 2.3 Workflow definition
+
+#### <span id=creatDag>2.3.1 Create workflow definition</span>
+
+- Click Project Management -> Workflow -> Workflow Definition to enter the workflow definition page, and click the "Create Workflow" button to enter the **workflow DAG edit** page, as shown in the following figure:
+  <p align="center">
+      <img src="/img/dag5.png" width="80%" />
+  </p>
+- Drag in the toolbar <img src="/img/shell.png" width="35"/> Add a Shell task to the drawing board, as shown in the figure below:
+  <p align="center">
+      <img src="/img/shell-en.png" width="80%" />
+  </p>
+- **Add parameter settings for this shell task:**
+
+1. Fill in the "Node Name", "Description", and "Script" fields;
+2. Check “Normal” for “Run Flag”. If “Prohibit Execution” is checked, the task will not be executed when the workflow runs;
+3. Select "Task Priority": When the number of worker threads is insufficient, high-level tasks will be executed first in the execution queue, and tasks with the same priority will be executed in the order of first in, first out;
+4. Timeout alarm (optional): Check the timeout alarm, timeout failure, and fill in the "timeout period". When the task execution time exceeds **timeout period**, an alert email will be sent and the task timeout fails;
+5. Resources (optional). Resource files are files created or uploaded on the Resource Center -> File Management page. For example, the file name is `test.sh`, and the command to call the resource in the script is `sh test.sh`;
+6. Custom parameters (optional), refer to [Custom Parameters](#UserDefinedParameters);
+7. Click the "Confirm Add" button to save the task settings.
+
+- **Increase the order of task execution:** Click the icon in the upper right corner <img src="/img/line.png" width="35"/> to connect the task; as shown in the figure below, task 2 and task 3 are executed in parallel, When task 1 finished execute, tasks 2 and 3 will be executed simultaneously.
+
+  <p align="center">
+     <img src="/img/dag6.png" width="80%" />
+  </p>
+
+- **Delete dependencies:** Click the "arrow" icon in the upper right corner <img src="/img/arrow.png" width="35"/>, select the connection line, and click the "Delete" icon in the upper right corner <img src= "/img/delete.png" width="35"/>, delete dependencies between tasks.
+  <p align="center">
+     <img src="/img/dag7.png" width="80%" />
+  </p>
+
+- **Save workflow definition:** Click the "Save" button, and the "Set DAG chart name" pop-up box will pop up, as shown in the figure below. Enter the workflow definition name, workflow definition description, and set global parameters (optional, refer to [ Custom parameters](#UserDefinedParameters)), click the "Add" button, and the workflow definition is created successfully.
+  <p align="center">
+     <img src="/img/dag8.png" width="80%" />
+   </p>
+> For other types of tasks, please refer to [Task Node Type and Parameter Settings](#TaskParamers).
+
+#### 2.3.2 Workflow definition operation function
+
+Click Project Management -> Workflow -> Workflow Definition to enter the workflow definition page, as shown below:
+
+<p align="center">
+<img src="/img/work_list_en.png" width="80%" />
+</p>
+The operation functions of the workflow definition list are as follows:
+
+- **Edit:** Only "offline" workflow definitions can be edited. Workflow DAG editing is the same as [Create Workflow Definition](#creatDag).
+- **Online:** When the workflow status is "Offline", used to online workflow. Only the workflow in the "Online" state can run, but cannot be edited.
+- **Offline:** When the workflow status is "Online", used to offline workflow. Only the workflow in the "Offline" state can be edited, but not run.
+- **Run:** Only workflow in the online state can run. See [2.3.3 Run Workflow](#runWorkflow) for the operation steps
+- **Timing:** Timing can only be set in online workflows, and the system automatically schedules the workflow to run on a regular basis. The status after creating a timing is "offline", and the timing must be online on the timing management page to take effect. See [2.3.4 Workflow Timing](#creatTiming) for timing operation steps.
+- **Timing Management:** The timing management page can be edited, online/offline, and deleted.
+- **Delete:** Delete the workflow definition.
+- **Download:** Download workflow definition to local.
+- **Tree Diagram:** Display the task node type and task status in a tree structure, as shown in the figure below:
+  <p align="center">
+      <img src="/img/tree_en.png" width="80%" />
+  </p>
+
+#### <span id=runWorkflow>2.3.3 Run the workflow</span>
+
+- Click Project Management -> Workflow -> Workflow Definition to enter the workflow definition page, as shown in the figure below, click the "Go Online" button <img src="/img/online.png" width="35"/>,Go online workflow.
+  <p align="center">
+      <img src="/img/work_list_en.png" width="80%" />
+  </p>
+
+- Click the "Run" button to pop up the startup parameter setting pop-up box, as shown in the figure below, set the startup parameters, click the "Run" button in the pop-up box, the workflow starts running, and the workflow instance page generates a workflow instance.
+     <p align="center">
+       <img src="/img/run_work_en.png" width="80%" />
+     </p>
+  <span id=runParamers>Description of workflow operating parameters:</span>
+
+      * Failure strategy: When a task node fails to execute, other parallel task nodes need to execute the strategy. "Continue" means: after a certain task fails, other task nodes execute normally; "End" means: terminate all tasks being executed, and terminate the entire process.
+      * Notification strategy: When the process is over, the process execution information notification email is sent according to the process status, including any status is not sent, successful sent, failed sent, successful or failed sent.
+      * Process priority: The priority of process operation, divided into five levels: highest (HIGHEST), high (HIGH), medium (MEDIUM), low (LOW), and lowest (LOWEST). When the number of master threads is insufficient, high-level processes will be executed first in the execution queue, and processes with the same priority will be executed in a first-in first-out order.
+      * Worker group: The process can only be executed in the specified worker machine group. The default is Default, which can be executed on any worker.
+      * Notification group: select notification strategy||timeout alarm||when fault tolerance occurs, process information or email will be sent to all members in the notification group.
+      * Recipient: Select notification policy||Timeout alarm||When fault tolerance occurs, process information or alarm email will be sent to the recipient list.
+      * Cc: Select the notification strategy||Timeout alarm||When fault tolerance occurs, the process information or warning email will be copied to the CC list.
+      * Complement: Two modes including serial complement and parallel complement. Serial complement: within the specified time range, the complement is executed sequentially from the start date to the end date, and only one process instance is generated; parallel complement: within the specified time range, multiple days are complemented at the same time to generate N process instances.
+    * supplement the data from September 19 to October 16
+
+```date not the same as cn version
+    <p align="center">
+        <img src="/img/complement_en.png" width="80%" />
+    </p>
+
+  > Serial mode: The complement is executed sequentially from September 19 to October 16, and a process instance is generated on the process instance page;
+
+  > Parallel mode: The tasks from September 19 to October 16 are executed simultaneously, and 28 process instances are generated on the process instance page.
+
+#### <span id=creatTiming>2.3.4 Workflow timing</span>
+
+- Create timing: Click Project Management->Workflow->Workflow Definition, enter the workflow definition page, go online the workflow, click the "timing" button <img src="/img/timing.png" width="35"/> ,The timing parameter setting dialog box pops up, as shown in the figure below:
+  <p align="center">
+      <img src="/img/time_schedule_en.png" width="80%" />
+  </p>
+- Choose the start and end time. In the start and end time range, the workflow is run at regular intervals; not in the start and end time range, no more regular workflow instances are generated.
+- Add a timing that is executed once every day at 5 AM, as shown in the following figure:
+  <p align="center">
+      <img src="/img/timer-en.png" width="80%" />
+  </p>
+- Failure strategy, notification strategy, process priority, worker group, notification group, recipient, and CC are the same as [workflow running parameters](#runParamers).
+- Click the "Create" button to create the timing successfully. At this time, the timing status is "**Offline**" and the timing needs to be **Online** to take effect.
+- Timing online: Click the "timing management" button <img src="/img/timeManagement.png" width="35"/>, enter the timing management page, click the "online" button, the timing status will change to "online", as shown in the below figure, the workflow takes effect regularly.
+  <p align="center">
+      <img src="/img/time-manage-list-en.png" width="80%" />
+  </p>
+
+#### 2.3.5 Import workflow
+
+Click Project Management -> Workflow -> Workflow Definition to enter the workflow definition page, click the "Import Workflow" button to import the local workflow file, the workflow definition list displays the imported workflow, and the status is offline.
+
+#### 2.4 Workflow example
+
+#### 2.4.1 View workflow example
+
+- Click Project Management -> Workflow -> Workflow Instance to enter the Workflow Instance page, as shown in the figure below:
+     <p align="center">
+        <img src="/img/instance-list-en.png" width="80%" />
+     </p>
+- Click the workflow name to enter the DAG view page to view the task execution status, as shown in the figure below.
+  <p align="center">
+    <img src="/img/instance-runs-en.png" width="80%" />
+  </p>
+
+#### 2.4.2 View task log
+
+- Enter the workflow instance page, click the workflow name, enter the DAG view page, double-click the task node, as shown in the following figure:
+   <p align="center">
+     <img src="/img/instanceViewLog-en.png" width="80%" />
+   </p>
+- Click "View Log", a log pop-up box will pop up, as shown in the figure below, the task log can also be viewed on the task instance page, refer to [Task View Log](#taskLog)。
+   <p align="center">
+     <img src="/img/task-log-en.png" width="80%" />
+   </p>
+
+#### 2.4.3 View task history
+
+- Click Project Management -> Workflow -> Workflow Instance to enter the workflow instance page, and click the workflow name to enter the workflow DAG page;
+- Double-click the task node, as shown in the figure below, click "View History" to jump to the task instance page, and display a list of task instances running by the workflow instance
+   <p align="center">
+     <img src="/img/task_history_en.png" width="80%" />
+   </p>
+
+#### 2.4.4 View operating parameters
+
+- Click Project Management -> Workflow -> Workflow Instance to enter the workflow instance page, and click the workflow name to enter the workflow DAG page;
+- Click the icon in the upper left corner<img src="/img/run_params_button.png" width="35"/>,View the startup parameters of the workflow instance; click the icon<img src="/img/global_param.png" width="35"/>,View the global and local parameters of the workflow instance, as shown in the following figure:
+   <p align="center">
+     <img src="/img/run_params_en.png" width="80%" />
+   </p>
+
+#### 2.4.4 Workflow instance operation function
+
+Click Project Management -> Workflow -> Workflow Instance to enter the Workflow Instance page, as shown in the figure below:
+
+  <p align="center">
+    <img src="/img/instance-list-en.png" width="80%" />
+  </p>
+
+- **Edit:** Only terminated processes can be edited. Click the "Edit" button or the name of the workflow instance to enter the DAG editing page. After editing, click the "Save" button to pop up the Save DAG pop-up box, as shown in the figure below. In the pop-up box, check "Whether to update to workflow definition" and save After that, the workflow definition will be updated; if it is not checked, the workflow definition will not be updated.
+     <p align="center">
+       <img src="/img/editDag-en.png" width="80%" />
+     </p>
+- **Rerun:** Re-execute the terminated process.
+- **Recovery failed:** For failed processes, you can perform recovery operations, starting from the failed node.
+- **stop:** To **stop** the running process, the background will first `kill`worker process, and then execute `kill -9` operation
+- **Pause:** Perform a **pause** operation on the running process, the system status will change to **waiting for execution**, it will wait for the end of the task being executed, and pause the next task to be executed.
+- **Resume pause:** To resume the paused process, start running directly from the **paused node**
+- **Delete:** Delete the workflow instance and the task instance under the workflow instance
+- **Gantt chart:** The vertical axis of the Gantt chart is the topological sorting of task instances under a certain workflow instance, and the horizontal axis is the running time of the task instances, as shown in the figure:
+     <p align="center">
+         <img src="/img/gantt-en.png" width="80%" />
+     </p>
+
+#### 2.5 Task instance
+
+- Click Project Management -> Workflow -> Task Instance to enter the task instance page, as shown in the figure below, click the name of the workflow instance, you can jump to the workflow instance DAG chart to view the task status.
+     <p align="center">
+        <img src="/img/task-list-en.png" width="80%" />
+     </p>
+
+- <span id=taskLog>View log:</span>Click the "view log" button in the operation column to view the log of task execution.
+     <p align="center">
+        <img src="/img/task-log2-en.png" width="80%" />
+     </p>
+
+### 3. Resource Center
+
+#### 3.1 hdfs resource configuration
+
+- Upload resource files and udf functions, all uploaded files and resources will be stored on hdfs, so the following configuration items are required:
+
+```
+
+conf/common/common.properties # Users who have permission to create directories under the HDFS root path
+hdfs.root.user=hdfs # data base dir, resource file will store to this hadoop hdfs path, self configuration, please make sure the directory exists on hdfs and have read write permissions。"/escheduler" is recommended
+data.store2hdfs.basepath=/dolphinscheduler # resource upload startup type : HDFS,S3,NONE
+res.upload.startup.type=HDFS # whether kerberos starts
+hadoop.security.authentication.startup.state=false # java.security.krb5.conf path
+java.security.krb5.conf.path=/opt/krb5.conf # loginUserFromKeytab user
+login.user.keytab.username=hdfs-mycluster@ESZ.COM # loginUserFromKeytab path

Review comment:
       ```suggestion
   login.user.keytab.username=hdfs-mycluster@ESZ.COM
   # loginUserFromKeytab path
   ```


----------------------------------------------------------------
This is an automated message from the Apache Git Service.
To respond to the message, please log on to GitHub and use the
URL above to go to the specific comment.

For queries about this service, please contact Infrastructure at:
users@infra.apache.org
[GitHub] [incubator-dolphinscheduler-website] AhahaGe commented on a change in pull request #190: [Feature][Docs] Add English version of "system-manual" to the documentation
Posted by GitBox <gi...@apache.org>.
AhahaGe commented on a change in pull request #190:
URL: https://github.com/apache/incubator-dolphinscheduler-website/pull/190#discussion_r503238613


##########
File path: docs/en-us/1.3.2/user_doc/system-manual.md
##########
@@ -0,0 +1,883 @@
+# System User Manual
+
+## Get started quickly
+
+> Please refer to [Quick Start](quick-start.html)
+
+## Operation guide
+
+### 1. Home
+
+The home page contains task status statistics, process status statistics, and workflow definition statistics for all projects of the user.
+
+<p align="center">
+<img src="/img/home_en.png" width="80%" />
+</p>
+
+### 2. Project management
+
+#### 2.1 Create project
+
+- Click "Project Management" to enter the project management page, click the "Create Project" button, enter the project name, project description, and click "Submit" to create a new project.
+
+  <p align="center">
+      <img src="/img/create_project_en1.png" width="80%" />
+  </p>
+
+#### 2.2 Project home
+
+- Click the project name link on the project management page to enter the project home page, as shown in the figure below, the project home page contains the task status statistics, process status statistics, and workflow definition statistics of the project.
+  <p align="center">
+     <img src="/img/project_home_en.png" width="80%" />
+  </p>
+
+- Task status statistics: within the specified time range, count the number of tasks in the task instance as successful submission, running, ready to pause, pause, ready to stop, stop, failure, success, fault tolerance, kill, and waiting threads
+- Process status statistics: within the specified time range, count the number of the status of the workflow instance as submission success, running, ready to pause, pause, ready to stop, stop, failure, success, fault tolerance, kill, and waiting threads
+- Workflow definition statistics: Count the workflow definitions created by users and the workflow definitions granted to this user by the administrator
+
+#### 2.3 Workflow definition
+
+#### <span id=creatDag>2.3.1 Create a workflow definition</span>
+
+- Click Project Management -> Workflow -> Workflow Definition to enter the workflow definition page, and click the "Create Workflow" button to enter the **workflow DAG edit** page, as shown in the following figure:
+  <p align="center">
+      <img src="/img/dag5.png" width="80%" />
+  </p>
+- Drag in the toolbar <img src="/img/shell.png" width="35"/> Add a Shell task to the drawing board, as shown in the figure below:
+  <p align="center">
+      <img src="/img/shell-en.png" width="80%" />
+  </p>
+- **Add parameter settings for shell tasks:**
+
+1. Fill in the "Node Name", "Description", and "Script" fields;
+2. Check “Normal” for “Run Flag”. If “Prohibit Execution” is checked, the task will not be executed when running the workflow;
+3. Select "Task Priority": When the number of worker threads is insufficient, high-level tasks will be executed first in the execution queue, and tasks with the same priority will be executed in the order of first in, first out;
+4. Timeout alarm (not required): Check the timeout alarm, timeout failure, and fill in the "timeout period". When the task execution time exceeds **timeout period**, an alert email will be sent and the task timeout fails;
+5. Resources (optional). Resource files are files created or uploaded on the Resource Center -> File Management page. For example, the file name is `test.sh`, and the command to call the resource in the script is `sh test.sh`;
+6. Custom parameters (not required), refer to [Custom Parameters](#UserDefinedParameters);
+7. Click the "Confirm Add" button to save the task settings.
+
+- **Increase the order of task execution:** Click the icon in the upper right corner <img src="/img/line.png" width="35"/> to connect the task; as shown in the figure below, task 2 and task 3 are executed in parallel, When task 1 is executed, tasks 2 and 3 will be executed simultaneously.
+
+  <p align="center">
+     <img src="/img/dag6.png" width="80%" />
+  </p>
+
+- **Delete dependencies:** Click the "arrow" icon in the upper right corner <img src="/img/arrow.png" width="35"/>, select the connection line, and click the "Delete" icon in the upper right corner <img src= "/img/delete.png" width="35"/>, delete dependencies between tasks.
+  <p align="center">
+     <img src="/img/dag7.png" width="80%" />
+  </p>
+
+- **Save workflow definition:** Click the "Save" button, and the "Set DAG chart name" pop-up box will pop up, as shown in the figure below. Enter the workflow definition name, workflow definition description, and set global parameters (optional, refer to [ Custom parameters](#UserDefinedParameters)), click the "Add" button, and the workflow definition is created successfully.
+  <p align="center">
+     <img src="/img/dag8.png" width="80%" />
+   </p>
+> For other types of tasks, please refer to [Task Node Type and Parameter Settings](#TaskParamers).
+
+#### 2.3.2 Workflow definition operation function
+
+Click Project Management -> Workflow -> Workflow Definition to enter the workflow definition page, as shown below:
+
+<p align="center">
+<img src="/img/work_list_en.png" width="80%" />
+</p>
+The operation functions of the workflow definition list are as follows:
+
+- **Edit:** Only "offline" workflow definitions can be edited. Workflow DAG editing is the same as [Create Workflow Definition](#creatDag).
+- **Online:** When the workflow status is "Offline", the workflow is online. Only the workflow in the "Online" state can run, but cannot be edited.
+- **Offline:** When the workflow status is "Online", the workflow is offline. Only the workflow in the "Offline" state can be edited, but not run.
+- **Run:** Only workflow in the online state can run. See [2.3.3 Run Workflow](#runWorkflow) for the operation steps
+- **Timing:** Timing can only be set in online workflows, and the system automatically schedules the workflow to run on a regular basis. The status after creating a timing is "offline", and the timing must be online on the timing management page to take effect. See [2.3.4 Workflow Timing](#creatTiming) for timing operation steps.
+- **Timing Management:** The timing management page can be edited, online/offline, and deleted.
+- **Delete:** Delete the workflow definition.
+- **Download:** Download workflow definition to local.
+- **Tree Diagram:** Display the task node type and task status in a tree structure, as shown in the figure below:
+  <p align="center">
+      <img src="/img/tree_en.png" width="80%" />
+  </p>
+
+#### <span id=runWorkflow>2.3.3 Run the workflow</span>
+
+- Click Project Management -> Workflow -> Workflow Definition to enter the workflow definition page, as shown in the figure below, click the "Go Online" button <img src="/img/online.png" width="35"/>,Go online workflow.

Review comment:
       Go online workflow -> to online workflow


----------------------------------------------------------------
This is an automated message from the Apache Git Service.
To respond to the message, please log on to GitHub and use the
URL above to go to the specific comment.

For queries about this service, please contact Infrastructure at:
users@infra.apache.org
[GitHub] [incubator-dolphinscheduler-website] AhahaGe commented on a change in pull request #190: [Feature][Docs] Add English version of "system-manual" to the documentation
Posted by GitBox <gi...@apache.org>.
AhahaGe commented on a change in pull request #190:
URL: https://github.com/apache/incubator-dolphinscheduler-website/pull/190#discussion_r503249021


##########
File path: docs/en-us/1.3.2/user_doc/system-manual.md
##########
@@ -0,0 +1,883 @@
+# System User Manual
+
+## Get started quickly
+
+> Please refer to [Quick Start](quick-start.html)
+
+## Operation guide
+
+### 1. Home
+
+The home page contains task status statistics, process status statistics, and workflow definition statistics for all projects of the user.
+
+<p align="center">
+<img src="/img/home_en.png" width="80%" />
+</p>
+
+### 2. Project management
+
+#### 2.1 Create project
+
+- Click "Project Management" to enter the project management page, click the "Create Project" button, enter the project name, project description, and click "Submit" to create a new project.
+
+  <p align="center">
+      <img src="/img/create_project_en1.png" width="80%" />
+  </p>
+
+#### 2.2 Project home
+
+- Click the project name link on the project management page to enter the project home page, as shown in the figure below, the project home page contains the task status statistics, process status statistics, and workflow definition statistics of the project.
+  <p align="center">
+     <img src="/img/project_home_en.png" width="80%" />
+  </p>
+
+- Task status statistics: within the specified time range, count the number of tasks in the task instance as successful submission, running, ready to pause, pause, ready to stop, stop, failure, success, fault tolerance, kill, and waiting threads
+- Process status statistics: within the specified time range, count the number of the status of the workflow instance as submission success, running, ready to pause, pause, ready to stop, stop, failure, success, fault tolerance, kill, and waiting threads
+- Workflow definition statistics: Count the workflow definitions created by users and the workflow definitions granted to this user by the administrator
+
+#### 2.3 Workflow definition
+
+#### <span id=creatDag>2.3.1 Create a workflow definition</span>
+
+- Click Project Management -> Workflow -> Workflow Definition to enter the workflow definition page, and click the "Create Workflow" button to enter the **workflow DAG edit** page, as shown in the following figure:
+  <p align="center">
+      <img src="/img/dag5.png" width="80%" />
+  </p>
+- Drag in the toolbar <img src="/img/shell.png" width="35"/> Add a Shell task to the drawing board, as shown in the figure below:
+  <p align="center">
+      <img src="/img/shell-en.png" width="80%" />
+  </p>
+- **Add parameter settings for shell tasks:**
+
+1. Fill in the "Node Name", "Description", and "Script" fields;
+2. Check “Normal” for “Run Flag”. If “Prohibit Execution” is checked, the task will not be executed when running the workflow;
+3. Select "Task Priority": When the number of worker threads is insufficient, high-level tasks will be executed first in the execution queue, and tasks with the same priority will be executed in the order of first in, first out;
+4. Timeout alarm (not required): Check the timeout alarm, timeout failure, and fill in the "timeout period". When the task execution time exceeds **timeout period**, an alert email will be sent and the task timeout fails;
+5. Resources (optional). Resource files are files created or uploaded on the Resource Center -> File Management page. For example, the file name is `test.sh`, and the command to call the resource in the script is `sh test.sh`;
+6. Custom parameters (not required), refer to [Custom Parameters](#UserDefinedParameters);
+7. Click the "Confirm Add" button to save the task settings.
+
+- **Increase the order of task execution:** Click the icon in the upper right corner <img src="/img/line.png" width="35"/> to connect the task; as shown in the figure below, task 2 and task 3 are executed in parallel, When task 1 is executed, tasks 2 and 3 will be executed simultaneously.
+
+  <p align="center">
+     <img src="/img/dag6.png" width="80%" />
+  </p>
+
+- **Delete dependencies:** Click the "arrow" icon in the upper right corner <img src="/img/arrow.png" width="35"/>, select the connection line, and click the "Delete" icon in the upper right corner <img src= "/img/delete.png" width="35"/>, delete dependencies between tasks.
+  <p align="center">
+     <img src="/img/dag7.png" width="80%" />
+  </p>
+
+- **Save workflow definition:** Click the "Save" button, and the "Set DAG chart name" pop-up box will pop up, as shown in the figure below. Enter the workflow definition name, workflow definition description, and set global parameters (optional, refer to [ Custom parameters](#UserDefinedParameters)), click the "Add" button, and the workflow definition is created successfully.
+  <p align="center">
+     <img src="/img/dag8.png" width="80%" />
+   </p>
+> For other types of tasks, please refer to [Task Node Type and Parameter Settings](#TaskParamers).
+
+#### 2.3.2 Workflow definition operation function
+
+Click Project Management -> Workflow -> Workflow Definition to enter the workflow definition page, as shown below:
+
+<p align="center">
+<img src="/img/work_list_en.png" width="80%" />
+</p>
+The operation functions of the workflow definition list are as follows:
+
+- **Edit:** Only "offline" workflow definitions can be edited. Workflow DAG editing is the same as [Create Workflow Definition](#creatDag).
+- **Online:** When the workflow status is "Offline", the workflow is online. Only the workflow in the "Online" state can run, but cannot be edited.
+- **Offline:** When the workflow status is "Online", the workflow is offline. Only the workflow in the "Offline" state can be edited, but not run.
+- **Run:** Only workflow in the online state can run. See [2.3.3 Run Workflow](#runWorkflow) for the operation steps
+- **Timing:** Timing can only be set in online workflows, and the system automatically schedules the workflow to run on a regular basis. The status after creating a timing is "offline", and the timing must be online on the timing management page to take effect. See [2.3.4 Workflow Timing](#creatTiming) for timing operation steps.
+- **Timing Management:** The timing management page can be edited, online/offline, and deleted.
+- **Delete:** Delete the workflow definition.
+- **Download:** Download workflow definition to local.
+- **Tree Diagram:** Display the task node type and task status in a tree structure, as shown in the figure below:
+  <p align="center">
+      <img src="/img/tree_en.png" width="80%" />
+  </p>
+
+#### <span id=runWorkflow>2.3.3 Run the workflow</span>
+
+- Click Project Management -> Workflow -> Workflow Definition to enter the workflow definition page, as shown in the figure below, click the "Go Online" button <img src="/img/online.png" width="35"/>,Go online workflow.
+  <p align="center">
+      <img src="/img/work_list_en.png" width="80%" />
+  </p>
+
+- Click the "Run" button to pop up the startup parameter setting pop-up box, as shown in the figure below, set the startup parameters, click the "Run" button in the pop-up box, the workflow starts running, and the workflow instance page generates a workflow instance.
+     <p align="center">
+       <img src="/img/run_work_en.png" width="80%" />
+     </p>
+  <span id=runParamers>Description of workflow operating parameters:</span>
+
+      * Failure strategy: When a task node fails to execute, other parallel task nodes need to execute the strategy. "Continue" means: after a certain task fails, other task nodes execute normally; "End" means: terminate all tasks being executed, and terminate the entire process.
+      * Notification strategy: When the process is over, the process execution information notification email is sent according to the process status, including any status is not sent, successful, failed, successful or failed.
+      * Process priority: The priority of process operation, divided into five levels: highest (HIGHEST), high (HIGH), medium (MEDIUM), low (LOW), and lowest (LOWEST). When the number of master threads is insufficient, high-level processes will be executed first in the execution queue, and processes with the same priority will be executed in a first-in first-out order.
+      * Worker group: The process can only be executed in the specified worker machine group. The default is Default, which can be executed on any worker.
+      * Notification group: select notification strategy||timeout alarm||when fault tolerance occurs, process information or email will be sent to all members in the notification group.
+      * Recipient: Select notification policy||Timeout alarm||When fault tolerance occurs, process information or alarm email will be sent to the recipient list.
+      * Cc: Select the notification strategy||Timeout alarm||When fault tolerance occurs, the process information or warning email will be copied to the CC list.
+      * Complement: Two modes including serial complement and parallel complement. Serial complement: within the specified time range, the complement is executed sequentially from the start date to the end date, and only one process instance is generated; parallel complement: within the specified time range, multiple days are complemented at the same time to generate N process instances.
+    * Complement: Execute the workflow definition of the specified date, you can select the time range of the complement (currently only supports the complement for consecutive days), for example, you need to supplement the data from September 19 to October 16, as shown in the following figure:
+    <p align="center">
+        <img src="/img/complement_en.png" width="80%" />
+    </p>
+
+  > Serial mode: The complement is executed sequentially from September 19 to October 16, and a process instance is generated on the process instance page;
+
+  > Parallel mode: The tasks from September 19 to October 16 are executed simultaneously, and 28 process instances are generated on the process instance page.
+
+#### <span id=creatTiming>2.3.4 Workflow timing</span>
+
+- Create timing: Click Project Management->Workflow->Workflow Definition, enter the workflow definition page, go online the workflow, click the "timing" button <img src="/img/timing.png" width="35"/> ,The timing parameter setting dialog box pops up, as shown in the figure below:
+  <p align="center">
+      <img src="/img/time_schedule_en.png" width="80%" />
+  </p>
+- Choose the start and end time. In the start and end time range, the workflow is run at regular intervals; not in the start and end time range, no more regular workflow instances are generated.
+- Add a timing that is executed once every day at 5 AM, as shown in the following figure:
+  <p align="center">
+      <img src="/img/timer-en.png" width="80%" />
+  </p>
+- Failure strategy, notification strategy, process priority, worker grouping, notification group, recipient, and CC are the same as [workflow running parameters](#runParamers).
+- Click the "Create" button to create the timing successfully. At this time, the timing status is "**Offline**" and the timing needs to be **Online** to take effect.
+- Timed online: Click the "timing management" button <img src="/img/timeManagement.png" width="35"/>, enter the timing management page, click the "online" button, the timing status will change to "online", as follows As shown in the figure, the workflow takes effect regularly.

Review comment:
       ```suggestion
   - Timing online: Click the "timing management" button <img src="/img/timeManagement.png" width="35"/>, enter the timing management page, click the "online" button, the timing status will change to "online", as shown in the below figure, the workflow takes effect regularly.
   ```


----------------------------------------------------------------
This is an automated message from the Apache Git Service.
To respond to the message, please log on to GitHub and use the
URL above to go to the specific comment.

For queries about this service, please contact Infrastructure at:
users@infra.apache.org
[GitHub] [incubator-dolphinscheduler-website] AhahaGe commented on pull request #190: [Feature][Docs] Add English version of "system-manual" to the documentation
Posted by GitBox <gi...@apache.org>.
AhahaGe commented on pull request #190:
URL: https://github.com/apache/incubator-dolphinscheduler-website/pull/190#issuecomment-707086054


   I just reviewed to 2.3.5, any one review and continue from 2.3.5.


----------------------------------------------------------------
This is an automated message from the Apache Git Service.
To respond to the message, please log on to GitHub and use the
URL above to go to the specific comment.

For queries about this service, please contact Infrastructure at:
users@infra.apache.org
[GitHub] [incubator-dolphinscheduler-website] AhahaGe commented on a change in pull request #190: [Feature][Docs] Add English version of "system-manual" to the documentation
Posted by GitBox <gi...@apache.org>.
AhahaGe commented on a change in pull request #190:
URL: https://github.com/apache/incubator-dolphinscheduler-website/pull/190#discussion_r503247641


##########
File path: docs/en-us/1.3.2/user_doc/system-manual.md
##########
@@ -0,0 +1,883 @@
+# System User Manual
+
+## Get started quickly
+
+> Please refer to [Quick Start](quick-start.html)
+
+## Operation guide
+
+### 1. Home
+
+The home page contains task status statistics, process status statistics, and workflow definition statistics for all projects of the user.
+
+<p align="center">
+<img src="/img/home_en.png" width="80%" />
+</p>
+
+### 2. Project management
+
+#### 2.1 Create project
+
+- Click "Project Management" to enter the project management page, click the "Create Project" button, enter the project name, project description, and click "Submit" to create a new project.
+
+  <p align="center">
+      <img src="/img/create_project_en1.png" width="80%" />
+  </p>
+
+#### 2.2 Project home
+
+- Click the project name link on the project management page to enter the project home page, as shown in the figure below, the project home page contains the task status statistics, process status statistics, and workflow definition statistics of the project.
+  <p align="center">
+     <img src="/img/project_home_en.png" width="80%" />
+  </p>
+
+- Task status statistics: within the specified time range, count the number of tasks in the task instance as successful submission, running, ready to pause, pause, ready to stop, stop, failure, success, fault tolerance, kill, and waiting threads
+- Process status statistics: within the specified time range, count the number of the status of the workflow instance as submission success, running, ready to pause, pause, ready to stop, stop, failure, success, fault tolerance, kill, and waiting threads
+- Workflow definition statistics: Count the workflow definitions created by users and the workflow definitions granted to this user by the administrator
+
+#### 2.3 Workflow definition
+
+#### <span id=creatDag>2.3.1 Create a workflow definition</span>
+
+- Click Project Management -> Workflow -> Workflow Definition to enter the workflow definition page, and click the "Create Workflow" button to enter the **workflow DAG edit** page, as shown in the following figure:
+  <p align="center">
+      <img src="/img/dag5.png" width="80%" />
+  </p>
+- Drag in the toolbar <img src="/img/shell.png" width="35"/> Add a Shell task to the drawing board, as shown in the figure below:
+  <p align="center">
+      <img src="/img/shell-en.png" width="80%" />
+  </p>
+- **Add parameter settings for shell tasks:**
+
+1. Fill in the "Node Name", "Description", and "Script" fields;
+2. Check “Normal” for “Run Flag”. If “Prohibit Execution” is checked, the task will not be executed when running the workflow;
+3. Select "Task Priority": When the number of worker threads is insufficient, high-level tasks will be executed first in the execution queue, and tasks with the same priority will be executed in the order of first in, first out;
+4. Timeout alarm (not required): Check the timeout alarm, timeout failure, and fill in the "timeout period". When the task execution time exceeds **timeout period**, an alert email will be sent and the task timeout fails;
+5. Resources (optional). Resource files are files created or uploaded on the Resource Center -> File Management page. For example, the file name is `test.sh`, and the command to call the resource in the script is `sh test.sh`;
+6. Custom parameters (not required), refer to [Custom Parameters](#UserDefinedParameters);
+7. Click the "Confirm Add" button to save the task settings.
+
+- **Increase the order of task execution:** Click the icon in the upper right corner <img src="/img/line.png" width="35"/> to connect the task; as shown in the figure below, task 2 and task 3 are executed in parallel, When task 1 is executed, tasks 2 and 3 will be executed simultaneously.
+
+  <p align="center">
+     <img src="/img/dag6.png" width="80%" />
+  </p>
+
+- **Delete dependencies:** Click the "arrow" icon in the upper right corner <img src="/img/arrow.png" width="35"/>, select the connection line, and click the "Delete" icon in the upper right corner <img src= "/img/delete.png" width="35"/>, delete dependencies between tasks.
+  <p align="center">
+     <img src="/img/dag7.png" width="80%" />
+  </p>
+
+- **Save workflow definition:** Click the "Save" button, and the "Set DAG chart name" pop-up box will pop up, as shown in the figure below. Enter the workflow definition name, workflow definition description, and set global parameters (optional, refer to [ Custom parameters](#UserDefinedParameters)), click the "Add" button, and the workflow definition is created successfully.
+  <p align="center">
+     <img src="/img/dag8.png" width="80%" />
+   </p>
+> For other types of tasks, please refer to [Task Node Type and Parameter Settings](#TaskParamers).
+
+#### 2.3.2 Workflow definition operation function
+
+Click Project Management -> Workflow -> Workflow Definition to enter the workflow definition page, as shown below:
+
+<p align="center">
+<img src="/img/work_list_en.png" width="80%" />
+</p>
+The operation functions of the workflow definition list are as follows:
+
+- **Edit:** Only "offline" workflow definitions can be edited. Workflow DAG editing is the same as [Create Workflow Definition](#creatDag).
+- **Online:** When the workflow status is "Offline", the workflow is online. Only the workflow in the "Online" state can run, but cannot be edited.
+- **Offline:** When the workflow status is "Online", the workflow is offline. Only the workflow in the "Offline" state can be edited, but not run.
+- **Run:** Only workflow in the online state can run. See [2.3.3 Run Workflow](#runWorkflow) for the operation steps
+- **Timing:** Timing can only be set in online workflows, and the system automatically schedules the workflow to run on a regular basis. The status after creating a timing is "offline", and the timing must be online on the timing management page to take effect. See [2.3.4 Workflow Timing](#creatTiming) for timing operation steps.
+- **Timing Management:** The timing management page can be edited, online/offline, and deleted.
+- **Delete:** Delete the workflow definition.
+- **Download:** Download workflow definition to local.
+- **Tree Diagram:** Display the task node type and task status in a tree structure, as shown in the figure below:
+  <p align="center">
+      <img src="/img/tree_en.png" width="80%" />
+  </p>
+
+#### <span id=runWorkflow>2.3.3 Run the workflow</span>
+
+- Click Project Management -> Workflow -> Workflow Definition to enter the workflow definition page, as shown in the figure below, click the "Go Online" button <img src="/img/online.png" width="35"/>,Go online workflow.
+  <p align="center">
+      <img src="/img/work_list_en.png" width="80%" />
+  </p>
+
+- Click the "Run" button to pop up the startup parameter setting pop-up box, as shown in the figure below, set the startup parameters, click the "Run" button in the pop-up box, the workflow starts running, and the workflow instance page generates a workflow instance.
+     <p align="center">
+       <img src="/img/run_work_en.png" width="80%" />
+     </p>
+  <span id=runParamers>Description of workflow operating parameters:</span>
+
+      * Failure strategy: When a task node fails to execute, other parallel task nodes need to execute the strategy. "Continue" means: after a certain task fails, other task nodes execute normally; "End" means: terminate all tasks being executed, and terminate the entire process.
+      * Notification strategy: When the process is over, the process execution information notification email is sent according to the process status, including any status is not sent, successful, failed, successful or failed.
+      * Process priority: The priority of process operation, divided into five levels: highest (HIGHEST), high (HIGH), medium (MEDIUM), low (LOW), and lowest (LOWEST). When the number of master threads is insufficient, high-level processes will be executed first in the execution queue, and processes with the same priority will be executed in a first-in first-out order.
+      * Worker group: The process can only be executed in the specified worker machine group. The default is Default, which can be executed on any worker.
+      * Notification group: select notification strategy||timeout alarm||when fault tolerance occurs, process information or email will be sent to all members in the notification group.
+      * Recipient: Select notification policy||Timeout alarm||When fault tolerance occurs, process information or alarm email will be sent to the recipient list.
+      * Cc: Select the notification strategy||Timeout alarm||When fault tolerance occurs, the process information or warning email will be copied to the CC list.
+      * Complement: Two modes including serial complement and parallel complement. Serial complement: within the specified time range, the complement is executed sequentially from the start date to the end date, and only one process instance is generated; parallel complement: within the specified time range, multiple days are complemented at the same time to generate N process instances.
+    * Complement: Execute the workflow definition of the specified date, you can select the time range of the complement (currently only supports the complement for consecutive days), for example, you need to supplement the data from September 19 to October 16, as shown in the following figure:
+    <p align="center">
+        <img src="/img/complement_en.png" width="80%" />
+    </p>
+
+  > Serial mode: The complement is executed sequentially from September 19 to October 16, and a process instance is generated on the process instance page;
+
+  > Parallel mode: The tasks from September 19 to October 16 are executed simultaneously, and 28 process instances are generated on the process instance page.
+
+#### <span id=creatTiming>2.3.4 Workflow timing</span>
+
+- Create timing: Click Project Management->Workflow->Workflow Definition, enter the workflow definition page, go online the workflow, click the "timing" button <img src="/img/timing.png" width="35"/> ,The timing parameter setting dialog box pops up, as shown in the figure below:
+  <p align="center">
+      <img src="/img/time_schedule_en.png" width="80%" />
+  </p>
+- Choose the start and end time. In the start and end time range, the workflow is run at regular intervals; not in the start and end time range, no more regular workflow instances are generated.
+- Add a timing that is executed once every day at 5 AM, as shown in the following figure:
+  <p align="center">
+      <img src="/img/timer-en.png" width="80%" />
+  </p>
+- Failure strategy, notification strategy, process priority, worker grouping, notification group, recipient, and CC are the same as [workflow running parameters](#runParamers).

Review comment:
       ```suggestion
   - Failure strategy, notification strategy, process priority, worker group, notification group, recipient, and CC are the same as [workflow running parameters](#runParamers).
   ```


----------------------------------------------------------------
This is an automated message from the Apache Git Service.
To respond to the message, please log on to GitHub and use the
URL above to go to the specific comment.

For queries about this service, please contact Infrastructure at:
users@infra.apache.org
[GitHub] [incubator-dolphinscheduler-website] AhahaGe commented on a change in pull request #190: [Feature][Docs] Add English version of "system-manual" to the documentation
Posted by GitBox <gi...@apache.org>.
AhahaGe commented on a change in pull request #190:
URL: https://github.com/apache/incubator-dolphinscheduler-website/pull/190#discussion_r503232849


##########
File path: docs/en-us/1.3.2/user_doc/system-manual.md
##########
@@ -0,0 +1,883 @@
+# System User Manual
+
+## Get started quickly
+
+> Please refer to [Quick Start](quick-start.html)
+
+## Operation guide
+
+### 1. Home
+
+The home page contains task status statistics, process status statistics, and workflow definition statistics for all projects of the user.
+
+<p align="center">
+<img src="/img/home_en.png" width="80%" />
+</p>
+
+### 2. Project management
+
+#### 2.1 Create project
+
+- Click "Project Management" to enter the project management page, click the "Create Project" button, enter the project name, project description, and click "Submit" to create a new project.
+
+  <p align="center">
+      <img src="/img/create_project_en1.png" width="80%" />
+  </p>
+
+#### 2.2 Project home
+
+- Click the project name link on the project management page to enter the project home page, as shown in the figure below, the project home page contains the task status statistics, process status statistics, and workflow definition statistics of the project.
+  <p align="center">
+     <img src="/img/project_home_en.png" width="80%" />
+  </p>
+
+- Task status statistics: within the specified time range, count the number of tasks in the task instance as successful submission, running, ready to pause, pause, ready to stop, stop, failure, success, fault tolerance, kill, and waiting threads
+- Process status statistics: within the specified time range, count the number of the status of the workflow instance as submission success, running, ready to pause, pause, ready to stop, stop, failure, success, fault tolerance, kill, and waiting threads
+- Workflow definition statistics: Count the workflow definitions created by users and the workflow definitions granted to this user by the administrator
+
+#### 2.3 Workflow definition
+
+#### <span id=creatDag>2.3.1 Create a workflow definition</span>
+
+- Click Project Management -> Workflow -> Workflow Definition to enter the workflow definition page, and click the "Create Workflow" button to enter the **workflow DAG edit** page, as shown in the following figure:
+  <p align="center">
+      <img src="/img/dag5.png" width="80%" />
+  </p>
+- Drag in the toolbar <img src="/img/shell.png" width="35"/> Add a Shell task to the drawing board, as shown in the figure below:
+  <p align="center">
+      <img src="/img/shell-en.png" width="80%" />
+  </p>
+- **Add parameter settings for shell tasks:**
+
+1. Fill in the "Node Name", "Description", and "Script" fields;
+2. Check “Normal” for “Run Flag”. If “Prohibit Execution” is checked, the task will not be executed when running the workflow;
+3. Select "Task Priority": When the number of worker threads is insufficient, high-level tasks will be executed first in the execution queue, and tasks with the same priority will be executed in the order of first in, first out;
+4. Timeout alarm (not required): Check the timeout alarm, timeout failure, and fill in the "timeout period". When the task execution time exceeds **timeout period**, an alert email will be sent and the task timeout fails;
+5. Resources (optional). Resource files are files created or uploaded on the Resource Center -> File Management page. For example, the file name is `test.sh`, and the command to call the resource in the script is `sh test.sh`;
+6. Custom parameters (not required), refer to [Custom Parameters](#UserDefinedParameters);

Review comment:
       not required to optional


----------------------------------------------------------------
This is an automated message from the Apache Git Service.
To respond to the message, please log on to GitHub and use the
URL above to go to the specific comment.

For queries about this service, please contact Infrastructure at:
users@infra.apache.org
[GitHub] [incubator-dolphinscheduler-website] AhahaGe commented on a change in pull request #190: [Feature][Docs] Add English version of "system-manual" to the documentation
Posted by GitBox <gi...@apache.org>.
AhahaGe commented on a change in pull request #190:
URL: https://github.com/apache/incubator-dolphinscheduler-website/pull/190#discussion_r503234024


##########
File path: docs/en-us/1.3.2/user_doc/system-manual.md
##########
@@ -0,0 +1,883 @@
+# System User Manual
+
+## Get started quickly
+
+> Please refer to [Quick Start](quick-start.html)
+
+## Operation guide
+
+### 1. Home
+
+The home page contains task status statistics, process status statistics, and workflow definition statistics for all projects of the user.
+
+<p align="center">
+<img src="/img/home_en.png" width="80%" />
+</p>
+
+### 2. Project management
+
+#### 2.1 Create project
+
+- Click "Project Management" to enter the project management page, click the "Create Project" button, enter the project name, project description, and click "Submit" to create a new project.
+
+  <p align="center">
+      <img src="/img/create_project_en1.png" width="80%" />
+  </p>
+
+#### 2.2 Project home
+
+- Click the project name link on the project management page to enter the project home page, as shown in the figure below, the project home page contains the task status statistics, process status statistics, and workflow definition statistics of the project.
+  <p align="center">
+     <img src="/img/project_home_en.png" width="80%" />
+  </p>
+
+- Task status statistics: within the specified time range, count the number of tasks in the task instance as successful submission, running, ready to pause, pause, ready to stop, stop, failure, success, fault tolerance, kill, and waiting threads
+- Process status statistics: within the specified time range, count the number of the status of the workflow instance as submission success, running, ready to pause, pause, ready to stop, stop, failure, success, fault tolerance, kill, and waiting threads
+- Workflow definition statistics: Count the workflow definitions created by users and the workflow definitions granted to this user by the administrator
+
+#### 2.3 Workflow definition
+
+#### <span id=creatDag>2.3.1 Create a workflow definition</span>
+
+- Click Project Management -> Workflow -> Workflow Definition to enter the workflow definition page, and click the "Create Workflow" button to enter the **workflow DAG edit** page, as shown in the following figure:
+  <p align="center">
+      <img src="/img/dag5.png" width="80%" />
+  </p>
+- Drag in the toolbar <img src="/img/shell.png" width="35"/> Add a Shell task to the drawing board, as shown in the figure below:
+  <p align="center">
+      <img src="/img/shell-en.png" width="80%" />
+  </p>
+- **Add parameter settings for shell tasks:**
+
+1. Fill in the "Node Name", "Description", and "Script" fields;
+2. Check “Normal” for “Run Flag”. If “Prohibit Execution” is checked, the task will not be executed when running the workflow;
+3. Select "Task Priority": When the number of worker threads is insufficient, high-level tasks will be executed first in the execution queue, and tasks with the same priority will be executed in the order of first in, first out;
+4. Timeout alarm (not required): Check the timeout alarm, timeout failure, and fill in the "timeout period". When the task execution time exceeds **timeout period**, an alert email will be sent and the task timeout fails;
+5. Resources (optional). Resource files are files created or uploaded on the Resource Center -> File Management page. For example, the file name is `test.sh`, and the command to call the resource in the script is `sh test.sh`;
+6. Custom parameters (not required), refer to [Custom Parameters](#UserDefinedParameters);
+7. Click the "Confirm Add" button to save the task settings.
+
+- **Increase the order of task execution:** Click the icon in the upper right corner <img src="/img/line.png" width="35"/> to connect the task; as shown in the figure below, task 2 and task 3 are executed in parallel, When task 1 is executed, tasks 2 and 3 will be executed simultaneously.

Review comment:
       ```suggestion
   - **Increase the order of task execution:** Click the icon in the upper right corner <img src="/img/line.png" width="35"/> to connect the task; as shown in the figure below, task 2 and task 3 are executed in parallel, When task 1 finished execute, tasks 2 and 3 will be executed simultaneously.
   ```


----------------------------------------------------------------
This is an automated message from the Apache Git Service.
To respond to the message, please log on to GitHub and use the
URL above to go to the specific comment.

For queries about this service, please contact Infrastructure at:
users@infra.apache.org
[GitHub] [incubator-dolphinscheduler-website] AhahaGe commented on a change in pull request #190: [Feature][Docs] Add English version of "system-manual" to the documentation
Posted by GitBox <gi...@apache.org>.
AhahaGe commented on a change in pull request #190:
URL: https://github.com/apache/incubator-dolphinscheduler-website/pull/190#discussion_r503234024


##########
File path: docs/en-us/1.3.2/user_doc/system-manual.md
##########
@@ -0,0 +1,883 @@
+# System User Manual
+
+## Get started quickly
+
+> Please refer to [Quick Start](quick-start.html)
+
+## Operation guide
+
+### 1. Home
+
+The home page contains task status statistics, process status statistics, and workflow definition statistics for all projects of the user.
+
+<p align="center">
+<img src="/img/home_en.png" width="80%" />
+</p>
+
+### 2. Project management
+
+#### 2.1 Create project
+
+- Click "Project Management" to enter the project management page, click the "Create Project" button, enter the project name, project description, and click "Submit" to create a new project.
+
+  <p align="center">
+      <img src="/img/create_project_en1.png" width="80%" />
+  </p>
+
+#### 2.2 Project home
+
+- Click the project name link on the project management page to enter the project home page, as shown in the figure below, the project home page contains the task status statistics, process status statistics, and workflow definition statistics of the project.
+  <p align="center">
+     <img src="/img/project_home_en.png" width="80%" />
+  </p>
+
+- Task status statistics: within the specified time range, count the number of tasks in the task instance as successful submission, running, ready to pause, pause, ready to stop, stop, failure, success, fault tolerance, kill, and waiting threads
+- Process status statistics: within the specified time range, count the number of the status of the workflow instance as submission success, running, ready to pause, pause, ready to stop, stop, failure, success, fault tolerance, kill, and waiting threads
+- Workflow definition statistics: Count the workflow definitions created by users and the workflow definitions granted to this user by the administrator
+
+#### 2.3 Workflow definition
+
+#### <span id=creatDag>2.3.1 Create a workflow definition</span>
+
+- Click Project Management -> Workflow -> Workflow Definition to enter the workflow definition page, and click the "Create Workflow" button to enter the **workflow DAG edit** page, as shown in the following figure:
+  <p align="center">
+      <img src="/img/dag5.png" width="80%" />
+  </p>
+- Drag in the toolbar <img src="/img/shell.png" width="35"/> Add a Shell task to the drawing board, as shown in the figure below:
+  <p align="center">
+      <img src="/img/shell-en.png" width="80%" />
+  </p>
+- **Add parameter settings for shell tasks:**
+
+1. Fill in the "Node Name", "Description", and "Script" fields;
+2. Check “Normal” for “Run Flag”. If “Prohibit Execution” is checked, the task will not be executed when running the workflow;
+3. Select "Task Priority": When the number of worker threads is insufficient, high-level tasks will be executed first in the execution queue, and tasks with the same priority will be executed in the order of first in, first out;
+4. Timeout alarm (not required): Check the timeout alarm, timeout failure, and fill in the "timeout period". When the task execution time exceeds **timeout period**, an alert email will be sent and the task timeout fails;
+5. Resources (optional). Resource files are files created or uploaded on the Resource Center -> File Management page. For example, the file name is `test.sh`, and the command to call the resource in the script is `sh test.sh`;
+6. Custom parameters (not required), refer to [Custom Parameters](#UserDefinedParameters);
+7. Click the "Confirm Add" button to save the task settings.
+
+- **Increase the order of task execution:** Click the icon in the upper right corner <img src="/img/line.png" width="35"/> to connect the task; as shown in the figure below, task 2 and task 3 are executed in parallel, When task 1 is executed, tasks 2 and 3 will be executed simultaneously.

Review comment:
       When task 1 finish execute


----------------------------------------------------------------
This is an automated message from the Apache Git Service.
To respond to the message, please log on to GitHub and use the
URL above to go to the specific comment.

For queries about this service, please contact Infrastructure at:
users@infra.apache.org
[GitHub] [incubator-dolphinscheduler-website] dailidong commented on pull request #190: [Feature][Docs] Add English version of "system-manual" to the documentation
Posted by GitBox <gi...@apache.org>.
dailidong commented on pull request #190:
URL: https://github.com/apache/incubator-dolphinscheduler-website/pull/190#issuecomment-708432392


   Thanks for your first contribution, looking forward for your deep participation, if you meet any problem, please send mail to dev@dolphinscheduler.apache.org,  many guys are very enthusiastic and willing to help


----------------------------------------------------------------
This is an automated message from the Apache Git Service.
To respond to the message, please log on to GitHub and use the
URL above to go to the specific comment.

For queries about this service, please contact Infrastructure at:
users@infra.apache.org
[GitHub] [incubator-dolphinscheduler-website] CalvinKirs commented on pull request #190: [Feature][Docs] Add English version of "system-manual" to the documentation
Posted by GitBox <gi...@apache.org>.
CalvinKirs commented on pull request #190:
URL: https://github.com/apache/incubator-dolphinscheduler-website/pull/190#issuecomment-710035014


   Hi, @Segun-Ogundipe ,I noticed that you did not add a link to this document, which will cause it to not be displayed correctly on our official website. You need to modify docs.json and other files. Can you submit another PR to complete this work?


----------------------------------------------------------------
This is an automated message from the Apache Git Service.
To respond to the message, please log on to GitHub and use the
URL above to go to the specific comment.

For queries about this service, please contact Infrastructure at:
users@infra.apache.org
[GitHub] [incubator-dolphinscheduler-website] AhahaGe commented on a change in pull request #190: [Feature][Docs] Add English version of "system-manual" to the documentation
Posted by GitBox <gi...@apache.org>.
AhahaGe commented on a change in pull request #190:
URL: https://github.com/apache/incubator-dolphinscheduler-website/pull/190#discussion_r503246248


##########
File path: docs/en-us/1.3.2/user_doc/system-manual.md
##########
@@ -0,0 +1,883 @@
+# System User Manual
+
+## Get started quickly
+
+> Please refer to [Quick Start](quick-start.html)
+
+## Operation guide
+
+### 1. Home
+
+The home page contains task status statistics, process status statistics, and workflow definition statistics for all projects of the user.
+
+<p align="center">
+<img src="/img/home_en.png" width="80%" />
+</p>
+
+### 2. Project management
+
+#### 2.1 Create project
+
+- Click "Project Management" to enter the project management page, click the "Create Project" button, enter the project name, project description, and click "Submit" to create a new project.
+
+  <p align="center">
+      <img src="/img/create_project_en1.png" width="80%" />
+  </p>
+
+#### 2.2 Project home
+
+- Click the project name link on the project management page to enter the project home page, as shown in the figure below, the project home page contains the task status statistics, process status statistics, and workflow definition statistics of the project.
+  <p align="center">
+     <img src="/img/project_home_en.png" width="80%" />
+  </p>
+
+- Task status statistics: within the specified time range, count the number of tasks in the task instance as successful submission, running, ready to pause, pause, ready to stop, stop, failure, success, fault tolerance, kill, and waiting threads
+- Process status statistics: within the specified time range, count the number of the status of the workflow instance as submission success, running, ready to pause, pause, ready to stop, stop, failure, success, fault tolerance, kill, and waiting threads
+- Workflow definition statistics: Count the workflow definitions created by users and the workflow definitions granted to this user by the administrator
+
+#### 2.3 Workflow definition
+
+#### <span id=creatDag>2.3.1 Create a workflow definition</span>
+
+- Click Project Management -> Workflow -> Workflow Definition to enter the workflow definition page, and click the "Create Workflow" button to enter the **workflow DAG edit** page, as shown in the following figure:
+  <p align="center">
+      <img src="/img/dag5.png" width="80%" />
+  </p>
+- Drag in the toolbar <img src="/img/shell.png" width="35"/> Add a Shell task to the drawing board, as shown in the figure below:
+  <p align="center">
+      <img src="/img/shell-en.png" width="80%" />
+  </p>
+- **Add parameter settings for shell tasks:**
+
+1. Fill in the "Node Name", "Description", and "Script" fields;
+2. Check “Normal” for “Run Flag”. If “Prohibit Execution” is checked, the task will not be executed when running the workflow;
+3. Select "Task Priority": When the number of worker threads is insufficient, high-level tasks will be executed first in the execution queue, and tasks with the same priority will be executed in the order of first in, first out;
+4. Timeout alarm (not required): Check the timeout alarm, timeout failure, and fill in the "timeout period". When the task execution time exceeds **timeout period**, an alert email will be sent and the task timeout fails;
+5. Resources (optional). Resource files are files created or uploaded on the Resource Center -> File Management page. For example, the file name is `test.sh`, and the command to call the resource in the script is `sh test.sh`;
+6. Custom parameters (not required), refer to [Custom Parameters](#UserDefinedParameters);
+7. Click the "Confirm Add" button to save the task settings.
+
+- **Increase the order of task execution:** Click the icon in the upper right corner <img src="/img/line.png" width="35"/> to connect the task; as shown in the figure below, task 2 and task 3 are executed in parallel, When task 1 is executed, tasks 2 and 3 will be executed simultaneously.
+
+  <p align="center">
+     <img src="/img/dag6.png" width="80%" />
+  </p>
+
+- **Delete dependencies:** Click the "arrow" icon in the upper right corner <img src="/img/arrow.png" width="35"/>, select the connection line, and click the "Delete" icon in the upper right corner <img src= "/img/delete.png" width="35"/>, delete dependencies between tasks.
+  <p align="center">
+     <img src="/img/dag7.png" width="80%" />
+  </p>
+
+- **Save workflow definition:** Click the "Save" button, and the "Set DAG chart name" pop-up box will pop up, as shown in the figure below. Enter the workflow definition name, workflow definition description, and set global parameters (optional, refer to [ Custom parameters](#UserDefinedParameters)), click the "Add" button, and the workflow definition is created successfully.
+  <p align="center">
+     <img src="/img/dag8.png" width="80%" />
+   </p>
+> For other types of tasks, please refer to [Task Node Type and Parameter Settings](#TaskParamers).
+
+#### 2.3.2 Workflow definition operation function
+
+Click Project Management -> Workflow -> Workflow Definition to enter the workflow definition page, as shown below:
+
+<p align="center">
+<img src="/img/work_list_en.png" width="80%" />
+</p>
+The operation functions of the workflow definition list are as follows:
+
+- **Edit:** Only "offline" workflow definitions can be edited. Workflow DAG editing is the same as [Create Workflow Definition](#creatDag).
+- **Online:** When the workflow status is "Offline", the workflow is online. Only the workflow in the "Online" state can run, but cannot be edited.
+- **Offline:** When the workflow status is "Online", the workflow is offline. Only the workflow in the "Offline" state can be edited, but not run.
+- **Run:** Only workflow in the online state can run. See [2.3.3 Run Workflow](#runWorkflow) for the operation steps
+- **Timing:** Timing can only be set in online workflows, and the system automatically schedules the workflow to run on a regular basis. The status after creating a timing is "offline", and the timing must be online on the timing management page to take effect. See [2.3.4 Workflow Timing](#creatTiming) for timing operation steps.
+- **Timing Management:** The timing management page can be edited, online/offline, and deleted.
+- **Delete:** Delete the workflow definition.
+- **Download:** Download workflow definition to local.
+- **Tree Diagram:** Display the task node type and task status in a tree structure, as shown in the figure below:
+  <p align="center">
+      <img src="/img/tree_en.png" width="80%" />
+  </p>
+
+#### <span id=runWorkflow>2.3.3 Run the workflow</span>
+
+- Click Project Management -> Workflow -> Workflow Definition to enter the workflow definition page, as shown in the figure below, click the "Go Online" button <img src="/img/online.png" width="35"/>,Go online workflow.
+  <p align="center">
+      <img src="/img/work_list_en.png" width="80%" />
+  </p>
+
+- Click the "Run" button to pop up the startup parameter setting pop-up box, as shown in the figure below, set the startup parameters, click the "Run" button in the pop-up box, the workflow starts running, and the workflow instance page generates a workflow instance.
+     <p align="center">
+       <img src="/img/run_work_en.png" width="80%" />
+     </p>
+  <span id=runParamers>Description of workflow operating parameters:</span>
+
+      * Failure strategy: When a task node fails to execute, other parallel task nodes need to execute the strategy. "Continue" means: after a certain task fails, other task nodes execute normally; "End" means: terminate all tasks being executed, and terminate the entire process.
+      * Notification strategy: When the process is over, the process execution information notification email is sent according to the process status, including any status is not sent, successful, failed, successful or failed.
+      * Process priority: The priority of process operation, divided into five levels: highest (HIGHEST), high (HIGH), medium (MEDIUM), low (LOW), and lowest (LOWEST). When the number of master threads is insufficient, high-level processes will be executed first in the execution queue, and processes with the same priority will be executed in a first-in first-out order.
+      * Worker group: The process can only be executed in the specified worker machine group. The default is Default, which can be executed on any worker.
+      * Notification group: select notification strategy||timeout alarm||when fault tolerance occurs, process information or email will be sent to all members in the notification group.
+      * Recipient: Select notification policy||Timeout alarm||When fault tolerance occurs, process information or alarm email will be sent to the recipient list.
+      * Cc: Select the notification strategy||Timeout alarm||When fault tolerance occurs, the process information or warning email will be copied to the CC list.
+      * Complement: Two modes including serial complement and parallel complement. Serial complement: within the specified time range, the complement is executed sequentially from the start date to the end date, and only one process instance is generated; parallel complement: within the specified time range, multiple days are complemented at the same time to generate N process instances.
+    * Complement: Execute the workflow definition of the specified date, you can select the time range of the complement (currently only supports the complement for consecutive days), for example, you need to supplement the data from September 19 to October 16, as shown in the following figure:

Review comment:
       ```suggestion
       * supplement the data from September 19 to October 16
   ```date not the same as cn version


----------------------------------------------------------------
This is an automated message from the Apache Git Service.
To respond to the message, please log on to GitHub and use the
URL above to go to the specific comment.

For queries about this service, please contact Infrastructure at:
users@infra.apache.org
[GitHub] [incubator-dolphinscheduler-website] AhahaGe commented on a change in pull request #190: [Feature][Docs] Add English version of "system-manual" to the documentation
Posted by GitBox <gi...@apache.org>.
AhahaGe commented on a change in pull request #190:
URL: https://github.com/apache/incubator-dolphinscheduler-website/pull/190#discussion_r503236814


##########
File path: docs/en-us/1.3.2/user_doc/system-manual.md
##########
@@ -0,0 +1,883 @@
+# System User Manual
+
+## Get started quickly
+
+> Please refer to [Quick Start](quick-start.html)
+
+## Operation guide
+
+### 1. Home
+
+The home page contains task status statistics, process status statistics, and workflow definition statistics for all projects of the user.
+
+<p align="center">
+<img src="/img/home_en.png" width="80%" />
+</p>
+
+### 2. Project management
+
+#### 2.1 Create project
+
+- Click "Project Management" to enter the project management page, click the "Create Project" button, enter the project name, project description, and click "Submit" to create a new project.
+
+  <p align="center">
+      <img src="/img/create_project_en1.png" width="80%" />
+  </p>
+
+#### 2.2 Project home
+
+- Click the project name link on the project management page to enter the project home page, as shown in the figure below, the project home page contains the task status statistics, process status statistics, and workflow definition statistics of the project.
+  <p align="center">
+     <img src="/img/project_home_en.png" width="80%" />
+  </p>
+
+- Task status statistics: within the specified time range, count the number of tasks in the task instance as successful submission, running, ready to pause, pause, ready to stop, stop, failure, success, fault tolerance, kill, and waiting threads
+- Process status statistics: within the specified time range, count the number of the status of the workflow instance as submission success, running, ready to pause, pause, ready to stop, stop, failure, success, fault tolerance, kill, and waiting threads
+- Workflow definition statistics: Count the workflow definitions created by users and the workflow definitions granted to this user by the administrator
+
+#### 2.3 Workflow definition
+
+#### <span id=creatDag>2.3.1 Create a workflow definition</span>
+
+- Click Project Management -> Workflow -> Workflow Definition to enter the workflow definition page, and click the "Create Workflow" button to enter the **workflow DAG edit** page, as shown in the following figure:
+  <p align="center">
+      <img src="/img/dag5.png" width="80%" />
+  </p>
+- Drag in the toolbar <img src="/img/shell.png" width="35"/> Add a Shell task to the drawing board, as shown in the figure below:
+  <p align="center">
+      <img src="/img/shell-en.png" width="80%" />
+  </p>
+- **Add parameter settings for shell tasks:**
+
+1. Fill in the "Node Name", "Description", and "Script" fields;
+2. Check “Normal” for “Run Flag”. If “Prohibit Execution” is checked, the task will not be executed when running the workflow;
+3. Select "Task Priority": When the number of worker threads is insufficient, high-level tasks will be executed first in the execution queue, and tasks with the same priority will be executed in the order of first in, first out;
+4. Timeout alarm (not required): Check the timeout alarm, timeout failure, and fill in the "timeout period". When the task execution time exceeds **timeout period**, an alert email will be sent and the task timeout fails;
+5. Resources (optional). Resource files are files created or uploaded on the Resource Center -> File Management page. For example, the file name is `test.sh`, and the command to call the resource in the script is `sh test.sh`;
+6. Custom parameters (not required), refer to [Custom Parameters](#UserDefinedParameters);
+7. Click the "Confirm Add" button to save the task settings.
+
+- **Increase the order of task execution:** Click the icon in the upper right corner <img src="/img/line.png" width="35"/> to connect the task; as shown in the figure below, task 2 and task 3 are executed in parallel, When task 1 is executed, tasks 2 and 3 will be executed simultaneously.
+
+  <p align="center">
+     <img src="/img/dag6.png" width="80%" />
+  </p>
+
+- **Delete dependencies:** Click the "arrow" icon in the upper right corner <img src="/img/arrow.png" width="35"/>, select the connection line, and click the "Delete" icon in the upper right corner <img src= "/img/delete.png" width="35"/>, delete dependencies between tasks.
+  <p align="center">
+     <img src="/img/dag7.png" width="80%" />
+  </p>
+
+- **Save workflow definition:** Click the "Save" button, and the "Set DAG chart name" pop-up box will pop up, as shown in the figure below. Enter the workflow definition name, workflow definition description, and set global parameters (optional, refer to [ Custom parameters](#UserDefinedParameters)), click the "Add" button, and the workflow definition is created successfully.
+  <p align="center">
+     <img src="/img/dag8.png" width="80%" />
+   </p>
+> For other types of tasks, please refer to [Task Node Type and Parameter Settings](#TaskParamers).
+
+#### 2.3.2 Workflow definition operation function
+
+Click Project Management -> Workflow -> Workflow Definition to enter the workflow definition page, as shown below:
+
+<p align="center">
+<img src="/img/work_list_en.png" width="80%" />
+</p>
+The operation functions of the workflow definition list are as follows:
+
+- **Edit:** Only "offline" workflow definitions can be edited. Workflow DAG editing is the same as [Create Workflow Definition](#creatDag).
+- **Online:** When the workflow status is "Offline", the workflow is online. Only the workflow in the "Online" state can run, but cannot be edited.
+- **Offline:** When the workflow status is "Online", the workflow is offline. Only the workflow in the "Offline" state can be edited, but not run.

Review comment:
       When the workflow status is "Online", used to offline workflow.


----------------------------------------------------------------
This is an automated message from the Apache Git Service.
To respond to the message, please log on to GitHub and use the
URL above to go to the specific comment.

For queries about this service, please contact Infrastructure at:
users@infra.apache.org
[GitHub] [incubator-dolphinscheduler-website] AhahaGe commented on a change in pull request #190: [Feature][Docs] Add English version of "system-manual" to the documentation
Posted by GitBox <gi...@apache.org>.
AhahaGe commented on a change in pull request #190:
URL: https://github.com/apache/incubator-dolphinscheduler-website/pull/190#discussion_r503236814


##########
File path: docs/en-us/1.3.2/user_doc/system-manual.md
##########
@@ -0,0 +1,883 @@
+# System User Manual
+
+## Get started quickly
+
+> Please refer to [Quick Start](quick-start.html)
+
+## Operation guide
+
+### 1. Home
+
+The home page contains task status statistics, process status statistics, and workflow definition statistics for all projects of the user.
+
+<p align="center">
+<img src="/img/home_en.png" width="80%" />
+</p>
+
+### 2. Project management
+
+#### 2.1 Create project
+
+- Click "Project Management" to enter the project management page, click the "Create Project" button, enter the project name, project description, and click "Submit" to create a new project.
+
+  <p align="center">
+      <img src="/img/create_project_en1.png" width="80%" />
+  </p>
+
+#### 2.2 Project home
+
+- Click the project name link on the project management page to enter the project home page, as shown in the figure below, the project home page contains the task status statistics, process status statistics, and workflow definition statistics of the project.
+  <p align="center">
+     <img src="/img/project_home_en.png" width="80%" />
+  </p>
+
+- Task status statistics: within the specified time range, count the number of tasks in the task instance as successful submission, running, ready to pause, pause, ready to stop, stop, failure, success, fault tolerance, kill, and waiting threads
+- Process status statistics: within the specified time range, count the number of the status of the workflow instance as submission success, running, ready to pause, pause, ready to stop, stop, failure, success, fault tolerance, kill, and waiting threads
+- Workflow definition statistics: Count the workflow definitions created by users and the workflow definitions granted to this user by the administrator
+
+#### 2.3 Workflow definition
+
+#### <span id=creatDag>2.3.1 Create a workflow definition</span>
+
+- Click Project Management -> Workflow -> Workflow Definition to enter the workflow definition page, and click the "Create Workflow" button to enter the **workflow DAG edit** page, as shown in the following figure:
+  <p align="center">
+      <img src="/img/dag5.png" width="80%" />
+  </p>
+- Drag in the toolbar <img src="/img/shell.png" width="35"/> Add a Shell task to the drawing board, as shown in the figure below:
+  <p align="center">
+      <img src="/img/shell-en.png" width="80%" />
+  </p>
+- **Add parameter settings for shell tasks:**
+
+1. Fill in the "Node Name", "Description", and "Script" fields;
+2. Check “Normal” for “Run Flag”. If “Prohibit Execution” is checked, the task will not be executed when running the workflow;
+3. Select "Task Priority": When the number of worker threads is insufficient, high-level tasks will be executed first in the execution queue, and tasks with the same priority will be executed in the order of first in, first out;
+4. Timeout alarm (not required): Check the timeout alarm, timeout failure, and fill in the "timeout period". When the task execution time exceeds **timeout period**, an alert email will be sent and the task timeout fails;
+5. Resources (optional). Resource files are files created or uploaded on the Resource Center -> File Management page. For example, the file name is `test.sh`, and the command to call the resource in the script is `sh test.sh`;
+6. Custom parameters (not required), refer to [Custom Parameters](#UserDefinedParameters);
+7. Click the "Confirm Add" button to save the task settings.
+
+- **Increase the order of task execution:** Click the icon in the upper right corner <img src="/img/line.png" width="35"/> to connect the task; as shown in the figure below, task 2 and task 3 are executed in parallel, When task 1 is executed, tasks 2 and 3 will be executed simultaneously.
+
+  <p align="center">
+     <img src="/img/dag6.png" width="80%" />
+  </p>
+
+- **Delete dependencies:** Click the "arrow" icon in the upper right corner <img src="/img/arrow.png" width="35"/>, select the connection line, and click the "Delete" icon in the upper right corner <img src= "/img/delete.png" width="35"/>, delete dependencies between tasks.
+  <p align="center">
+     <img src="/img/dag7.png" width="80%" />
+  </p>
+
+- **Save workflow definition:** Click the "Save" button, and the "Set DAG chart name" pop-up box will pop up, as shown in the figure below. Enter the workflow definition name, workflow definition description, and set global parameters (optional, refer to [ Custom parameters](#UserDefinedParameters)), click the "Add" button, and the workflow definition is created successfully.
+  <p align="center">
+     <img src="/img/dag8.png" width="80%" />
+   </p>
+> For other types of tasks, please refer to [Task Node Type and Parameter Settings](#TaskParamers).
+
+#### 2.3.2 Workflow definition operation function
+
+Click Project Management -> Workflow -> Workflow Definition to enter the workflow definition page, as shown below:
+
+<p align="center">
+<img src="/img/work_list_en.png" width="80%" />
+</p>
+The operation functions of the workflow definition list are as follows:
+
+- **Edit:** Only "offline" workflow definitions can be edited. Workflow DAG editing is the same as [Create Workflow Definition](#creatDag).
+- **Online:** When the workflow status is "Offline", the workflow is online. Only the workflow in the "Online" state can run, but cannot be edited.
+- **Offline:** When the workflow status is "Online", the workflow is offline. Only the workflow in the "Offline" state can be edited, but not run.

Review comment:
       ```suggestion
   - **Offline:** When the workflow status is "Online", click to offline workflow. Only the workflow in the "Offline" state can be edited, but not run.
   ```


----------------------------------------------------------------
This is an automated message from the Apache Git Service.
To respond to the message, please log on to GitHub and use the
URL above to go to the specific comment.

For queries about this service, please contact Infrastructure at:
users@infra.apache.org
[GitHub] [incubator-dolphinscheduler-website] dailidong commented on pull request #190: [Feature][Docs] Add English version of "system-manual" to the documentation
Posted by GitBox <gi...@apache.org>.
dailidong commented on pull request #190:
URL: https://github.com/apache/incubator-dolphinscheduler-website/pull/190#issuecomment-708433879


   when github action work done, this document will be shown on official website


----------------------------------------------------------------
This is an automated message from the Apache Git Service.
To respond to the message, please log on to GitHub and use the
URL above to go to the specific comment.

For queries about this service, please contact Infrastructure at:
users@infra.apache.org
[GitHub] [incubator-dolphinscheduler-website] AhahaGe commented on a change in pull request #190: [Feature][Docs] Add English version of "system-manual" to the documentation
Posted by GitBox <gi...@apache.org>.
AhahaGe commented on a change in pull request #190:
URL: https://github.com/apache/incubator-dolphinscheduler-website/pull/190#discussion_r503232232


##########
File path: docs/en-us/1.3.2/user_doc/system-manual.md
##########
@@ -0,0 +1,883 @@
+# System User Manual
+
+## Get started quickly
+
+> Please refer to [Quick Start](quick-start.html)
+
+## Operation guide
+
+### 1. Home
+
+The home page contains task status statistics, process status statistics, and workflow definition statistics for all projects of the user.
+
+<p align="center">
+<img src="/img/home_en.png" width="80%" />
+</p>
+
+### 2. Project management
+
+#### 2.1 Create project
+
+- Click "Project Management" to enter the project management page, click the "Create Project" button, enter the project name, project description, and click "Submit" to create a new project.
+
+  <p align="center">
+      <img src="/img/create_project_en1.png" width="80%" />
+  </p>
+
+#### 2.2 Project home
+
+- Click the project name link on the project management page to enter the project home page, as shown in the figure below, the project home page contains the task status statistics, process status statistics, and workflow definition statistics of the project.
+  <p align="center">
+     <img src="/img/project_home_en.png" width="80%" />
+  </p>
+
+- Task status statistics: within the specified time range, count the number of tasks in the task instance as successful submission, running, ready to pause, pause, ready to stop, stop, failure, success, fault tolerance, kill, and waiting threads
+- Process status statistics: within the specified time range, count the number of the status of the workflow instance as submission success, running, ready to pause, pause, ready to stop, stop, failure, success, fault tolerance, kill, and waiting threads
+- Workflow definition statistics: Count the workflow definitions created by users and the workflow definitions granted to this user by the administrator
+
+#### 2.3 Workflow definition
+
+#### <span id=creatDag>2.3.1 Create a workflow definition</span>
+
+- Click Project Management -> Workflow -> Workflow Definition to enter the workflow definition page, and click the "Create Workflow" button to enter the **workflow DAG edit** page, as shown in the following figure:
+  <p align="center">
+      <img src="/img/dag5.png" width="80%" />
+  </p>
+- Drag in the toolbar <img src="/img/shell.png" width="35"/> Add a Shell task to the drawing board, as shown in the figure below:
+  <p align="center">
+      <img src="/img/shell-en.png" width="80%" />
+  </p>
+- **Add parameter settings for shell tasks:**
+
+1. Fill in the "Node Name", "Description", and "Script" fields;
+2. Check “Normal” for “Run Flag”. If “Prohibit Execution” is checked, the task will not be executed when running the workflow;
+3. Select "Task Priority": When the number of worker threads is insufficient, high-level tasks will be executed first in the execution queue, and tasks with the same priority will be executed in the order of first in, first out;
+4. Timeout alarm (not required): Check the timeout alarm, timeout failure, and fill in the "timeout period". When the task execution time exceeds **timeout period**, an alert email will be sent and the task timeout fails;

Review comment:
       not required to optional


----------------------------------------------------------------
This is an automated message from the Apache Git Service.
To respond to the message, please log on to GitHub and use the
URL above to go to the specific comment.

For queries about this service, please contact Infrastructure at:
users@infra.apache.org
[GitHub] [incubator-dolphinscheduler-website] AhahaGe commented on a change in pull request #190: [Feature][Docs] Add English version of "system-manual" to the documentation
Posted by GitBox <gi...@apache.org>.
AhahaGe commented on a change in pull request #190:
URL: https://github.com/apache/incubator-dolphinscheduler-website/pull/190#discussion_r503236657


##########
File path: docs/en-us/1.3.2/user_doc/system-manual.md
##########
@@ -0,0 +1,883 @@
+# System User Manual
+
+## Get started quickly
+
+> Please refer to [Quick Start](quick-start.html)
+
+## Operation guide
+
+### 1. Home
+
+The home page contains task status statistics, process status statistics, and workflow definition statistics for all projects of the user.
+
+<p align="center">
+<img src="/img/home_en.png" width="80%" />
+</p>
+
+### 2. Project management
+
+#### 2.1 Create project
+
+- Click "Project Management" to enter the project management page, click the "Create Project" button, enter the project name, project description, and click "Submit" to create a new project.
+
+  <p align="center">
+      <img src="/img/create_project_en1.png" width="80%" />
+  </p>
+
+#### 2.2 Project home
+
+- Click the project name link on the project management page to enter the project home page, as shown in the figure below, the project home page contains the task status statistics, process status statistics, and workflow definition statistics of the project.
+  <p align="center">
+     <img src="/img/project_home_en.png" width="80%" />
+  </p>
+
+- Task status statistics: within the specified time range, count the number of tasks in the task instance as successful submission, running, ready to pause, pause, ready to stop, stop, failure, success, fault tolerance, kill, and waiting threads
+- Process status statistics: within the specified time range, count the number of the status of the workflow instance as submission success, running, ready to pause, pause, ready to stop, stop, failure, success, fault tolerance, kill, and waiting threads
+- Workflow definition statistics: Count the workflow definitions created by users and the workflow definitions granted to this user by the administrator
+
+#### 2.3 Workflow definition
+
+#### <span id=creatDag>2.3.1 Create a workflow definition</span>
+
+- Click Project Management -> Workflow -> Workflow Definition to enter the workflow definition page, and click the "Create Workflow" button to enter the **workflow DAG edit** page, as shown in the following figure:
+  <p align="center">
+      <img src="/img/dag5.png" width="80%" />
+  </p>
+- Drag in the toolbar <img src="/img/shell.png" width="35"/> Add a Shell task to the drawing board, as shown in the figure below:
+  <p align="center">
+      <img src="/img/shell-en.png" width="80%" />
+  </p>
+- **Add parameter settings for shell tasks:**
+
+1. Fill in the "Node Name", "Description", and "Script" fields;
+2. Check “Normal” for “Run Flag”. If “Prohibit Execution” is checked, the task will not be executed when running the workflow;
+3. Select "Task Priority": When the number of worker threads is insufficient, high-level tasks will be executed first in the execution queue, and tasks with the same priority will be executed in the order of first in, first out;
+4. Timeout alarm (not required): Check the timeout alarm, timeout failure, and fill in the "timeout period". When the task execution time exceeds **timeout period**, an alert email will be sent and the task timeout fails;
+5. Resources (optional). Resource files are files created or uploaded on the Resource Center -> File Management page. For example, the file name is `test.sh`, and the command to call the resource in the script is `sh test.sh`;
+6. Custom parameters (not required), refer to [Custom Parameters](#UserDefinedParameters);
+7. Click the "Confirm Add" button to save the task settings.
+
+- **Increase the order of task execution:** Click the icon in the upper right corner <img src="/img/line.png" width="35"/> to connect the task; as shown in the figure below, task 2 and task 3 are executed in parallel, When task 1 is executed, tasks 2 and 3 will be executed simultaneously.
+
+  <p align="center">
+     <img src="/img/dag6.png" width="80%" />
+  </p>
+
+- **Delete dependencies:** Click the "arrow" icon in the upper right corner <img src="/img/arrow.png" width="35"/>, select the connection line, and click the "Delete" icon in the upper right corner <img src= "/img/delete.png" width="35"/>, delete dependencies between tasks.
+  <p align="center">
+     <img src="/img/dag7.png" width="80%" />
+  </p>
+
+- **Save workflow definition:** Click the "Save" button, and the "Set DAG chart name" pop-up box will pop up, as shown in the figure below. Enter the workflow definition name, workflow definition description, and set global parameters (optional, refer to [ Custom parameters](#UserDefinedParameters)), click the "Add" button, and the workflow definition is created successfully.
+  <p align="center">
+     <img src="/img/dag8.png" width="80%" />
+   </p>
+> For other types of tasks, please refer to [Task Node Type and Parameter Settings](#TaskParamers).
+
+#### 2.3.2 Workflow definition operation function
+
+Click Project Management -> Workflow -> Workflow Definition to enter the workflow definition page, as shown below:
+
+<p align="center">
+<img src="/img/work_list_en.png" width="80%" />
+</p>
+The operation functions of the workflow definition list are as follows:
+
+- **Edit:** Only "offline" workflow definitions can be edited. Workflow DAG editing is the same as [Create Workflow Definition](#creatDag).
+- **Online:** When the workflow status is "Offline", the workflow is online. Only the workflow in the "Online" state can run, but cannot be edited.

Review comment:
       When the workflow status is "Offline", used to online workflow.


----------------------------------------------------------------
This is an automated message from the Apache Git Service.
To respond to the message, please log on to GitHub and use the
URL above to go to the specific comment.

For queries about this service, please contact Infrastructure at:
users@infra.apache.org
[GitHub] [incubator-dolphinscheduler-website] Segun-Ogundipe commented on pull request #190: [Feature][Docs] Add English version of "system-manual" to the documentation
Posted by GitBox <gi...@apache.org>.
Segun-Ogundipe commented on pull request #190:
URL: https://github.com/apache/incubator-dolphinscheduler-website/pull/190#issuecomment-707218827


   Hi, @AhahaGe , @dailidong, I've made the requested changes kindly check


----------------------------------------------------------------
This is an automated message from the Apache Git Service.
To respond to the message, please log on to GitHub and use the
URL above to go to the specific comment.

For queries about this service, please contact Infrastructure at:
users@infra.apache.org
[GitHub] [incubator-dolphinscheduler-website] AhahaGe commented on a change in pull request #190: [Feature][Docs] Add English version of "system-manual" to the documentation
Posted by GitBox <gi...@apache.org>.
AhahaGe commented on a change in pull request #190:
URL: https://github.com/apache/incubator-dolphinscheduler-website/pull/190#discussion_r503230026


##########
File path: docs/en-us/1.3.2/user_doc/system-manual.md
##########
@@ -0,0 +1,883 @@
+# System User Manual
+
+## Get started quickly
+
+> Please refer to [Quick Start](quick-start.html)
+
+## Operation guide
+
+### 1. Home
+
+The home page contains task status statistics, process status statistics, and workflow definition statistics for all projects of the user.
+
+<p align="center">
+<img src="/img/home_en.png" width="80%" />
+</p>
+
+### 2. Project management
+
+#### 2.1 Create project
+
+- Click "Project Management" to enter the project management page, click the "Create Project" button, enter the project name, project description, and click "Submit" to create a new project.
+
+  <p align="center">
+      <img src="/img/create_project_en1.png" width="80%" />
+  </p>
+
+#### 2.2 Project home
+
+- Click the project name link on the project management page to enter the project home page, as shown in the figure below, the project home page contains the task status statistics, process status statistics, and workflow definition statistics of the project.
+  <p align="center">
+     <img src="/img/project_home_en.png" width="80%" />
+  </p>
+
+- Task status statistics: within the specified time range, count the number of tasks in the task instance as successful submission, running, ready to pause, pause, ready to stop, stop, failure, success, fault tolerance, kill, and waiting threads
+- Process status statistics: within the specified time range, count the number of the status of the workflow instance as submission success, running, ready to pause, pause, ready to stop, stop, failure, success, fault tolerance, kill, and waiting threads
+- Workflow definition statistics: Count the workflow definitions created by users and the workflow definitions granted to this user by the administrator
+
+#### 2.3 Workflow definition
+
+#### <span id=creatDag>2.3.1 Create a workflow definition</span>
+
+- Click Project Management -> Workflow -> Workflow Definition to enter the workflow definition page, and click the "Create Workflow" button to enter the **workflow DAG edit** page, as shown in the following figure:
+  <p align="center">
+      <img src="/img/dag5.png" width="80%" />
+  </p>
+- Drag in the toolbar <img src="/img/shell.png" width="35"/> Add a Shell task to the drawing board, as shown in the figure below:
+  <p align="center">
+      <img src="/img/shell-en.png" width="80%" />
+  </p>
+- **Add parameter settings for shell tasks:**

Review comment:
       ```suggestion
   - **Add parameter settings for this shell task:**
   ```


----------------------------------------------------------------
This is an automated message from the Apache Git Service.
To respond to the message, please log on to GitHub and use the
URL above to go to the specific comment.

For queries about this service, please contact Infrastructure at:
users@infra.apache.org
[GitHub] [incubator-dolphinscheduler-website] AhahaGe commented on a change in pull request #190: [Feature][Docs] Add English version of "system-manual" to the documentation
Posted by GitBox <gi...@apache.org>.
AhahaGe commented on a change in pull request #190:
URL: https://github.com/apache/incubator-dolphinscheduler-website/pull/190#discussion_r503227105


##########
File path: docs/en-us/1.3.2/user_doc/system-manual.md
##########
@@ -0,0 +1,883 @@
+# System User Manual
+
+## Get started quickly
+
+> Please refer to [Quick Start](quick-start.html)
+
+## Operation guide
+
+### 1. Home
+
+The home page contains task status statistics, process status statistics, and workflow definition statistics for all projects of the user.
+
+<p align="center">
+<img src="/img/home_en.png" width="80%" />
+</p>
+
+### 2. Project management
+
+#### 2.1 Create project
+
+- Click "Project Management" to enter the project management page, click the "Create Project" button, enter the project name, project description, and click "Submit" to create a new project.
+
+  <p align="center">
+      <img src="/img/create_project_en1.png" width="80%" />
+  </p>
+
+#### 2.2 Project home
+
+- Click the project name link on the project management page to enter the project home page, as shown in the figure below, the project home page contains the task status statistics, process status statistics, and workflow definition statistics of the project.
+  <p align="center">
+     <img src="/img/project_home_en.png" width="80%" />
+  </p>
+
+- Task status statistics: within the specified time range, count the number of tasks in the task instance as successful submission, running, ready to pause, pause, ready to stop, stop, failure, success, fault tolerance, kill, and waiting threads
+- Process status statistics: within the specified time range, count the number of the status of the workflow instance as submission success, running, ready to pause, pause, ready to stop, stop, failure, success, fault tolerance, kill, and waiting threads
+- Workflow definition statistics: Count the workflow definitions created by users and the workflow definitions granted to this user by the administrator

Review comment:
       ```suggestion
   - Workflow definition statistics: Count the workflow definitions created by this user and the workflow definitions granted to this user by the administrator
   ```


----------------------------------------------------------------
This is an automated message from the Apache Git Service.
To respond to the message, please log on to GitHub and use the
URL above to go to the specific comment.

For queries about this service, please contact Infrastructure at:
users@infra.apache.org
[GitHub] [incubator-dolphinscheduler-website] lgcareer edited a comment on pull request #190: [Feature][Docs] Add English version of "system-manual" to the documentation
Posted by GitBox <gi...@apache.org>.
lgcareer edited a comment on pull request #190:
URL: https://github.com/apache/incubator-dolphinscheduler-website/pull/190#issuecomment-706829629
@Segun-Ogundipe
Thanks for your contribution.
The spark task node page still used chinese.Here need change to the english.
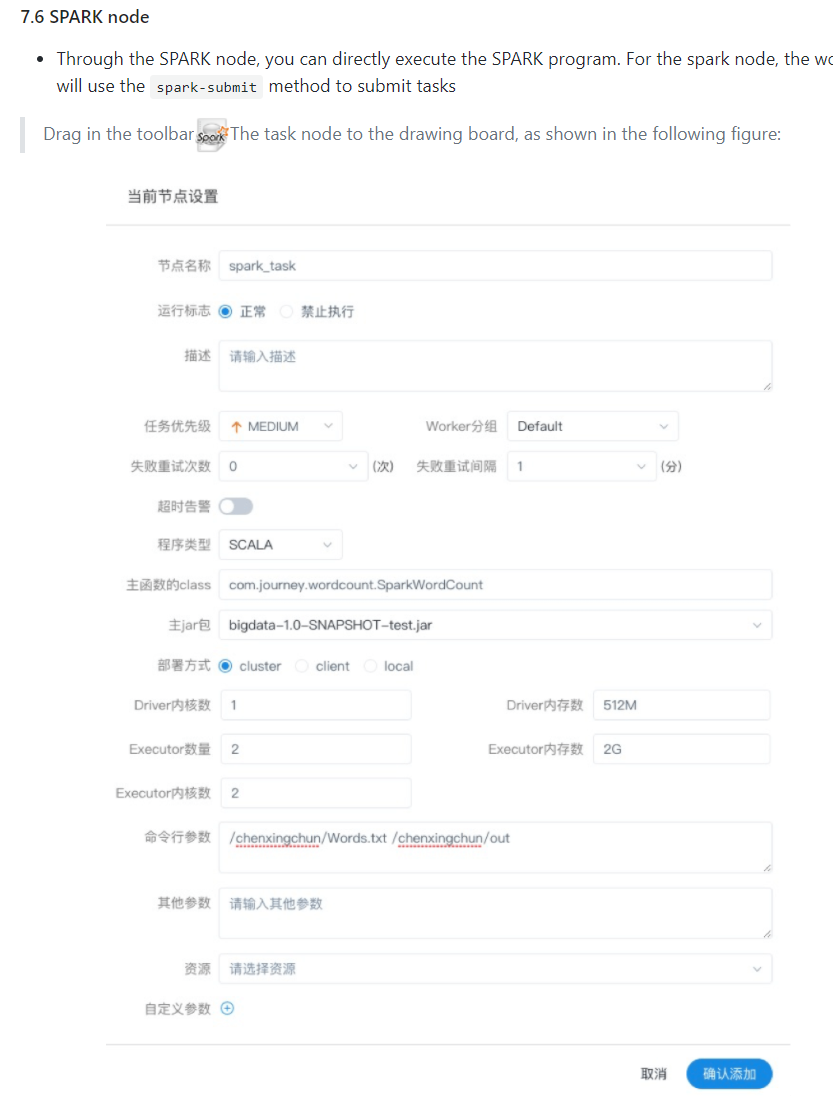
----------------------------------------------------------------
This is an automated message from the Apache Git Service.
To respond to the message, please log on to GitHub and use the
URL above to go to the specific comment.
For queries about this service, please contact Infrastructure at:
users@infra.apache.org
[GitHub] [incubator-dolphinscheduler-website] AhahaGe commented on a change in pull request #190: [Feature][Docs] Add English version of "system-manual" to the documentation
Posted by GitBox <gi...@apache.org>.
AhahaGe commented on a change in pull request #190:
URL: https://github.com/apache/incubator-dolphinscheduler-website/pull/190#discussion_r503249021


##########
File path: docs/en-us/1.3.2/user_doc/system-manual.md
##########
@@ -0,0 +1,883 @@
+# System User Manual
+
+## Get started quickly
+
+> Please refer to [Quick Start](quick-start.html)
+
+## Operation guide
+
+### 1. Home
+
+The home page contains task status statistics, process status statistics, and workflow definition statistics for all projects of the user.
+
+<p align="center">
+<img src="/img/home_en.png" width="80%" />
+</p>
+
+### 2. Project management
+
+#### 2.1 Create project
+
+- Click "Project Management" to enter the project management page, click the "Create Project" button, enter the project name, project description, and click "Submit" to create a new project.
+
+  <p align="center">
+      <img src="/img/create_project_en1.png" width="80%" />
+  </p>
+
+#### 2.2 Project home
+
+- Click the project name link on the project management page to enter the project home page, as shown in the figure below, the project home page contains the task status statistics, process status statistics, and workflow definition statistics of the project.
+  <p align="center">
+     <img src="/img/project_home_en.png" width="80%" />
+  </p>
+
+- Task status statistics: within the specified time range, count the number of tasks in the task instance as successful submission, running, ready to pause, pause, ready to stop, stop, failure, success, fault tolerance, kill, and waiting threads
+- Process status statistics: within the specified time range, count the number of the status of the workflow instance as submission success, running, ready to pause, pause, ready to stop, stop, failure, success, fault tolerance, kill, and waiting threads
+- Workflow definition statistics: Count the workflow definitions created by users and the workflow definitions granted to this user by the administrator
+
+#### 2.3 Workflow definition
+
+#### <span id=creatDag>2.3.1 Create a workflow definition</span>
+
+- Click Project Management -> Workflow -> Workflow Definition to enter the workflow definition page, and click the "Create Workflow" button to enter the **workflow DAG edit** page, as shown in the following figure:
+  <p align="center">
+      <img src="/img/dag5.png" width="80%" />
+  </p>
+- Drag in the toolbar <img src="/img/shell.png" width="35"/> Add a Shell task to the drawing board, as shown in the figure below:
+  <p align="center">
+      <img src="/img/shell-en.png" width="80%" />
+  </p>
+- **Add parameter settings for shell tasks:**
+
+1. Fill in the "Node Name", "Description", and "Script" fields;
+2. Check “Normal” for “Run Flag”. If “Prohibit Execution” is checked, the task will not be executed when running the workflow;
+3. Select "Task Priority": When the number of worker threads is insufficient, high-level tasks will be executed first in the execution queue, and tasks with the same priority will be executed in the order of first in, first out;
+4. Timeout alarm (not required): Check the timeout alarm, timeout failure, and fill in the "timeout period". When the task execution time exceeds **timeout period**, an alert email will be sent and the task timeout fails;
+5. Resources (optional). Resource files are files created or uploaded on the Resource Center -> File Management page. For example, the file name is `test.sh`, and the command to call the resource in the script is `sh test.sh`;
+6. Custom parameters (not required), refer to [Custom Parameters](#UserDefinedParameters);
+7. Click the "Confirm Add" button to save the task settings.
+
+- **Increase the order of task execution:** Click the icon in the upper right corner <img src="/img/line.png" width="35"/> to connect the task; as shown in the figure below, task 2 and task 3 are executed in parallel, When task 1 is executed, tasks 2 and 3 will be executed simultaneously.
+
+  <p align="center">
+     <img src="/img/dag6.png" width="80%" />
+  </p>
+
+- **Delete dependencies:** Click the "arrow" icon in the upper right corner <img src="/img/arrow.png" width="35"/>, select the connection line, and click the "Delete" icon in the upper right corner <img src= "/img/delete.png" width="35"/>, delete dependencies between tasks.
+  <p align="center">
+     <img src="/img/dag7.png" width="80%" />
+  </p>
+
+- **Save workflow definition:** Click the "Save" button, and the "Set DAG chart name" pop-up box will pop up, as shown in the figure below. Enter the workflow definition name, workflow definition description, and set global parameters (optional, refer to [ Custom parameters](#UserDefinedParameters)), click the "Add" button, and the workflow definition is created successfully.
+  <p align="center">
+     <img src="/img/dag8.png" width="80%" />
+   </p>
+> For other types of tasks, please refer to [Task Node Type and Parameter Settings](#TaskParamers).
+
+#### 2.3.2 Workflow definition operation function
+
+Click Project Management -> Workflow -> Workflow Definition to enter the workflow definition page, as shown below:
+
+<p align="center">
+<img src="/img/work_list_en.png" width="80%" />
+</p>
+The operation functions of the workflow definition list are as follows:
+
+- **Edit:** Only "offline" workflow definitions can be edited. Workflow DAG editing is the same as [Create Workflow Definition](#creatDag).
+- **Online:** When the workflow status is "Offline", the workflow is online. Only the workflow in the "Online" state can run, but cannot be edited.
+- **Offline:** When the workflow status is "Online", the workflow is offline. Only the workflow in the "Offline" state can be edited, but not run.
+- **Run:** Only workflow in the online state can run. See [2.3.3 Run Workflow](#runWorkflow) for the operation steps
+- **Timing:** Timing can only be set in online workflows, and the system automatically schedules the workflow to run on a regular basis. The status after creating a timing is "offline", and the timing must be online on the timing management page to take effect. See [2.3.4 Workflow Timing](#creatTiming) for timing operation steps.
+- **Timing Management:** The timing management page can be edited, online/offline, and deleted.
+- **Delete:** Delete the workflow definition.
+- **Download:** Download workflow definition to local.
+- **Tree Diagram:** Display the task node type and task status in a tree structure, as shown in the figure below:
+  <p align="center">
+      <img src="/img/tree_en.png" width="80%" />
+  </p>
+
+#### <span id=runWorkflow>2.3.3 Run the workflow</span>
+
+- Click Project Management -> Workflow -> Workflow Definition to enter the workflow definition page, as shown in the figure below, click the "Go Online" button <img src="/img/online.png" width="35"/>,Go online workflow.
+  <p align="center">
+      <img src="/img/work_list_en.png" width="80%" />
+  </p>
+
+- Click the "Run" button to pop up the startup parameter setting pop-up box, as shown in the figure below, set the startup parameters, click the "Run" button in the pop-up box, the workflow starts running, and the workflow instance page generates a workflow instance.
+     <p align="center">
+       <img src="/img/run_work_en.png" width="80%" />
+     </p>
+  <span id=runParamers>Description of workflow operating parameters:</span>
+
+      * Failure strategy: When a task node fails to execute, other parallel task nodes need to execute the strategy. "Continue" means: after a certain task fails, other task nodes execute normally; "End" means: terminate all tasks being executed, and terminate the entire process.
+      * Notification strategy: When the process is over, the process execution information notification email is sent according to the process status, including any status is not sent, successful, failed, successful or failed.
+      * Process priority: The priority of process operation, divided into five levels: highest (HIGHEST), high (HIGH), medium (MEDIUM), low (LOW), and lowest (LOWEST). When the number of master threads is insufficient, high-level processes will be executed first in the execution queue, and processes with the same priority will be executed in a first-in first-out order.
+      * Worker group: The process can only be executed in the specified worker machine group. The default is Default, which can be executed on any worker.
+      * Notification group: select notification strategy||timeout alarm||when fault tolerance occurs, process information or email will be sent to all members in the notification group.
+      * Recipient: Select notification policy||Timeout alarm||When fault tolerance occurs, process information or alarm email will be sent to the recipient list.
+      * Cc: Select the notification strategy||Timeout alarm||When fault tolerance occurs, the process information or warning email will be copied to the CC list.
+      * Complement: Two modes including serial complement and parallel complement. Serial complement: within the specified time range, the complement is executed sequentially from the start date to the end date, and only one process instance is generated; parallel complement: within the specified time range, multiple days are complemented at the same time to generate N process instances.
+    * Complement: Execute the workflow definition of the specified date, you can select the time range of the complement (currently only supports the complement for consecutive days), for example, you need to supplement the data from September 19 to October 16, as shown in the following figure:
+    <p align="center">
+        <img src="/img/complement_en.png" width="80%" />
+    </p>
+
+  > Serial mode: The complement is executed sequentially from September 19 to October 16, and a process instance is generated on the process instance page;
+
+  > Parallel mode: The tasks from September 19 to October 16 are executed simultaneously, and 28 process instances are generated on the process instance page.
+
+#### <span id=creatTiming>2.3.4 Workflow timing</span>
+
+- Create timing: Click Project Management->Workflow->Workflow Definition, enter the workflow definition page, go online the workflow, click the "timing" button <img src="/img/timing.png" width="35"/> ,The timing parameter setting dialog box pops up, as shown in the figure below:
+  <p align="center">
+      <img src="/img/time_schedule_en.png" width="80%" />
+  </p>
+- Choose the start and end time. In the start and end time range, the workflow is run at regular intervals; not in the start and end time range, no more regular workflow instances are generated.
+- Add a timing that is executed once every day at 5 AM, as shown in the following figure:
+  <p align="center">
+      <img src="/img/timer-en.png" width="80%" />
+  </p>
+- Failure strategy, notification strategy, process priority, worker grouping, notification group, recipient, and CC are the same as [workflow running parameters](#runParamers).
+- Click the "Create" button to create the timing successfully. At this time, the timing status is "**Offline**" and the timing needs to be **Online** to take effect.
+- Timed online: Click the "timing management" button <img src="/img/timeManagement.png" width="35"/>, enter the timing management page, click the "online" button, the timing status will change to "online", as follows As shown in the figure, the workflow takes effect regularly.

Review comment:
       ```suggestion
   - Timing online: Click the "timing management" button <img src="/img/timeManagement.png" width="35"/>, enter the timing management page, click the "online" button, the timing status will change to "online", as shown in the below figure, the workflow takes effect regularly.
   ```


----------------------------------------------------------------
This is an automated message from the Apache Git Service.
To respond to the message, please log on to GitHub and use the
URL above to go to the specific comment.

For queries about this service, please contact Infrastructure at:
users@infra.apache.org
[GitHub] [incubator-dolphinscheduler-website] AhahaGe commented on a change in pull request #190: [Feature][Docs] Add English version of "system-manual" to the documentation
Posted by GitBox <gi...@apache.org>.
AhahaGe commented on a change in pull request #190:
URL: https://github.com/apache/incubator-dolphinscheduler-website/pull/190#discussion_r504589079


##########
File path: docs/en-us/1.3.2/user_doc/system-manual.md
##########
@@ -0,0 +1,886 @@
+# System User Manual
+
+## Get started quickly
+
+> Please refer to [Quick Start](quick-start.html)
+
+## Operation guide
+
+### 1. Home
+
+The home page contains task status statistics, process status statistics, and workflow definition statistics for all projects of the user.
+
+<p align="center">
+<img src="/img/home_en.png" width="80%" />
+</p>
+
+### 2. Project management
+
+#### 2.1 Create project
+
+- Click "Project Management" to enter the project management page, click the "Create Project" button, enter the project name, project description, and click "Submit" to create a new project.
+
+  <p align="center">
+      <img src="/img/create_project_en1.png" width="80%" />
+  </p>
+
+#### 2.2 Project home
+
+- Click the project name link on the project management page to enter the project home page, as shown in the figure below, the project home page contains the task status statistics, process status statistics, and workflow definition statistics of the project.
+  <p align="center">
+     <img src="/img/project_home_en.png" width="80%" />
+  </p>
+
+- Task status statistics: within the specified time range, count the number of task instances as successful submission, running, ready to pause, pause, ready to stop, stop, failure, success, fault tolerance, kill, and waiting threads
+- Process status statistics: within the specified time range, count the number of the status of the workflow instance as submission success, running, ready to pause, pause, ready to stop, stop, failure, success, fault tolerance, kill, and waiting threads
+- Workflow definition statistics: Count the workflow definitions created by this user and the workflow definitions granted to this user by the administrator
+
+#### 2.3 Workflow definition
+
+#### <span id=creatDag>2.3.1 Create workflow definition</span>
+
+- Click Project Management -> Workflow -> Workflow Definition to enter the workflow definition page, and click the "Create Workflow" button to enter the **workflow DAG edit** page, as shown in the following figure:
+  <p align="center">
+      <img src="/img/dag5.png" width="80%" />
+  </p>
+- Drag in the toolbar <img src="/img/shell.png" width="35"/> Add a Shell task to the drawing board, as shown in the figure below:
+  <p align="center">
+      <img src="/img/shell-en.png" width="80%" />
+  </p>
+- **Add parameter settings for this shell task:**
+
+1. Fill in the "Node Name", "Description", and "Script" fields;
+2. Check “Normal” for “Run Flag”. If “Prohibit Execution” is checked, the task will not be executed when the workflow runs;
+3. Select "Task Priority": When the number of worker threads is insufficient, high-level tasks will be executed first in the execution queue, and tasks with the same priority will be executed in the order of first in, first out;
+4. Timeout alarm (optional): Check the timeout alarm, timeout failure, and fill in the "timeout period". When the task execution time exceeds **timeout period**, an alert email will be sent and the task timeout fails;
+5. Resources (optional). Resource files are files created or uploaded on the Resource Center -> File Management page. For example, the file name is `test.sh`, and the command to call the resource in the script is `sh test.sh`;
+6. Custom parameters (optional), refer to [Custom Parameters](#UserDefinedParameters);
+7. Click the "Confirm Add" button to save the task settings.
+
+- **Increase the order of task execution:** Click the icon in the upper right corner <img src="/img/line.png" width="35"/> to connect the task; as shown in the figure below, task 2 and task 3 are executed in parallel, When task 1 finished execute, tasks 2 and 3 will be executed simultaneously.
+
+  <p align="center">
+     <img src="/img/dag6.png" width="80%" />
+  </p>
+
+- **Delete dependencies:** Click the "arrow" icon in the upper right corner <img src="/img/arrow.png" width="35"/>, select the connection line, and click the "Delete" icon in the upper right corner <img src= "/img/delete.png" width="35"/>, delete dependencies between tasks.
+  <p align="center">
+     <img src="/img/dag7.png" width="80%" />
+  </p>
+
+- **Save workflow definition:** Click the "Save" button, and the "Set DAG chart name" pop-up box will pop up, as shown in the figure below. Enter the workflow definition name, workflow definition description, and set global parameters (optional, refer to [ Custom parameters](#UserDefinedParameters)), click the "Add" button, and the workflow definition is created successfully.
+  <p align="center">
+     <img src="/img/dag8.png" width="80%" />
+   </p>
+> For other types of tasks, please refer to [Task Node Type and Parameter Settings](#TaskParamers).
+
+#### 2.3.2 Workflow definition operation function
+
+Click Project Management -> Workflow -> Workflow Definition to enter the workflow definition page, as shown below:
+
+<p align="center">
+<img src="/img/work_list_en.png" width="80%" />
+</p>
+The operation functions of the workflow definition list are as follows:
+
+- **Edit:** Only "offline" workflow definitions can be edited. Workflow DAG editing is the same as [Create Workflow Definition](#creatDag).
+- **Online:** When the workflow status is "Offline", used to online workflow. Only the workflow in the "Online" state can run, but cannot be edited.
+- **Offline:** When the workflow status is "Online", used to offline workflow. Only the workflow in the "Offline" state can be edited, but not run.
+- **Run:** Only workflow in the online state can run. See [2.3.3 Run Workflow](#runWorkflow) for the operation steps
+- **Timing:** Timing can only be set in online workflows, and the system automatically schedules the workflow to run on a regular basis. The status after creating a timing is "offline", and the timing must be online on the timing management page to take effect. See [2.3.4 Workflow Timing](#creatTiming) for timing operation steps.
+- **Timing Management:** The timing management page can be edited, online/offline, and deleted.
+- **Delete:** Delete the workflow definition.
+- **Download:** Download workflow definition to local.
+- **Tree Diagram:** Display the task node type and task status in a tree structure, as shown in the figure below:
+  <p align="center">
+      <img src="/img/tree_en.png" width="80%" />
+  </p>
+
+#### <span id=runWorkflow>2.3.3 Run the workflow</span>
+
+- Click Project Management -> Workflow -> Workflow Definition to enter the workflow definition page, as shown in the figure below, click the "Go Online" button <img src="/img/online.png" width="35"/>,Go online workflow.
+  <p align="center">
+      <img src="/img/work_list_en.png" width="80%" />
+  </p>
+
+- Click the "Run" button to pop up the startup parameter setting pop-up box, as shown in the figure below, set the startup parameters, click the "Run" button in the pop-up box, the workflow starts running, and the workflow instance page generates a workflow instance.
+     <p align="center">
+       <img src="/img/run_work_en.png" width="80%" />
+     </p>
+  <span id=runParamers>Description of workflow operating parameters:</span>
+
+      * Failure strategy: When a task node fails to execute, other parallel task nodes need to execute the strategy. "Continue" means: after a certain task fails, other task nodes execute normally; "End" means: terminate all tasks being executed, and terminate the entire process.
+      * Notification strategy: When the process is over, the process execution information notification email is sent according to the process status, including any status is not sent, successful sent, failed sent, successful or failed sent.
+      * Process priority: The priority of process operation, divided into five levels: highest (HIGHEST), high (HIGH), medium (MEDIUM), low (LOW), and lowest (LOWEST). When the number of master threads is insufficient, high-level processes will be executed first in the execution queue, and processes with the same priority will be executed in a first-in first-out order.
+      * Worker group: The process can only be executed in the specified worker machine group. The default is Default, which can be executed on any worker.
+      * Notification group: select notification strategy||timeout alarm||when fault tolerance occurs, process information or email will be sent to all members in the notification group.
+      * Recipient: Select notification policy||Timeout alarm||When fault tolerance occurs, process information or alarm email will be sent to the recipient list.
+      * Cc: Select the notification strategy||Timeout alarm||When fault tolerance occurs, the process information or warning email will be copied to the CC list.
+      * Complement: Two modes including serial complement and parallel complement. Serial complement: within the specified time range, the complement is executed sequentially from the start date to the end date, and only one process instance is generated; parallel complement: within the specified time range, multiple days are complemented at the same time to generate N process instances.
+    * For example, you need to fill in the data from May 1 to May 10.
+
+    <p align="center">
+        <img src="/img/complement_en1.png" width="80%" />
+    </p>
+
+  > Serial mode: The complement is executed sequentially from May 1 to May 10, and a process instance is generated on the process instance page;
+
+  > Parallel mode: The tasks from May 1 to may 10 are executed simultaneously, and 10 process instances are generated on the process instance page.
+
+#### <span id=creatTiming>2.3.4 Workflow timing</span>
+
+- Create timing: Click Project Management->Workflow->Workflow Definition, enter the workflow definition page, go online the workflow, click the "timing" button <img src="/img/timing.png" width="35"/> ,The timing parameter setting dialog box pops up, as shown in the figure below:
+  <p align="center">
+      <img src="/img/time_schedule_en.png" width="80%" />
+  </p>
+- Choose the start and end time. In the start and end time range, the workflow is run at regular intervals; not in the start and end time range, no more regular workflow instances are generated.
+- Add a timing that is executed once every day at 5 AM, as shown in the following figure:
+  <p align="center">
+      <img src="/img/timer-en.png" width="80%" />
+  </p>
+- Failure strategy, notification strategy, process priority, worker group, notification group, recipient, and CC are the same as [workflow running parameters](#runParamers).
+- Click the "Create" button to create the timing successfully. At this time, the timing status is "**Offline**" and the timing needs to be **Online** to take effect.
+- Timing online: Click the "timing management" button <img src="/img/timeManagement.png" width="35"/>, enter the timing management page, click the "online" button, the timing status will change to "online", as shown in the below figure, the workflow takes effect regularly.
+  <p align="center">
+      <img src="/img/time-manage-list-en.png" width="80%" />
+  </p>
+
+#### 2.3.5 Import workflow
+
+Click Project Management -> Workflow -> Workflow Definition to enter the workflow definition page, click the "Import Workflow" button to import the local workflow file, the workflow definition list displays the imported workflow, and the status is offline.
+
+#### 2.4 Workflow instance
+
+#### 2.4.1 View workflow instance
+
+- Click Project Management -> Workflow -> Workflow Instance to enter the Workflow Instance page, as shown in the figure below:
+     <p align="center">
+        <img src="/img/instance-list-en.png" width="80%" />
+     </p>
+- Click the workflow name to enter the DAG view page to view the task execution status, as shown in the figure below.
+  <p align="center">
+    <img src="/img/instance-runs-en.png" width="80%" />
+  </p>
+
+#### 2.4.2 View task log
+
+- Enter the workflow instance page, click the workflow name, enter the DAG view page, double-click the task node, as shown in the following figure:
+   <p align="center">
+     <img src="/img/instanceViewLog-en.png" width="80%" />
+   </p>
+- Click "View Log", a log pop-up box will pop up, as shown in the figure below, the task log can also be viewed on the task instance page, refer to [Task View Log](#taskLog)。
+   <p align="center">
+     <img src="/img/task-log-en.png" width="80%" />
+   </p>
+
+#### 2.4.3 View task history
+
+- Click Project Management -> Workflow -> Workflow Instance to enter the workflow instance page, and click the workflow name to enter the workflow DAG page;
+- Double-click the task node, as shown in the figure below, click "View History" to jump to the task instance page, and display a list of task instances running by the workflow instance
+   <p align="center">
+     <img src="/img/task_history_en.png" width="80%" />
+   </p>
+
+#### 2.4.4 View operating parameters
+
+- Click Project Management -> Workflow -> Workflow Instance to enter the workflow instance page, and click the workflow name to enter the workflow DAG page;
+- Click the icon in the upper left corner <img src="/img/run_params_button.png" width="35"/>,View the startup parameters of the workflow instance; click the icon <img src="/img/global_param.png" width="35"/>,View the global and local parameters of the workflow instance, as shown in the following figure:
+   <p align="center">
+     <img src="/img/run_params_en.png" width="80%" />
+   </p>
+
+#### 2.4.4 Workflow instance operation function
+
+Click Project Management -> Workflow -> Workflow Instance to enter the Workflow Instance page, as shown in the figure below:
+
+  <p align="center">
+    <img src="/img/instance-list-en.png" width="80%" />
+  </p>
+
+- **Edit:** Only terminated processes can be edited. Click the "Edit" button or the name of the workflow instance to enter the DAG edit page. After edit, click the "Save" button to pop up the Save DAG pop-up box, as shown in the figure below. In the pop-up box, check "Whether to update to workflow definition" and save After that, the workflow definition will be updated; if it is not checked, the workflow definition will not be updated.
+     <p align="center">
+       <img src="/img/editDag-en.png" width="80%" />
+     </p>
+- **Rerun:** Re-execute the terminated process.
+- **Recovery failed:** For failed processes, you can perform recovery operations, starting from the failed node.
+- **Stop:** To **stop** the running process, the background will first `kill`worker process, and then execute `kill -9` operation
+- **Pause:** Perform a **pause** operation on the running process, the system status will change to **waiting for execution**, it will wait for the end of the task being executed, and pause the next task to be executed.
+- **Resume pause:** To resume the paused process, start running directly from the **paused node**
+- **Delete:** Delete the workflow instance and the task instance under the workflow instance
+- **Gantt chart:** The vertical axis of the Gantt chart is the topological sorting of task instances under a certain workflow instance, and the horizontal axis is the running time of the task instances, as shown in the figure:
+     <p align="center">
+         <img src="/img/gantt-en.png" width="80%" />
+     </p>
+
+#### 2.5 Task instance
+
+- Click Project Management -> Workflow -> Task Instance to enter the task instance page, as shown in the figure below, click the name of the workflow instance, you can jump to the workflow instance DAG chart to view the task status.
+     <p align="center">
+        <img src="/img/task-list-en.png" width="80%" />
+     </p>
+
+- <span id=taskLog>View log:</span>Click the "view log" button in the operation column to view the log of task execution.
+     <p align="center">
+        <img src="/img/task-log2-en.png" width="80%" />
+     </p>
+
+### 3. Resource Center
+
+#### 3.1 hdfs resource configuration
+
+- Upload resource files and udf functions, all uploaded files and resources will be stored on hdfs, so the following configuration items are required:
+
+```
+
+conf/common/common.properties
+    # Users who have permission to create directories under the HDFS root path
+    hdfs.root.user=hdfs
+    # data base dir, resource file will store to this hadoop hdfs path, self configuration, please make sure the directory exists on hdfs and have read write permissions。"/escheduler" is recommended
+    data.store2hdfs.basepath=/dolphinscheduler
+    # resource upload startup type : HDFS,S3,NONE
+    res.upload.startup.type=HDFS
+    # whether kerberos starts
+    hadoop.security.authentication.startup.state=false
+    # java.security.krb5.conf path
+    java.security.krb5.conf.path=/opt/krb5.conf
+    # loginUserFromKeytab user
+    login.user.keytab.username=hdfs-mycluster@ESZ.COM
+    # loginUserFromKeytab path
+    login.user.keytab.path=/opt/hdfs.headless.keytab
+
+conf/common/hadoop.properties
+    # ha or single namenode,If namenode ha needs to copy core-site.xml and hdfs-site.xml
+    # to the conf directory,support s3,for example : s3a://dolphinscheduler
+    fs.defaultFS=hdfs://mycluster:8020
+    #resourcemanager ha note this need ips , this empty if single
+    yarn.resourcemanager.ha.rm.ids=192.168.xx.xx,192.168.xx.xx
+    # If it is a single resourcemanager, you only need to configure one host name. If it is resourcemanager HA, the default configuration is fine
+    yarn.application.status.address=http://xxxx:8088/ws/v1/cluster/apps/%s
+
+```
+
+- Only one address needs to be configured for yarn.resourcemanager.ha.rm.ids and yarn.application.status.address, and the other address is empty.
+- You need to copy core-site.xml and hdfs-site.xml from the conf directory of the Hadoop cluster to the conf directory of the dolphinscheduler project, and restart the api-server service.
+
+#### 3.2 File management
+
+> It is the management of various resource files, including creating basic txt/log/sh/conf/py/java and other files, uploading jar packages and other types of files, and can do edit, rename, download, delete and other operations.
+
+  <p align="center">
+   <img src="/img/file-manage-en.png" width="80%" />
+ </p>
+
+- Create a file
+  > The file format supports the following types: txt, log, sh, conf, cfg, py, java, sql, xml, hql, properties
+
+<p align="center">
+   <img src="/img/file_create_en.png" width="80%" />
+ </p>
+
+- upload files
+
+> Upload file: Click the "Upload File" button to upload, drag the file to the upload area, the file name will be automatically completed with the uploaded file name
+
+<p align="center">
+   <img src="/img/file-upload-en.png" width="80%" />
+ </p>
+
+- File View
+
+> For the file types that can be viewed, click the file name to view the file details
+
+<p align="center">
+   <img src="/img/file_detail_en.png" width="80%" />
+ </p>
+
+- download file
+
+> Click the "Download" button in the file list to download the file or click the "Download" button in the upper right corner of the file details to download the file
+
+- File rename
+
+<p align="center">
+   <img src="/img/file_rename_en.png" width="80%" />
+ </p>
+
+- delete
+  > File list -> Click the "Delete" button to delete the specified file
+
+#### 3.3 UDF management
+
+#### 3.3.1 Resource management
+
+> The resource management and file management functions are similar. The difference is that the resource management is the uploaded UDF function, and the file management uploads the user program, script and configuration file.
+> Operation function: rename, download, delete.
+
+- Upload udf resources
+  > Same as uploading files.
+
+#### 3.3.2 Function management
+
+- Create UDF function
+  > Click "Create UDF Function", enter the udf function parameters, select the udf resource, and click "Submit" to create the udf function.
+
+> Currently only supports temporary UDF functions of HIVE
+
+- UDF function name: the name when the UDF function is entered
+- Package name Class name: Enter the full path of the UDF function
+- UDF resource: Set the resource file corresponding to the created UDF
+
+<p align="center">
+   <img src="/img/udf_edit_en.png" width="80%" />
+ </p>
+
+### 4. Create data source
+
+> Data source center supports MySQL, POSTGRESQL, HIVE/IMPALA, SPARK, CLICKHOUSE, ORACLE, SQLSERVER and other data sources
+
+#### 4.1 Create/Edit MySQL data source
+
+- Click "Data Source Center -> Create Data Source" to create different types of data sources according to requirements.
+
+- Data source: select MYSQL
+- Data source name: enter the name of the data source
+- Description: Enter a description of the data source
+- IP hostname: enter the IP to connect to MySQL
+- Port: Enter the port to connect to MySQL
+- Username: Set the username for connecting to MySQL
+- Password: Set the password for connecting to MySQL
+- Database name: Enter the name of the database connected to MySQL
+- Jdbc connection parameters: parameter settings for MySQL connection, filled in in JSON form
+
+<p align="center">
+   <img src="/img/mysql-en.png" width="80%" />
+ </p>
+
+> Click "Test Connection" to test whether the data source can be successfully connected.
+
+#### 4.2 Create/Edit POSTGRESQL data source
+
+- Data source: select POSTGRESQL
+- Data source name: enter the name of the data source
+- Description: Enter a description of the data source
+- IP/Host Name: Enter the IP to connect to POSTGRESQL
+- Port: Enter the port to connect to POSTGRESQL
+- Username: Set the username for connecting to POSTGRESQL
+- Password: Set the password for connecting to POSTGRESQL
+- Database name: Enter the name of the database connected to POSTGRESQL
+- Jdbc connection parameters: parameter settings for POSTGRESQL connection, filled in in JSON form
+
+<p align="center">
+   <img src="/img/postgresql-en.png" width="80%" />
+ </p>
+
+#### 4.3 Create/Edit HIVE data source
+
+1.Use HiveServer2 to connect
+
+ <p align="center">
+    <img src="/img/hive-en.png" width="80%" />
+  </p>
+
+- Data source: select HIVE
+- Data source name: enter the name of the data source
+- Description: Enter a description of the data source
+- IP/Host Name: Enter the IP connected to HIVE
+- Port: Enter the port connected to HIVE
+- Username: Set the username for connecting to HIVE
+- Password: Set the password for connecting to HIVE
+- Database name: Enter the name of the database connected to HIVE
+- Jdbc connection parameters: parameter settings for HIVE connection, filled in in JSON form
+
+  2.Use HiveServer2 HA Zookeeper to connect
+
+ <p align="center">
+    <img src="/img/hive1-en.png" width="80%" />
+  </p>
+
+Note: If you enable **kerberos**, you need to fill in **Principal**
+
+<p align="center">
+    <img src="/img/hive-en.png" width="80%" />
+  </p>
+
+#### 4.4 Create/Edit Spark data source
+
+<p align="center">
+   <img src="/img/spark-en.png" width="80%" />
+ </p>
+
+- Data source: select Spark
+- Data source name: enter the name of the data source
+- Description: Enter a description of the data source
+- IP/Hostname: Enter the IP connected to Spark
+- Port: Enter the port connected to Spark
+- Username: Set the username for connecting to Spark
+- Password: Set the password for connecting to Spark
+- Database name: Enter the name of the database connected to Spark
+- Jdbc connection parameters: parameter settings for Spark connection, filled in in JSON form
+
+### 5. Security Center (Permission System)
+
+     * Only the administrator account in the security center has the authority to operate. It has functions such as queue management, tenant management, user management, alarm group management, worker group management, token management, etc. In the user management module, resources, data sources, projects, etc. Authorization

Review comment:
       ```suggestion
        * Only the administrator account has the authority to operate security center. It has functions such as queue management, tenant management, user management, alarm group management, worker group management, token management etc. We can authorize resources, data sources, projects in the user management module.
   ```


----------------------------------------------------------------
This is an automated message from the Apache Git Service.
To respond to the message, please log on to GitHub and use the
URL above to go to the specific comment.

For queries about this service, please contact Infrastructure at:
users@infra.apache.org
[GitHub] [incubator-dolphinscheduler-website] AhahaGe commented on a change in pull request #190: [Feature][Docs] Add English version of "system-manual" to the documentation
Posted by GitBox <gi...@apache.org>.
AhahaGe commented on a change in pull request #190:
URL: https://github.com/apache/incubator-dolphinscheduler-website/pull/190#discussion_r503247641


##########
File path: docs/en-us/1.3.2/user_doc/system-manual.md
##########
@@ -0,0 +1,883 @@
+# System User Manual
+
+## Get started quickly
+
+> Please refer to [Quick Start](quick-start.html)
+
+## Operation guide
+
+### 1. Home
+
+The home page contains task status statistics, process status statistics, and workflow definition statistics for all projects of the user.
+
+<p align="center">
+<img src="/img/home_en.png" width="80%" />
+</p>
+
+### 2. Project management
+
+#### 2.1 Create project
+
+- Click "Project Management" to enter the project management page, click the "Create Project" button, enter the project name, project description, and click "Submit" to create a new project.
+
+  <p align="center">
+      <img src="/img/create_project_en1.png" width="80%" />
+  </p>
+
+#### 2.2 Project home
+
+- Click the project name link on the project management page to enter the project home page, as shown in the figure below, the project home page contains the task status statistics, process status statistics, and workflow definition statistics of the project.
+  <p align="center">
+     <img src="/img/project_home_en.png" width="80%" />
+  </p>
+
+- Task status statistics: within the specified time range, count the number of tasks in the task instance as successful submission, running, ready to pause, pause, ready to stop, stop, failure, success, fault tolerance, kill, and waiting threads
+- Process status statistics: within the specified time range, count the number of the status of the workflow instance as submission success, running, ready to pause, pause, ready to stop, stop, failure, success, fault tolerance, kill, and waiting threads
+- Workflow definition statistics: Count the workflow definitions created by users and the workflow definitions granted to this user by the administrator
+
+#### 2.3 Workflow definition
+
+#### <span id=creatDag>2.3.1 Create a workflow definition</span>
+
+- Click Project Management -> Workflow -> Workflow Definition to enter the workflow definition page, and click the "Create Workflow" button to enter the **workflow DAG edit** page, as shown in the following figure:
+  <p align="center">
+      <img src="/img/dag5.png" width="80%" />
+  </p>
+- Drag in the toolbar <img src="/img/shell.png" width="35"/> Add a Shell task to the drawing board, as shown in the figure below:
+  <p align="center">
+      <img src="/img/shell-en.png" width="80%" />
+  </p>
+- **Add parameter settings for shell tasks:**
+
+1. Fill in the "Node Name", "Description", and "Script" fields;
+2. Check “Normal” for “Run Flag”. If “Prohibit Execution” is checked, the task will not be executed when running the workflow;
+3. Select "Task Priority": When the number of worker threads is insufficient, high-level tasks will be executed first in the execution queue, and tasks with the same priority will be executed in the order of first in, first out;
+4. Timeout alarm (not required): Check the timeout alarm, timeout failure, and fill in the "timeout period". When the task execution time exceeds **timeout period**, an alert email will be sent and the task timeout fails;
+5. Resources (optional). Resource files are files created or uploaded on the Resource Center -> File Management page. For example, the file name is `test.sh`, and the command to call the resource in the script is `sh test.sh`;
+6. Custom parameters (not required), refer to [Custom Parameters](#UserDefinedParameters);
+7. Click the "Confirm Add" button to save the task settings.
+
+- **Increase the order of task execution:** Click the icon in the upper right corner <img src="/img/line.png" width="35"/> to connect the task; as shown in the figure below, task 2 and task 3 are executed in parallel, When task 1 is executed, tasks 2 and 3 will be executed simultaneously.
+
+  <p align="center">
+     <img src="/img/dag6.png" width="80%" />
+  </p>
+
+- **Delete dependencies:** Click the "arrow" icon in the upper right corner <img src="/img/arrow.png" width="35"/>, select the connection line, and click the "Delete" icon in the upper right corner <img src= "/img/delete.png" width="35"/>, delete dependencies between tasks.
+  <p align="center">
+     <img src="/img/dag7.png" width="80%" />
+  </p>
+
+- **Save workflow definition:** Click the "Save" button, and the "Set DAG chart name" pop-up box will pop up, as shown in the figure below. Enter the workflow definition name, workflow definition description, and set global parameters (optional, refer to [ Custom parameters](#UserDefinedParameters)), click the "Add" button, and the workflow definition is created successfully.
+  <p align="center">
+     <img src="/img/dag8.png" width="80%" />
+   </p>
+> For other types of tasks, please refer to [Task Node Type and Parameter Settings](#TaskParamers).
+
+#### 2.3.2 Workflow definition operation function
+
+Click Project Management -> Workflow -> Workflow Definition to enter the workflow definition page, as shown below:
+
+<p align="center">
+<img src="/img/work_list_en.png" width="80%" />
+</p>
+The operation functions of the workflow definition list are as follows:
+
+- **Edit:** Only "offline" workflow definitions can be edited. Workflow DAG editing is the same as [Create Workflow Definition](#creatDag).
+- **Online:** When the workflow status is "Offline", the workflow is online. Only the workflow in the "Online" state can run, but cannot be edited.
+- **Offline:** When the workflow status is "Online", the workflow is offline. Only the workflow in the "Offline" state can be edited, but not run.
+- **Run:** Only workflow in the online state can run. See [2.3.3 Run Workflow](#runWorkflow) for the operation steps
+- **Timing:** Timing can only be set in online workflows, and the system automatically schedules the workflow to run on a regular basis. The status after creating a timing is "offline", and the timing must be online on the timing management page to take effect. See [2.3.4 Workflow Timing](#creatTiming) for timing operation steps.
+- **Timing Management:** The timing management page can be edited, online/offline, and deleted.
+- **Delete:** Delete the workflow definition.
+- **Download:** Download workflow definition to local.
+- **Tree Diagram:** Display the task node type and task status in a tree structure, as shown in the figure below:
+  <p align="center">
+      <img src="/img/tree_en.png" width="80%" />
+  </p>
+
+#### <span id=runWorkflow>2.3.3 Run the workflow</span>
+
+- Click Project Management -> Workflow -> Workflow Definition to enter the workflow definition page, as shown in the figure below, click the "Go Online" button <img src="/img/online.png" width="35"/>,Go online workflow.
+  <p align="center">
+      <img src="/img/work_list_en.png" width="80%" />
+  </p>
+
+- Click the "Run" button to pop up the startup parameter setting pop-up box, as shown in the figure below, set the startup parameters, click the "Run" button in the pop-up box, the workflow starts running, and the workflow instance page generates a workflow instance.
+     <p align="center">
+       <img src="/img/run_work_en.png" width="80%" />
+     </p>
+  <span id=runParamers>Description of workflow operating parameters:</span>
+
+      * Failure strategy: When a task node fails to execute, other parallel task nodes need to execute the strategy. "Continue" means: after a certain task fails, other task nodes execute normally; "End" means: terminate all tasks being executed, and terminate the entire process.
+      * Notification strategy: When the process is over, the process execution information notification email is sent according to the process status, including any status is not sent, successful, failed, successful or failed.
+      * Process priority: The priority of process operation, divided into five levels: highest (HIGHEST), high (HIGH), medium (MEDIUM), low (LOW), and lowest (LOWEST). When the number of master threads is insufficient, high-level processes will be executed first in the execution queue, and processes with the same priority will be executed in a first-in first-out order.
+      * Worker group: The process can only be executed in the specified worker machine group. The default is Default, which can be executed on any worker.
+      * Notification group: select notification strategy||timeout alarm||when fault tolerance occurs, process information or email will be sent to all members in the notification group.
+      * Recipient: Select notification policy||Timeout alarm||When fault tolerance occurs, process information or alarm email will be sent to the recipient list.
+      * Cc: Select the notification strategy||Timeout alarm||When fault tolerance occurs, the process information or warning email will be copied to the CC list.
+      * Complement: Two modes including serial complement and parallel complement. Serial complement: within the specified time range, the complement is executed sequentially from the start date to the end date, and only one process instance is generated; parallel complement: within the specified time range, multiple days are complemented at the same time to generate N process instances.
+    * Complement: Execute the workflow definition of the specified date, you can select the time range of the complement (currently only supports the complement for consecutive days), for example, you need to supplement the data from September 19 to October 16, as shown in the following figure:
+    <p align="center">
+        <img src="/img/complement_en.png" width="80%" />
+    </p>
+
+  > Serial mode: The complement is executed sequentially from September 19 to October 16, and a process instance is generated on the process instance page;
+
+  > Parallel mode: The tasks from September 19 to October 16 are executed simultaneously, and 28 process instances are generated on the process instance page.
+
+#### <span id=creatTiming>2.3.4 Workflow timing</span>
+
+- Create timing: Click Project Management->Workflow->Workflow Definition, enter the workflow definition page, go online the workflow, click the "timing" button <img src="/img/timing.png" width="35"/> ,The timing parameter setting dialog box pops up, as shown in the figure below:
+  <p align="center">
+      <img src="/img/time_schedule_en.png" width="80%" />
+  </p>
+- Choose the start and end time. In the start and end time range, the workflow is run at regular intervals; not in the start and end time range, no more regular workflow instances are generated.
+- Add a timing that is executed once every day at 5 AM, as shown in the following figure:
+  <p align="center">
+      <img src="/img/timer-en.png" width="80%" />
+  </p>
+- Failure strategy, notification strategy, process priority, worker grouping, notification group, recipient, and CC are the same as [workflow running parameters](#runParamers).

Review comment:
       ```suggestion
   - worker grouping
   ```


----------------------------------------------------------------
This is an automated message from the Apache Git Service.
To respond to the message, please log on to GitHub and use the
URL above to go to the specific comment.

For queries about this service, please contact Infrastructure at:
users@infra.apache.org
[GitHub] [incubator-dolphinscheduler-website] lgcareer commented on pull request #190: [Feature][Docs] Add English version of "system-manual" to the documentation
Posted by GitBox <gi...@apache.org>.
lgcareer commented on pull request #190:
URL: https://github.com/apache/incubator-dolphinscheduler-website/pull/190#issuecomment-706829629


   @Segun-Ogundipe
   Thanks for your contribution.
   I saw the spark task node page still used chinese.Here need change to the english.
   ![Uploading image.png…]()


----------------------------------------------------------------
This is an automated message from the Apache Git Service.
To respond to the message, please log on to GitHub and use the
URL above to go to the specific comment.

For queries about this service, please contact Infrastructure at:
users@infra.apache.org
[GitHub] [incubator-dolphinscheduler-website] Segun-Ogundipe commented on pull request #190: [Feature][Docs] Add English version of "system-manual" to the documentation
Posted by GitBox <gi...@apache.org>.
Segun-Ogundipe commented on pull request #190:
URL: https://github.com/apache/incubator-dolphinscheduler-website/pull/190#issuecomment-710244880


   Hi, @CalvinKirs, the link was already added to site_config/docs1.3.2.js. That's why I didn't edit the file. I checked the link on the official website after the merge and it's working. Please let me know if am missing anything.


----------------------------------------------------------------
This is an automated message from the Apache Git Service.
To respond to the message, please log on to GitHub and use the
URL above to go to the specific comment.

For queries about this service, please contact Infrastructure at:
users@infra.apache.org
[GitHub] [incubator-dolphinscheduler-website] Segun-Ogundipe commented on pull request #190: [Feature][Docs] Add English version of "system-manual" to the documentation
Posted by GitBox <gi...@apache.org>.
Segun-Ogundipe commented on pull request #190:
URL: https://github.com/apache/incubator-dolphinscheduler-website/pull/190#issuecomment-707760024


   > @Segun-Ogundipe If u think need not to edit, please feel free to comment out.

   Hi @AhahaGe, the edits make it clearer


----------------------------------------------------------------
This is an automated message from the Apache Git Service.
To respond to the message, please log on to GitHub and use the
URL above to go to the specific comment.

For queries about this service, please contact Infrastructure at:
users@infra.apache.org
[GitHub] [incubator-dolphinscheduler-website] AhahaGe commented on a change in pull request #190: [Feature][Docs] Add English version of "system-manual" to the documentation
Posted by GitBox <gi...@apache.org>.
AhahaGe commented on a change in pull request #190:
URL: https://github.com/apache/incubator-dolphinscheduler-website/pull/190#discussion_r503230425


##########
File path: docs/en-us/1.3.2/user_doc/system-manual.md
##########
@@ -0,0 +1,883 @@
+# System User Manual
+
+## Get started quickly
+
+> Please refer to [Quick Start](quick-start.html)
+
+## Operation guide
+
+### 1. Home
+
+The home page contains task status statistics, process status statistics, and workflow definition statistics for all projects of the user.
+
+<p align="center">
+<img src="/img/home_en.png" width="80%" />
+</p>
+
+### 2. Project management
+
+#### 2.1 Create project
+
+- Click "Project Management" to enter the project management page, click the "Create Project" button, enter the project name, project description, and click "Submit" to create a new project.
+
+  <p align="center">
+      <img src="/img/create_project_en1.png" width="80%" />
+  </p>
+
+#### 2.2 Project home
+
+- Click the project name link on the project management page to enter the project home page, as shown in the figure below, the project home page contains the task status statistics, process status statistics, and workflow definition statistics of the project.
+  <p align="center">
+     <img src="/img/project_home_en.png" width="80%" />
+  </p>
+
+- Task status statistics: within the specified time range, count the number of tasks in the task instance as successful submission, running, ready to pause, pause, ready to stop, stop, failure, success, fault tolerance, kill, and waiting threads
+- Process status statistics: within the specified time range, count the number of the status of the workflow instance as submission success, running, ready to pause, pause, ready to stop, stop, failure, success, fault tolerance, kill, and waiting threads
+- Workflow definition statistics: Count the workflow definitions created by users and the workflow definitions granted to this user by the administrator
+
+#### 2.3 Workflow definition
+
+#### <span id=creatDag>2.3.1 Create a workflow definition</span>
+
+- Click Project Management -> Workflow -> Workflow Definition to enter the workflow definition page, and click the "Create Workflow" button to enter the **workflow DAG edit** page, as shown in the following figure:
+  <p align="center">
+      <img src="/img/dag5.png" width="80%" />
+  </p>
+- Drag in the toolbar <img src="/img/shell.png" width="35"/> Add a Shell task to the drawing board, as shown in the figure below:
+  <p align="center">
+      <img src="/img/shell-en.png" width="80%" />
+  </p>
+- **Add parameter settings for shell tasks:**
+
+1. Fill in the "Node Name", "Description", and "Script" fields;
+2. Check “Normal” for “Run Flag”. If “Prohibit Execution” is checked, the task will not be executed when running the workflow;

Review comment:
       when run the workflow


----------------------------------------------------------------
This is an automated message from the Apache Git Service.
To respond to the message, please log on to GitHub and use the
URL above to go to the specific comment.

For queries about this service, please contact Infrastructure at:
users@infra.apache.org
[GitHub] [incubator-dolphinscheduler-website] AhahaGe commented on a change in pull request #190: [Feature][Docs] Add English version of "system-manual" to the documentation
Posted by GitBox <gi...@apache.org>.
AhahaGe commented on a change in pull request #190:
URL: https://github.com/apache/incubator-dolphinscheduler-website/pull/190#discussion_r503225427


##########
File path: docs/en-us/1.3.2/user_doc/system-manual.md
##########
@@ -0,0 +1,883 @@
+# System User Manual
+
+## Get started quickly
+
+> Please refer to [Quick Start](quick-start.html)
+
+## Operation guide
+
+### 1. Home
+
+The home page contains task status statistics, process status statistics, and workflow definition statistics for all projects of the user.
+
+<p align="center">
+<img src="/img/home_en.png" width="80%" />
+</p>
+
+### 2. Project management
+
+#### 2.1 Create project
+
+- Click "Project Management" to enter the project management page, click the "Create Project" button, enter the project name, project description, and click "Submit" to create a new project.
+
+  <p align="center">
+      <img src="/img/create_project_en1.png" width="80%" />
+  </p>
+
+#### 2.2 Project home
+
+- Click the project name link on the project management page to enter the project home page, as shown in the figure below, the project home page contains the task status statistics, process status statistics, and workflow definition statistics of the project.
+  <p align="center">
+     <img src="/img/project_home_en.png" width="80%" />
+  </p>
+
+- Task status statistics: within the specified time range, count the number of tasks in the task instance as successful submission, running, ready to pause, pause, ready to stop, stop, failure, success, fault tolerance, kill, and waiting threads

Review comment:
       Please keep task status count translate the same with work flow count translate.


----------------------------------------------------------------
This is an automated message from the Apache Git Service.
To respond to the message, please log on to GitHub and use the
URL above to go to the specific comment.

For queries about this service, please contact Infrastructure at:
users@infra.apache.org
[GitHub] [incubator-dolphinscheduler-website] AhahaGe commented on a change in pull request #190: [Feature][Docs] Add English version of "system-manual" to the documentation
Posted by GitBox <gi...@apache.org>.
AhahaGe commented on a change in pull request #190:
URL: https://github.com/apache/incubator-dolphinscheduler-website/pull/190#discussion_r503238613


##########
File path: docs/en-us/1.3.2/user_doc/system-manual.md
##########
@@ -0,0 +1,883 @@
+# System User Manual
+
+## Get started quickly
+
+> Please refer to [Quick Start](quick-start.html)
+
+## Operation guide
+
+### 1. Home
+
+The home page contains task status statistics, process status statistics, and workflow definition statistics for all projects of the user.
+
+<p align="center">
+<img src="/img/home_en.png" width="80%" />
+</p>
+
+### 2. Project management
+
+#### 2.1 Create project
+
+- Click "Project Management" to enter the project management page, click the "Create Project" button, enter the project name, project description, and click "Submit" to create a new project.
+
+  <p align="center">
+      <img src="/img/create_project_en1.png" width="80%" />
+  </p>
+
+#### 2.2 Project home
+
+- Click the project name link on the project management page to enter the project home page, as shown in the figure below, the project home page contains the task status statistics, process status statistics, and workflow definition statistics of the project.
+  <p align="center">
+     <img src="/img/project_home_en.png" width="80%" />
+  </p>
+
+- Task status statistics: within the specified time range, count the number of tasks in the task instance as successful submission, running, ready to pause, pause, ready to stop, stop, failure, success, fault tolerance, kill, and waiting threads
+- Process status statistics: within the specified time range, count the number of the status of the workflow instance as submission success, running, ready to pause, pause, ready to stop, stop, failure, success, fault tolerance, kill, and waiting threads
+- Workflow definition statistics: Count the workflow definitions created by users and the workflow definitions granted to this user by the administrator
+
+#### 2.3 Workflow definition
+
+#### <span id=creatDag>2.3.1 Create a workflow definition</span>
+
+- Click Project Management -> Workflow -> Workflow Definition to enter the workflow definition page, and click the "Create Workflow" button to enter the **workflow DAG edit** page, as shown in the following figure:
+  <p align="center">
+      <img src="/img/dag5.png" width="80%" />
+  </p>
+- Drag in the toolbar <img src="/img/shell.png" width="35"/> Add a Shell task to the drawing board, as shown in the figure below:
+  <p align="center">
+      <img src="/img/shell-en.png" width="80%" />
+  </p>
+- **Add parameter settings for shell tasks:**
+
+1. Fill in the "Node Name", "Description", and "Script" fields;
+2. Check “Normal” for “Run Flag”. If “Prohibit Execution” is checked, the task will not be executed when running the workflow;
+3. Select "Task Priority": When the number of worker threads is insufficient, high-level tasks will be executed first in the execution queue, and tasks with the same priority will be executed in the order of first in, first out;
+4. Timeout alarm (not required): Check the timeout alarm, timeout failure, and fill in the "timeout period". When the task execution time exceeds **timeout period**, an alert email will be sent and the task timeout fails;
+5. Resources (optional). Resource files are files created or uploaded on the Resource Center -> File Management page. For example, the file name is `test.sh`, and the command to call the resource in the script is `sh test.sh`;
+6. Custom parameters (not required), refer to [Custom Parameters](#UserDefinedParameters);
+7. Click the "Confirm Add" button to save the task settings.
+
+- **Increase the order of task execution:** Click the icon in the upper right corner <img src="/img/line.png" width="35"/> to connect the task; as shown in the figure below, task 2 and task 3 are executed in parallel, When task 1 is executed, tasks 2 and 3 will be executed simultaneously.
+
+  <p align="center">
+     <img src="/img/dag6.png" width="80%" />
+  </p>
+
+- **Delete dependencies:** Click the "arrow" icon in the upper right corner <img src="/img/arrow.png" width="35"/>, select the connection line, and click the "Delete" icon in the upper right corner <img src= "/img/delete.png" width="35"/>, delete dependencies between tasks.
+  <p align="center">
+     <img src="/img/dag7.png" width="80%" />
+  </p>
+
+- **Save workflow definition:** Click the "Save" button, and the "Set DAG chart name" pop-up box will pop up, as shown in the figure below. Enter the workflow definition name, workflow definition description, and set global parameters (optional, refer to [ Custom parameters](#UserDefinedParameters)), click the "Add" button, and the workflow definition is created successfully.
+  <p align="center">
+     <img src="/img/dag8.png" width="80%" />
+   </p>
+> For other types of tasks, please refer to [Task Node Type and Parameter Settings](#TaskParamers).
+
+#### 2.3.2 Workflow definition operation function
+
+Click Project Management -> Workflow -> Workflow Definition to enter the workflow definition page, as shown below:
+
+<p align="center">
+<img src="/img/work_list_en.png" width="80%" />
+</p>
+The operation functions of the workflow definition list are as follows:
+
+- **Edit:** Only "offline" workflow definitions can be edited. Workflow DAG editing is the same as [Create Workflow Definition](#creatDag).
+- **Online:** When the workflow status is "Offline", the workflow is online. Only the workflow in the "Online" state can run, but cannot be edited.
+- **Offline:** When the workflow status is "Online", the workflow is offline. Only the workflow in the "Offline" state can be edited, but not run.
+- **Run:** Only workflow in the online state can run. See [2.3.3 Run Workflow](#runWorkflow) for the operation steps
+- **Timing:** Timing can only be set in online workflows, and the system automatically schedules the workflow to run on a regular basis. The status after creating a timing is "offline", and the timing must be online on the timing management page to take effect. See [2.3.4 Workflow Timing](#creatTiming) for timing operation steps.
+- **Timing Management:** The timing management page can be edited, online/offline, and deleted.
+- **Delete:** Delete the workflow definition.
+- **Download:** Download workflow definition to local.
+- **Tree Diagram:** Display the task node type and task status in a tree structure, as shown in the figure below:
+  <p align="center">
+      <img src="/img/tree_en.png" width="80%" />
+  </p>
+
+#### <span id=runWorkflow>2.3.3 Run the workflow</span>
+
+- Click Project Management -> Workflow -> Workflow Definition to enter the workflow definition page, as shown in the figure below, click the "Go Online" button <img src="/img/online.png" width="35"/>,Go online workflow.

Review comment:
       Go online workflow -> to online workflow


----------------------------------------------------------------
This is an automated message from the Apache Git Service.
To respond to the message, please log on to GitHub and use the
URL above to go to the specific comment.

For queries about this service, please contact Infrastructure at:
users@infra.apache.org
[GitHub] [incubator-dolphinscheduler-website] AhahaGe commented on a change in pull request #190: [Feature][Docs] Add English version of "system-manual" to the documentation
Posted by GitBox <gi...@apache.org>.
AhahaGe commented on a change in pull request #190:
URL: https://github.com/apache/incubator-dolphinscheduler-website/pull/190#discussion_r503228141


##########
File path: docs/en-us/1.3.2/user_doc/system-manual.md
##########
@@ -0,0 +1,883 @@
+# System User Manual
+
+## Get started quickly
+
+> Please refer to [Quick Start](quick-start.html)
+
+## Operation guide
+
+### 1. Home
+
+The home page contains task status statistics, process status statistics, and workflow definition statistics for all projects of the user.
+
+<p align="center">
+<img src="/img/home_en.png" width="80%" />
+</p>
+
+### 2. Project management
+
+#### 2.1 Create project
+
+- Click "Project Management" to enter the project management page, click the "Create Project" button, enter the project name, project description, and click "Submit" to create a new project.
+
+  <p align="center">
+      <img src="/img/create_project_en1.png" width="80%" />
+  </p>
+
+#### 2.2 Project home
+
+- Click the project name link on the project management page to enter the project home page, as shown in the figure below, the project home page contains the task status statistics, process status statistics, and workflow definition statistics of the project.
+  <p align="center">
+     <img src="/img/project_home_en.png" width="80%" />
+  </p>
+
+- Task status statistics: within the specified time range, count the number of tasks in the task instance as successful submission, running, ready to pause, pause, ready to stop, stop, failure, success, fault tolerance, kill, and waiting threads
+- Process status statistics: within the specified time range, count the number of the status of the workflow instance as submission success, running, ready to pause, pause, ready to stop, stop, failure, success, fault tolerance, kill, and waiting threads
+- Workflow definition statistics: Count the workflow definitions created by users and the workflow definitions granted to this user by the administrator
+
+#### 2.3 Workflow definition
+
+#### <span id=creatDag>2.3.1 Create a workflow definition</span>

Review comment:
       ```suggestion
   #### <span id=creatDag>2.3.1 Create workflow definition</span>
   ```


----------------------------------------------------------------
This is an automated message from the Apache Git Service.
To respond to the message, please log on to GitHub and use the
URL above to go to the specific comment.

For queries about this service, please contact Infrastructure at:
users@infra.apache.org
[GitHub] [incubator-dolphinscheduler-website] AhahaGe commented on a change in pull request #190: [Feature][Docs] Add English version of "system-manual" to the documentation
Posted by GitBox <gi...@apache.org>.
AhahaGe commented on a change in pull request #190:
URL: https://github.com/apache/incubator-dolphinscheduler-website/pull/190#discussion_r503251900


##########
File path: docs/en-us/1.3.2/user_doc/system-manual.md
##########
@@ -0,0 +1,883 @@
+# System User Manual
+
+## Get started quickly
+
+> Please refer to [Quick Start](quick-start.html)
+
+## Operation guide
+
+### 1. Home
+
+The home page contains task status statistics, process status statistics, and workflow definition statistics for all projects of the user.
+
+<p align="center">
+<img src="/img/home_en.png" width="80%" />
+</p>
+
+### 2. Project management
+
+#### 2.1 Create project
+
+- Click "Project Management" to enter the project management page, click the "Create Project" button, enter the project name, project description, and click "Submit" to create a new project.
+
+  <p align="center">
+      <img src="/img/create_project_en1.png" width="80%" />
+  </p>
+
+#### 2.2 Project home
+
+- Click the project name link on the project management page to enter the project home page, as shown in the figure below, the project home page contains the task status statistics, process status statistics, and workflow definition statistics of the project.
+  <p align="center">
+     <img src="/img/project_home_en.png" width="80%" />
+  </p>
+
+- Task status statistics: within the specified time range, count the number of tasks in the task instance as successful submission, running, ready to pause, pause, ready to stop, stop, failure, success, fault tolerance, kill, and waiting threads
+- Process status statistics: within the specified time range, count the number of the status of the workflow instance as submission success, running, ready to pause, pause, ready to stop, stop, failure, success, fault tolerance, kill, and waiting threads
+- Workflow definition statistics: Count the workflow definitions created by users and the workflow definitions granted to this user by the administrator
+
+#### 2.3 Workflow definition
+
+#### <span id=creatDag>2.3.1 Create a workflow definition</span>
+
+- Click Project Management -> Workflow -> Workflow Definition to enter the workflow definition page, and click the "Create Workflow" button to enter the **workflow DAG edit** page, as shown in the following figure:
+  <p align="center">
+      <img src="/img/dag5.png" width="80%" />
+  </p>
+- Drag in the toolbar <img src="/img/shell.png" width="35"/> Add a Shell task to the drawing board, as shown in the figure below:
+  <p align="center">
+      <img src="/img/shell-en.png" width="80%" />
+  </p>
+- **Add parameter settings for shell tasks:**
+
+1. Fill in the "Node Name", "Description", and "Script" fields;
+2. Check “Normal” for “Run Flag”. If “Prohibit Execution” is checked, the task will not be executed when running the workflow;
+3. Select "Task Priority": When the number of worker threads is insufficient, high-level tasks will be executed first in the execution queue, and tasks with the same priority will be executed in the order of first in, first out;
+4. Timeout alarm (not required): Check the timeout alarm, timeout failure, and fill in the "timeout period". When the task execution time exceeds **timeout period**, an alert email will be sent and the task timeout fails;
+5. Resources (optional). Resource files are files created or uploaded on the Resource Center -> File Management page. For example, the file name is `test.sh`, and the command to call the resource in the script is `sh test.sh`;
+6. Custom parameters (not required), refer to [Custom Parameters](#UserDefinedParameters);

Review comment:
       ```suggestion
   6. Custom parameters (optional), refer to [Custom Parameters](#UserDefinedParameters);
   ```

##########
File path: docs/en-us/1.3.2/user_doc/system-manual.md
##########
@@ -0,0 +1,883 @@
+# System User Manual
+
+## Get started quickly
+
+> Please refer to [Quick Start](quick-start.html)
+
+## Operation guide
+
+### 1. Home
+
+The home page contains task status statistics, process status statistics, and workflow definition statistics for all projects of the user.
+
+<p align="center">
+<img src="/img/home_en.png" width="80%" />
+</p>
+
+### 2. Project management
+
+#### 2.1 Create project
+
+- Click "Project Management" to enter the project management page, click the "Create Project" button, enter the project name, project description, and click "Submit" to create a new project.
+
+  <p align="center">
+      <img src="/img/create_project_en1.png" width="80%" />
+  </p>
+
+#### 2.2 Project home
+
+- Click the project name link on the project management page to enter the project home page, as shown in the figure below, the project home page contains the task status statistics, process status statistics, and workflow definition statistics of the project.
+  <p align="center">
+     <img src="/img/project_home_en.png" width="80%" />
+  </p>
+
+- Task status statistics: within the specified time range, count the number of tasks in the task instance as successful submission, running, ready to pause, pause, ready to stop, stop, failure, success, fault tolerance, kill, and waiting threads
+- Process status statistics: within the specified time range, count the number of the status of the workflow instance as submission success, running, ready to pause, pause, ready to stop, stop, failure, success, fault tolerance, kill, and waiting threads
+- Workflow definition statistics: Count the workflow definitions created by users and the workflow definitions granted to this user by the administrator
+
+#### 2.3 Workflow definition
+
+#### <span id=creatDag>2.3.1 Create a workflow definition</span>
+
+- Click Project Management -> Workflow -> Workflow Definition to enter the workflow definition page, and click the "Create Workflow" button to enter the **workflow DAG edit** page, as shown in the following figure:
+  <p align="center">
+      <img src="/img/dag5.png" width="80%" />
+  </p>
+- Drag in the toolbar <img src="/img/shell.png" width="35"/> Add a Shell task to the drawing board, as shown in the figure below:
+  <p align="center">
+      <img src="/img/shell-en.png" width="80%" />
+  </p>
+- **Add parameter settings for shell tasks:**
+
+1. Fill in the "Node Name", "Description", and "Script" fields;
+2. Check “Normal” for “Run Flag”. If “Prohibit Execution” is checked, the task will not be executed when running the workflow;
+3. Select "Task Priority": When the number of worker threads is insufficient, high-level tasks will be executed first in the execution queue, and tasks with the same priority will be executed in the order of first in, first out;
+4. Timeout alarm (not required): Check the timeout alarm, timeout failure, and fill in the "timeout period". When the task execution time exceeds **timeout period**, an alert email will be sent and the task timeout fails;

Review comment:
       ```suggestion
   4. Timeout alarm (optional): Check the timeout alarm, timeout failure, and fill in the "timeout period". When the task execution time exceeds **timeout period**, an alert email will be sent and the task timeout fails;
   ```

##########
File path: docs/en-us/1.3.2/user_doc/system-manual.md
##########
@@ -0,0 +1,883 @@
+# System User Manual
+
+## Get started quickly
+
+> Please refer to [Quick Start](quick-start.html)
+
+## Operation guide
+
+### 1. Home
+
+The home page contains task status statistics, process status statistics, and workflow definition statistics for all projects of the user.
+
+<p align="center">
+<img src="/img/home_en.png" width="80%" />
+</p>
+
+### 2. Project management
+
+#### 2.1 Create project
+
+- Click "Project Management" to enter the project management page, click the "Create Project" button, enter the project name, project description, and click "Submit" to create a new project.
+
+  <p align="center">
+      <img src="/img/create_project_en1.png" width="80%" />
+  </p>
+
+#### 2.2 Project home
+
+- Click the project name link on the project management page to enter the project home page, as shown in the figure below, the project home page contains the task status statistics, process status statistics, and workflow definition statistics of the project.
+  <p align="center">
+     <img src="/img/project_home_en.png" width="80%" />
+  </p>
+
+- Task status statistics: within the specified time range, count the number of tasks in the task instance as successful submission, running, ready to pause, pause, ready to stop, stop, failure, success, fault tolerance, kill, and waiting threads
+- Process status statistics: within the specified time range, count the number of the status of the workflow instance as submission success, running, ready to pause, pause, ready to stop, stop, failure, success, fault tolerance, kill, and waiting threads
+- Workflow definition statistics: Count the workflow definitions created by users and the workflow definitions granted to this user by the administrator
+
+#### 2.3 Workflow definition
+
+#### <span id=creatDag>2.3.1 Create a workflow definition</span>
+
+- Click Project Management -> Workflow -> Workflow Definition to enter the workflow definition page, and click the "Create Workflow" button to enter the **workflow DAG edit** page, as shown in the following figure:
+  <p align="center">
+      <img src="/img/dag5.png" width="80%" />
+  </p>
+- Drag in the toolbar <img src="/img/shell.png" width="35"/> Add a Shell task to the drawing board, as shown in the figure below:
+  <p align="center">
+      <img src="/img/shell-en.png" width="80%" />
+  </p>
+- **Add parameter settings for shell tasks:**
+
+1. Fill in the "Node Name", "Description", and "Script" fields;
+2. Check “Normal” for “Run Flag”. If “Prohibit Execution” is checked, the task will not be executed when running the workflow;
+3. Select "Task Priority": When the number of worker threads is insufficient, high-level tasks will be executed first in the execution queue, and tasks with the same priority will be executed in the order of first in, first out;
+4. Timeout alarm (not required): Check the timeout alarm, timeout failure, and fill in the "timeout period". When the task execution time exceeds **timeout period**, an alert email will be sent and the task timeout fails;
+5. Resources (optional). Resource files are files created or uploaded on the Resource Center -> File Management page. For example, the file name is `test.sh`, and the command to call the resource in the script is `sh test.sh`;
+6. Custom parameters (not required), refer to [Custom Parameters](#UserDefinedParameters);

Review comment:
       ```suggestion
   6. Custom parameters (optional), refer to [Custom Parameters](#UserDefinedParameters);
   ```


----------------------------------------------------------------
This is an automated message from the Apache Git Service.
To respond to the message, please log on to GitHub and use the
URL above to go to the specific comment.

For queries about this service, please contact Infrastructure at:
users@infra.apache.org
[GitHub] [incubator-dolphinscheduler-website] AhahaGe commented on a change in pull request #190: [Feature][Docs] Add English version of "system-manual" to the documentation
Posted by GitBox <gi...@apache.org>.
AhahaGe commented on a change in pull request #190:
URL: https://github.com/apache/incubator-dolphinscheduler-website/pull/190#discussion_r503232849


##########
File path: docs/en-us/1.3.2/user_doc/system-manual.md
##########
@@ -0,0 +1,883 @@
+# System User Manual
+
+## Get started quickly
+
+> Please refer to [Quick Start](quick-start.html)
+
+## Operation guide
+
+### 1. Home
+
+The home page contains task status statistics, process status statistics, and workflow definition statistics for all projects of the user.
+
+<p align="center">
+<img src="/img/home_en.png" width="80%" />
+</p>
+
+### 2. Project management
+
+#### 2.1 Create project
+
+- Click "Project Management" to enter the project management page, click the "Create Project" button, enter the project name, project description, and click "Submit" to create a new project.
+
+  <p align="center">
+      <img src="/img/create_project_en1.png" width="80%" />
+  </p>
+
+#### 2.2 Project home
+
+- Click the project name link on the project management page to enter the project home page, as shown in the figure below, the project home page contains the task status statistics, process status statistics, and workflow definition statistics of the project.
+  <p align="center">
+     <img src="/img/project_home_en.png" width="80%" />
+  </p>
+
+- Task status statistics: within the specified time range, count the number of tasks in the task instance as successful submission, running, ready to pause, pause, ready to stop, stop, failure, success, fault tolerance, kill, and waiting threads
+- Process status statistics: within the specified time range, count the number of the status of the workflow instance as submission success, running, ready to pause, pause, ready to stop, stop, failure, success, fault tolerance, kill, and waiting threads
+- Workflow definition statistics: Count the workflow definitions created by users and the workflow definitions granted to this user by the administrator
+
+#### 2.3 Workflow definition
+
+#### <span id=creatDag>2.3.1 Create a workflow definition</span>
+
+- Click Project Management -> Workflow -> Workflow Definition to enter the workflow definition page, and click the "Create Workflow" button to enter the **workflow DAG edit** page, as shown in the following figure:
+  <p align="center">
+      <img src="/img/dag5.png" width="80%" />
+  </p>
+- Drag in the toolbar <img src="/img/shell.png" width="35"/> Add a Shell task to the drawing board, as shown in the figure below:
+  <p align="center">
+      <img src="/img/shell-en.png" width="80%" />
+  </p>
+- **Add parameter settings for shell tasks:**
+
+1. Fill in the "Node Name", "Description", and "Script" fields;
+2. Check “Normal” for “Run Flag”. If “Prohibit Execution” is checked, the task will not be executed when running the workflow;
+3. Select "Task Priority": When the number of worker threads is insufficient, high-level tasks will be executed first in the execution queue, and tasks with the same priority will be executed in the order of first in, first out;
+4. Timeout alarm (not required): Check the timeout alarm, timeout failure, and fill in the "timeout period". When the task execution time exceeds **timeout period**, an alert email will be sent and the task timeout fails;
+5. Resources (optional). Resource files are files created or uploaded on the Resource Center -> File Management page. For example, the file name is `test.sh`, and the command to call the resource in the script is `sh test.sh`;
+6. Custom parameters (not required), refer to [Custom Parameters](#UserDefinedParameters);

Review comment:
       ```suggestion
   6. Custom parameters (optional), refer to [Custom Parameters](#UserDefinedParameters);
   ```


----------------------------------------------------------------
This is an automated message from the Apache Git Service.
To respond to the message, please log on to GitHub and use the
URL above to go to the specific comment.

For queries about this service, please contact Infrastructure at:
users@infra.apache.org
[GitHub] [incubator-dolphinscheduler-website] AhahaGe commented on a change in pull request #190: [Feature][Docs] Add English version of "system-manual" to the documentation
Posted by GitBox <gi...@apache.org>.
AhahaGe commented on a change in pull request #190:
URL: https://github.com/apache/incubator-dolphinscheduler-website/pull/190#discussion_r503230425


##########
File path: docs/en-us/1.3.2/user_doc/system-manual.md
##########
@@ -0,0 +1,883 @@
+# System User Manual
+
+## Get started quickly
+
+> Please refer to [Quick Start](quick-start.html)
+
+## Operation guide
+
+### 1. Home
+
+The home page contains task status statistics, process status statistics, and workflow definition statistics for all projects of the user.
+
+<p align="center">
+<img src="/img/home_en.png" width="80%" />
+</p>
+
+### 2. Project management
+
+#### 2.1 Create project
+
+- Click "Project Management" to enter the project management page, click the "Create Project" button, enter the project name, project description, and click "Submit" to create a new project.
+
+  <p align="center">
+      <img src="/img/create_project_en1.png" width="80%" />
+  </p>
+
+#### 2.2 Project home
+
+- Click the project name link on the project management page to enter the project home page, as shown in the figure below, the project home page contains the task status statistics, process status statistics, and workflow definition statistics of the project.
+  <p align="center">
+     <img src="/img/project_home_en.png" width="80%" />
+  </p>
+
+- Task status statistics: within the specified time range, count the number of tasks in the task instance as successful submission, running, ready to pause, pause, ready to stop, stop, failure, success, fault tolerance, kill, and waiting threads
+- Process status statistics: within the specified time range, count the number of the status of the workflow instance as submission success, running, ready to pause, pause, ready to stop, stop, failure, success, fault tolerance, kill, and waiting threads
+- Workflow definition statistics: Count the workflow definitions created by users and the workflow definitions granted to this user by the administrator
+
+#### 2.3 Workflow definition
+
+#### <span id=creatDag>2.3.1 Create a workflow definition</span>
+
+- Click Project Management -> Workflow -> Workflow Definition to enter the workflow definition page, and click the "Create Workflow" button to enter the **workflow DAG edit** page, as shown in the following figure:
+  <p align="center">
+      <img src="/img/dag5.png" width="80%" />
+  </p>
+- Drag in the toolbar <img src="/img/shell.png" width="35"/> Add a Shell task to the drawing board, as shown in the figure below:
+  <p align="center">
+      <img src="/img/shell-en.png" width="80%" />
+  </p>
+- **Add parameter settings for shell tasks:**
+
+1. Fill in the "Node Name", "Description", and "Script" fields;
+2. Check “Normal” for “Run Flag”. If “Prohibit Execution” is checked, the task will not be executed when running the workflow;

Review comment:
       ```suggestion
   2. Check “Normal” for “Run Flag”. If “Prohibit Execution” is checked, the task will not be executed when the workflow runs;
   ```


----------------------------------------------------------------
This is an automated message from the Apache Git Service.
To respond to the message, please log on to GitHub and use the
URL above to go to the specific comment.

For queries about this service, please contact Infrastructure at:
users@infra.apache.org
[GitHub] [incubator-dolphinscheduler-website] Segun-Ogundipe commented on pull request #190: [Feature][Docs] Add English version of "system-manual" to the documentation
Posted by GitBox <gi...@apache.org>.
Segun-Ogundipe commented on pull request #190:
URL: https://github.com/apache/incubator-dolphinscheduler-website/pull/190#issuecomment-707765562


   Hi @AhahaGe, I have updated the PR with the changes you suggested. Please check


----------------------------------------------------------------
This is an automated message from the Apache Git Service.
To respond to the message, please log on to GitHub and use the
URL above to go to the specific comment.

For queries about this service, please contact Infrastructure at:
users@infra.apache.org