You are viewing a plain text version of this content. The canonical link for it is here.
Posted to dev@echarts.apache.org by GitBox <gi...@apache.org> on 2019/04/12 11:47:44 UTC
[GitHub] [incubator-echarts] prathapjayaraj opened a new issue #10279: how
to show grid inside chart cell as like high chart
prathapjayaraj opened a new issue #10279: how to show grid inside chart cell as like high chart
URL: https://github.com/apache/incubator-echarts/issues/10279
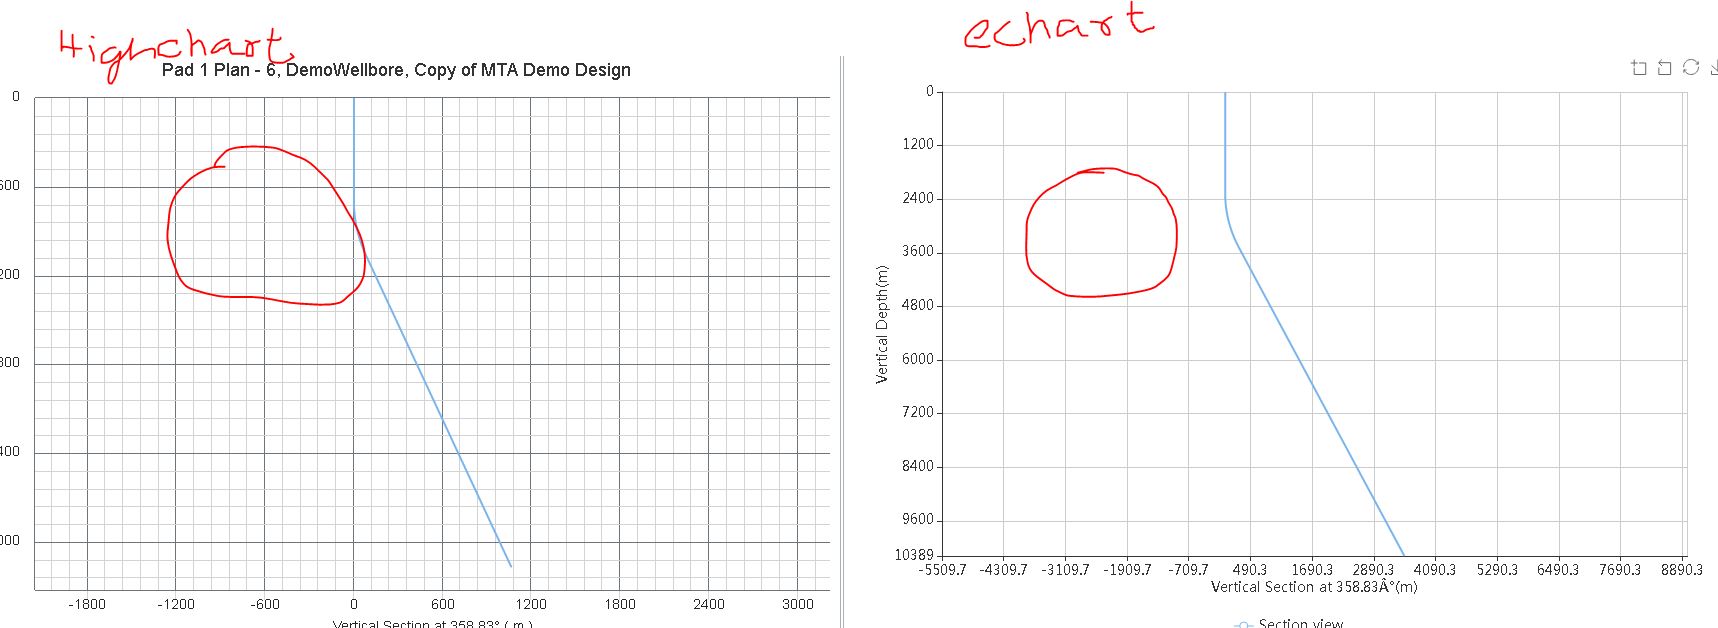
I want to generated grid inside the grid cell in the echart component as like highchart. I have attached the image of the both highchart and echart components.
### Version
4.2.1
### Steps to reproduce
create any component in echart and split the x and y axis with 10 split number
### What is expected?
I want to show the grid inside the chart cell
### What is actually happening?
grid is not showing
<!-- This issue is generated by echarts-issue-helper. DO NOT REMOVE -->
<!-- This issue is in English. DO NOT REMOVE -->
----------------------------------------------------------------
This is an automated message from the Apache Git Service.
To respond to the message, please log on to GitHub and use the
URL above to go to the specific comment.
For queries about this service, please contact Infrastructure at:
users@infra.apache.org
With regards,
Apache Git Services
---------------------------------------------------------------------
To unsubscribe, e-mail: dev-unsubscribe@echarts.apache.org
For additional commands, e-mail: dev-help@echarts.apache.org