You are viewing a plain text version of this content. The canonical link for it is here.
Posted to dev@echarts.apache.org by GitBox <gi...@apache.org> on 2018/05/12 09:24:58 UTC
[GitHub] cn-xufei opened a new issue #8329: 雷达图的指示器文本配置
cn-xufei opened a new issue #8329: 雷达图的指示器文本配置
URL: https://github.com/apache/incubator-echarts/issues/8329
<!--
为了方便我们能够复现和修复 bug,请遵从下面的规范描述您的问题。
-->
### One-line summary [问题简述]
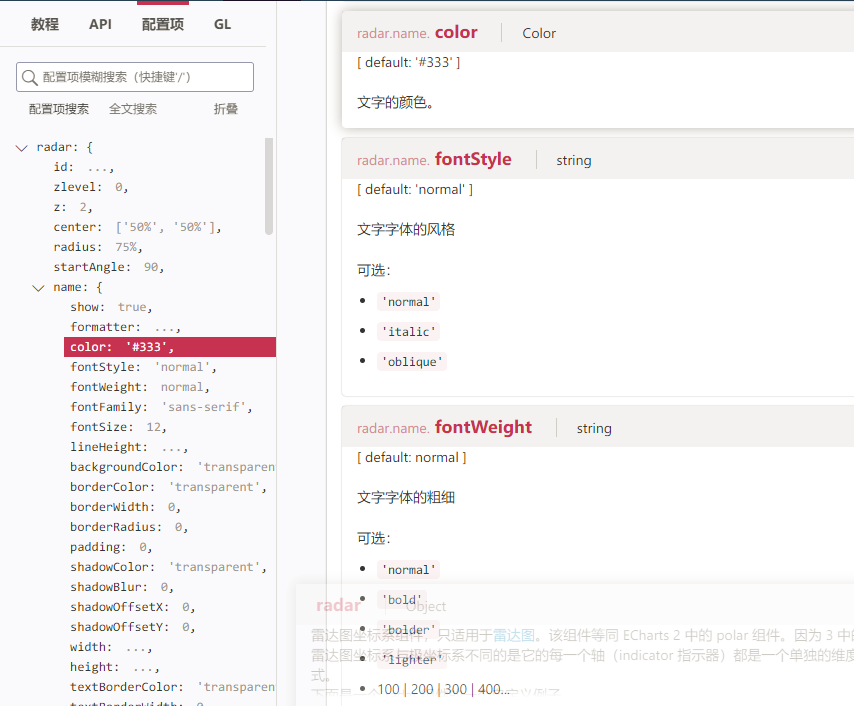
官网上的雷达图的文本配置是:radar.name.color
然而实际生效的是radar.name.textStyle.color
需要加一层textStyle
### Version & Environment [版本及环境]
+ ECharts version [ECharts 版本]: 4.1.0
+ Browser version [浏览器类型和版本]: Chrome 66
+ OS Version [操作系统类型和版本] :win 10
### Expected behaviour [期望结果]
希望可以按官网配置项那样,直接在name对象中对文本的颜色字体大小等进行配置
### ECharts option [ECharts配置项]
<!-- Copy and paste your 'echarts option' here. -->
<!-- [下方贴你的option,注意不要删掉下方 ```javascript 和 尾部的 ``` 字样。最好是我们能够直接运行的 option。如何得到能运行的 option 参见上方的 guidelines for contributing] -->
```javascript
option = {
title: {
text: '自定义雷达图'
},
legend: {
data: ['图一','图二', '张三', '李四']
},
radar: [
{
indicator: [
{ text: '指标一' },
{ text: '指标二' },
{ text: '指标三' },
{ text: '指标四' },
{ text: '指标五' }
],
center: ['25%', '50%'],
radius: 120,
startAngle: 90,
splitNumber: 4,
shape: 'circle',
name: {
color: 'red',
formatter:'【{value}】',
textStyle: {
color:'#72ACD1'
}
},
splitArea: {
areaStyle: {
color: ['rgba(114, 172, 209, 0.2)',
'rgba(114, 172, 209, 0.4)', 'rgba(114, 172, 209, 0.6)',
'rgba(114, 172, 209, 0.8)', 'rgba(114, 172, 209, 1)'],
shadowColor: 'rgba(0, 0, 0, 0.3)',
shadowBlur: 10
}
},
axisLine: {
lineStyle: {
color: 'rgba(255, 255, 255, 0.5)'
}
},
splitLine: {
lineStyle: {
color: 'rgba(255, 255, 255, 0.5)'
}
}
},
{
indicator: [
{ text: '语文', max: 150 },
{ text: '数学', max: 150 },
{ text: '英语', max: 150 },
{ text: '物理', max: 120 },
{ text: '化学', max: 108 },
{ text: '生物', max: 72 }
],
center: ['75%', '50%'],
radius: 120
}
],
series: [
{
name: '雷达图',
type: 'radar',
itemStyle: {
emphasis: {
// color: 各异,
lineStyle: {
width: 4
}
}
},
data: [
{
value: [100, 8, 0.40, -80, 2000],
name: '图一',
symbol: 'rect',
symbolSize: 5,
lineStyle: {
normal: {
type: 'dashed'
}
}
},
{
value: [60, 5, 0.30, -100, 1500],
name: '图二',
areaStyle: {
normal: {
color: 'rgba(255, 255, 255, 0.5)'
}
}
}
]
},
{
name: '成绩单',
type: 'radar',
radarIndex: 1,
data: [
{
value: [120, 118, 130, 100, 99, 70],
name: '张三',
label: {
normal: {
show: true,
formatter:function(params) {
return params.value;
}
}
}
},
{
value: [90, 113, 140, 30, 70, 60],
name: '李四',
areaStyle: {
normal: {
opacity: 0.9,
color: new echarts.graphic.RadialGradient(0.5, 0.5, 1, [
{
color: '#B8D3E4',
offset: 0
},
{
color: '#72ACD1',
offset: 1
}
])
}
}
}
]
}
]
}
```
### Other comments [其他信息]
<!-- For example: Screenshot or Online demo -->
<!-- [例如,截图或线上实例 (JSFiddle/JSBin/Codepen)] -->
----------------------------------------------------------------
This is an automated message from the Apache Git Service.
To respond to the message, please log on GitHub and use the
URL above to go to the specific comment.
For queries about this service, please contact Infrastructure at:
users@infra.apache.org
With regards,
Apache Git Services
---------------------------------------------------------------------
To unsubscribe, e-mail: dev-unsubscribe@echarts.apache.org
For additional commands, e-mail: dev-help@echarts.apache.org