You are viewing a plain text version of this content. The canonical link for it is here.
Posted to commits@echarts.apache.org by GitBox <gi...@apache.org> on 2021/11/11 19:14:12 UTC
[GitHub] [echarts] yousefwalid opened a new issue #16056: Add the ability to add different colors in different segments to a single specific series
yousefwalid opened a new issue #16056:
URL: https://github.com/apache/echarts/issues/16056


   ### What problem does this feature solve?
   There is no way to give multiple colors to a single series, The expected behavior is something similar to VisualMap, but for a single series instead of the whole chart.

   ### What does the proposed API look like?
   Add an object inside the series options to add a visualMap option on it
   something like
   ```js
   {
     visualMap: {
       ...
     }
   }
   ```

   Or some other way to provide the same functionality such as adding colors per series data points.

   <!-- This issue is generated by echarts-issue-helper. DO NOT REMOVE -->
   <!-- This issue is in English. DO NOT REMOVE -->


--
This is an automated message from the Apache Git Service.
To respond to the message, please log on to GitHub and use the
URL above to go to the specific comment.

To unsubscribe, e-mail: commits-unsubscribe@echarts.apache.org

For queries about this service, please contact Infrastructure at:
users@infra.apache.org


---------------------------------------------------------------------
To unsubscribe, e-mail: commits-unsubscribe@echarts.apache.org
For additional commands, e-mail: commits-help@echarts.apache.org
[GitHub] [echarts] pissang commented on issue #16056: Add the ability to add different colors in different segments to a single specific series
Posted by GitBox <gi...@apache.org>.
pissang commented on issue #16056:
URL: https://github.com/apache/echarts/issues/16056#issuecomment-966780267


   I'm not sure what strategy are you using. A better way is group your line segments by colors. For example:

   ```ts
   series: colorStrategies.map(colorStrategy => {
     return data.map(item => {
        return checkIfUseThisColor(item, colorStrategy)
              ? colorStrategy.color
              : '-' // Not display this data item.
     })
   });
   ```


--
This is an automated message from the Apache Git Service.
To respond to the message, please log on to GitHub and use the
URL above to go to the specific comment.

To unsubscribe, e-mail: commits-unsubscribe@echarts.apache.org

For queries about this service, please contact Infrastructure at:
users@infra.apache.org


---------------------------------------------------------------------
To unsubscribe, e-mail: commits-unsubscribe@echarts.apache.org
For additional commands, e-mail: commits-help@echarts.apache.org
[GitHub] [echarts] yousefwalid commented on issue #16056: Add the ability to add different colors in different segments to a single specific series
Posted by GitBox <gi...@apache.org>.
yousefwalid commented on issue #16056:
URL: https://github.com/apache/echarts/issues/16056#issuecomment-966915208


   @pissang Thanks for this! I'll try it
   One concern here is performance, I'll be using this on a chart with a huge number of series.
   Is this going to be performant? (I'll try it anyways just to be sure, but just asking if there is a more performant way)


--
This is an automated message from the Apache Git Service.
To respond to the message, please log on to GitHub and use the
URL above to go to the specific comment.

To unsubscribe, e-mail: commits-unsubscribe@echarts.apache.org

For queries about this service, please contact Infrastructure at:
users@infra.apache.org


---------------------------------------------------------------------
To unsubscribe, e-mail: commits-unsubscribe@echarts.apache.org
For additional commands, e-mail: commits-help@echarts.apache.org
[GitHub] [echarts] pissang commented on issue #16056: Add the ability to add different colors in different segments to a single specific series
Posted by GitBox <gi...@apache.org>.
pissang commented on issue #16056:
URL: https://github.com/apache/echarts/issues/16056#issuecomment-966944545


   Custom series can display thousands of data in realtime. But for more data like more than ten thousands. It may turn on progressive rendering automatically to avoid long rendering time freeze the page.

   Here is an example rendering 65k line segments in the custom series with progressive rendering.
   https://echarts.apache.org/examples/en/editor.html?c=custom-wind


--
This is an automated message from the Apache Git Service.
To respond to the message, please log on to GitHub and use the
URL above to go to the specific comment.

To unsubscribe, e-mail: commits-unsubscribe@echarts.apache.org

For queries about this service, please contact Infrastructure at:
users@infra.apache.org


---------------------------------------------------------------------
To unsubscribe, e-mail: commits-unsubscribe@echarts.apache.org
For additional commands, e-mail: commits-help@echarts.apache.org
[GitHub] [echarts] echarts-bot[bot] commented on issue #16056: Add the ability to add different colors in different segments to a single specific series
Posted by GitBox <gi...@apache.org>.
echarts-bot[bot] commented on issue #16056:
URL: https://github.com/apache/echarts/issues/16056#issuecomment-966557647


   Hi! We've received your issue and please be patient to get responded. 🎉
   The average response time is expected to be within one day for weekdays.

   In the meanwhile, please make sure that it contains **a minimum reproducible demo** and necessary **images** to illustrate. Otherwise, our committers will ask you to do so.

   *A minimum reproducible demo* should contain as little data and components as possible but can still illustrate your problem. This is the best way for us to reproduce it and solve the problem faster.

   You may also check out the [API](https://echarts.apache.org/api.html) and [chart option](https://echarts.apache.org/option.html) to get the answer.

   If you don't get helped for a long time (over a week) or have an urgent question to ask, you may also send an email to dev@echarts.apache.org. Please attach the issue link if it's a technical question.

   If you are interested in the project, you may also subscribe to our [mailing list](https://echarts.apache.org/maillist.html).

   Have a nice day! 🍵


--
This is an automated message from the Apache Git Service.
To respond to the message, please log on to GitHub and use the
URL above to go to the specific comment.

To unsubscribe, e-mail: commits-unsubscribe@echarts.apache.org

For queries about this service, please contact Infrastructure at:
users@infra.apache.org


---------------------------------------------------------------------
To unsubscribe, e-mail: commits-unsubscribe@echarts.apache.org
For additional commands, e-mail: commits-help@echarts.apache.org
[GitHub] [echarts] pissang edited a comment on issue #16056: Add the ability to add different colors in different segments to a single specific series
Posted by GitBox <gi...@apache.org>.
pissang edited a comment on issue #16056:
URL: https://github.com/apache/echarts/issues/16056#issuecomment-966911777


   Thanks for the explain. Perhaps you can try using the custom series to render these line segments.

   ```ts
   option = {
     xAxis: {
     },
     yAxis: {},
     series: [
       {
         type: 'custom',
         renderItem: function (params, api) {
           var start = api.coord([api.value(0), api.value(1)]);
           var end = api.coord([api.value(2), api.value(3)]);

           return {
             type: 'line',
             shape: {
               x1: start[0],
               y1: start[1],
               x2: end[0],
               y2: end[1]
             },
             style: {
               lineWidth: 2,
               stroke: api.visual('color')
             }
           };
         },
         label: {
           show: true,
           position: 'top'
         },
         dimensions: ['x1', 'y1', 'x2', 'y2'],
         encode: {
           x: [0, 1],
           y: [2, 3]
         },
         data: [
           { value: [1, 1, 2, 3], itemStyle: { color: 'red'} },
           { value: [2, 3, 4, 5], itemStyle: { color: 'green'} },
           { value: [4, 5, 5, 10] }
         ]
       }
     ]
   };
   ```

   But you need to process your data a bit to give the start and end point for each segment.


--
This is an automated message from the Apache Git Service.
To respond to the message, please log on to GitHub and use the
URL above to go to the specific comment.

To unsubscribe, e-mail: commits-unsubscribe@echarts.apache.org

For queries about this service, please contact Infrastructure at:
users@infra.apache.org


---------------------------------------------------------------------
To unsubscribe, e-mail: commits-unsubscribe@echarts.apache.org
For additional commands, e-mail: commits-help@echarts.apache.org
[GitHub] [echarts] pissang edited a comment on issue #16056: Add the ability to add different colors in different segments to a single specific series
Posted by GitBox <gi...@apache.org>.
pissang edited a comment on issue #16056:
URL: https://github.com/apache/echarts/issues/16056#issuecomment-966904064


   I'm still not sure what you want is give each data item a specific color or give data items in range a specific color?


--
This is an automated message from the Apache Git Service.
To respond to the message, please log on to GitHub and use the
URL above to go to the specific comment.

To unsubscribe, e-mail: commits-unsubscribe@echarts.apache.org

For queries about this service, please contact Infrastructure at:
users@infra.apache.org


---------------------------------------------------------------------
To unsubscribe, e-mail: commits-unsubscribe@echarts.apache.org
For additional commands, e-mail: commits-help@echarts.apache.org
[GitHub] [echarts] yousefwalid commented on issue #16056: Add the ability to add different colors in different segments to a single specific series
Posted by GitBox <gi...@apache.org>.
yousefwalid commented on issue #16056:
URL: https://github.com/apache/echarts/issues/16056#issuecomment-966906319


   @pissang Each line 'segment', for example, here:
   line from [1,1] to [2,3] is in green,
   line from [2,3] to [4,5] is in red,
   line from [4,5] to [5,10] is in green.

   While only have one series.


--
This is an automated message from the Apache Git Service.
To respond to the message, please log on to GitHub and use the
URL above to go to the specific comment.

To unsubscribe, e-mail: commits-unsubscribe@echarts.apache.org

For queries about this service, please contact Infrastructure at:
users@infra.apache.org


---------------------------------------------------------------------
To unsubscribe, e-mail: commits-unsubscribe@echarts.apache.org
For additional commands, e-mail: commits-help@echarts.apache.org
[GitHub] [echarts] pissang edited a comment on issue #16056: Add the ability to add different colors in different segments to a single specific series
Posted by GitBox <gi...@apache.org>.
pissang edited a comment on issue #16056:
URL: https://github.com/apache/echarts/issues/16056#issuecomment-966911777


   Thanks for the explain. Perhaps you can try using the custom series to render these line segments.

   ```ts
   option = {
     xAxis: {
     },
     yAxis: {},
     series: [
       {
         type: 'custom',
         renderItem: function (params, api) {
           var start = api.coord([api.value(0), api.value(1)]);
           var end = api.coord([api.value(2), api.value(3)]);

           return {
             type: 'line',
             shape: {
               x1: start[0],
               y1: start[1],
               x2: end[0],
               y2: end[1]
             },
             style: {
               lineWidth: 2,
               stroke: api.visual('color')
             }
           };
         },
         dimensions: ['x1', 'y1', 'x2', 'y2'],
         encode: {
           x: [0, 1],
           y: [2, 3]
         },
         data: [
           { value: [1, 1, 2, 3], itemStyle: { color: 'red'} },
           { value: [2, 3, 4, 5], itemStyle: { color: 'green'} },
           { value: [4, 5, 5, 10] }
         ]
       }
     ]
   };
   ```

   But you need to process your data a bit to give the start and end point for each segment.


--
This is an automated message from the Apache Git Service.
To respond to the message, please log on to GitHub and use the
URL above to go to the specific comment.

To unsubscribe, e-mail: commits-unsubscribe@echarts.apache.org

For queries about this service, please contact Infrastructure at:
users@infra.apache.org


---------------------------------------------------------------------
To unsubscribe, e-mail: commits-unsubscribe@echarts.apache.org
For additional commands, e-mail: commits-help@echarts.apache.org
[GitHub] [echarts] pissang commented on issue #16056: Add the ability to add different colors in different segments to a single specific series
Posted by GitBox <gi...@apache.org>.
pissang commented on issue #16056:
URL: https://github.com/apache/echarts/issues/16056#issuecomment-966911777


   Thanks for the explain. Perhaps you can try using custom series to render these line segments.

   ```ts
   option = {
     xAxis: {
     },
     yAxis: {},
     series: [
       {
         type: 'custom',
         renderItem: function (params, api) {
           var start = api.coord([api.value(0), api.value(1)]);
           var end = api.coord([api.value(2), api.value(3)]);

           return {
             type: 'line',
             shape: {
               x1: start[0],
               y1: start[1],
               x2: end[0],
               y2: end[1]
             },
             style: {
               lineWidth: 2,
               stroke: api.visual('color')
             }
           };
         },
         label: {
           show: true,
           position: 'top'
         },
         dimensions: ['x1', 'y1', 'x2', 'y2'],
         encode: {
           x: [0, 1],
           y: [2, 3]
         },
         data: [
           { value: [1, 1, 2, 3], itemStyle: { color: 'red'} },
           { value: [2, 3, 4, 5], itemStyle: { color: 'green'} },
           { value: [4, 5, 5, 10] }
         ]
       }
     ]
   };
   ```

   But you need to process your data a bit to give the start and end point for each segment.


--
This is an automated message from the Apache Git Service.
To respond to the message, please log on to GitHub and use the
URL above to go to the specific comment.

To unsubscribe, e-mail: commits-unsubscribe@echarts.apache.org

For queries about this service, please contact Infrastructure at:
users@infra.apache.org


---------------------------------------------------------------------
To unsubscribe, e-mail: commits-unsubscribe@echarts.apache.org
For additional commands, e-mail: commits-help@echarts.apache.org
[GitHub] [echarts] yousefwalid edited a comment on issue #16056: Add the ability to add different colors in different segments to a single specific series
Posted by GitBox <gi...@apache.org>.
yousefwalid edited a comment on issue #16056:
URL: https://github.com/apache/echarts/issues/16056#issuecomment-966906319


   @pissang Each line 'segment', for example, here:
   line from [1,1] to [2,3] is in green,
   line from [2,3] to [4,5] is in red,
   line from [4,5] to [5,10] is in green.

   While only have one series.

   --
   In my previous answer
   ```js
   series: [
           {
               data: [
                   {
                       value: [1,1],
                       lineStyle: {
                           color: 'green'
                       }
                   },
   ...
   ```
   simply means 'the line segment branched out of [1,1] is green'.
   The interface is just as an example, it is not strict


--
This is an automated message from the Apache Git Service.
To respond to the message, please log on to GitHub and use the
URL above to go to the specific comment.

To unsubscribe, e-mail: commits-unsubscribe@echarts.apache.org

For queries about this service, please contact Infrastructure at:
users@infra.apache.org


---------------------------------------------------------------------
To unsubscribe, e-mail: commits-unsubscribe@echarts.apache.org
For additional commands, e-mail: commits-help@echarts.apache.org
[GitHub] [echarts] pissang edited a comment on issue #16056: Add the ability to add different colors in different segments to a single specific series
Posted by GitBox <gi...@apache.org>.
pissang edited a comment on issue #16056:
URL: https://github.com/apache/echarts/issues/16056#issuecomment-966944545


   Custom series can display thousands of data in realtime. But for more data, like more than ten thousands. It may turn on progressive rendering automatically to avoid long rendering time freeze the page.

   Here is an example rendering 65k line segments in the custom series with progressive rendering.
   https://echarts.apache.org/examples/en/editor.html?c=custom-wind


--
This is an automated message from the Apache Git Service.
To respond to the message, please log on to GitHub and use the
URL above to go to the specific comment.

To unsubscribe, e-mail: commits-unsubscribe@echarts.apache.org

For queries about this service, please contact Infrastructure at:
users@infra.apache.org


---------------------------------------------------------------------
To unsubscribe, e-mail: commits-unsubscribe@echarts.apache.org
For additional commands, e-mail: commits-help@echarts.apache.org
[GitHub] [echarts] yousefwalid commented on issue #16056: Add the ability to add different colors in different segments to a single specific series
Posted by GitBox <gi...@apache.org>.
yousefwalid commented on issue #16056:
URL: https://github.com/apache/echarts/issues/16056#issuecomment-966880970
@pissang I don't think this is relevant to my request
Let me clarify the problem here a bit.
--
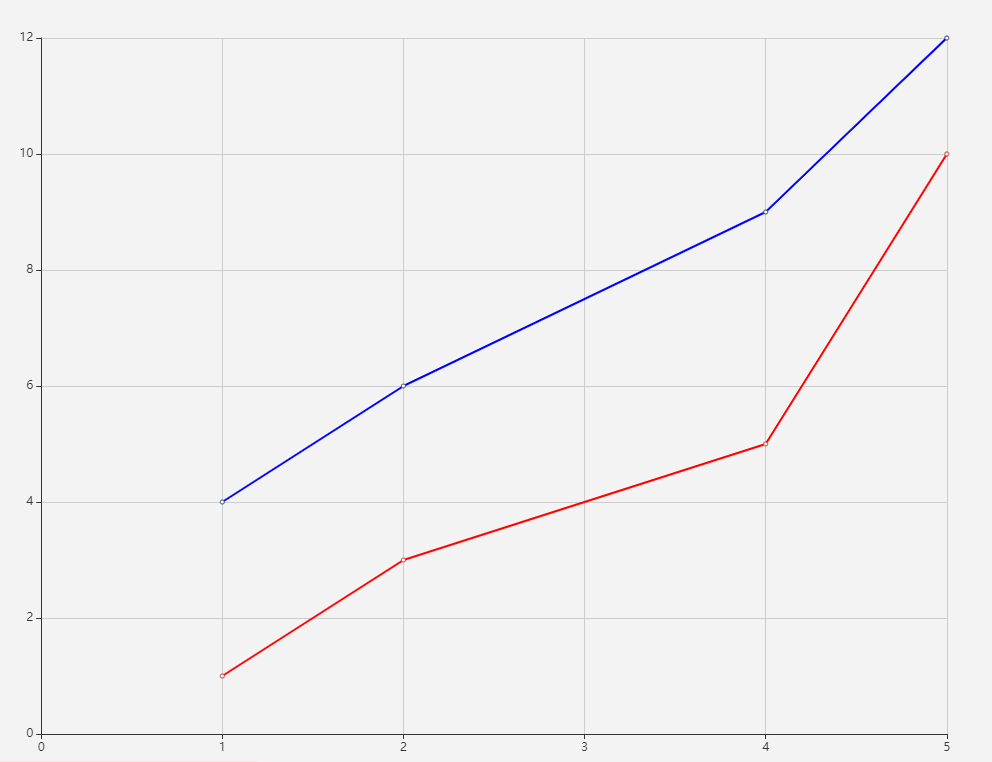
Assume we have this chart
```js
option = {
xAxis: {
type: 'value',
},
yAxis: {
type: 'value'
},
series: [
{
data: [[1,1], [2,3], [4,5], [5,10]],
type: 'line',
lineStyle: {
color: 'red'
}
},
{
data: [[1,4], [2,6], [4,9], [5,12]],
type: 'line',
lineStyle: {
color: 'blue'
}
}
]
};
```
This produces this output, where there is one series with red line color and another series with blue line color
The behavior I want to produce is allowing to change the color of each section of the line, so for instance, something like this:
```js
option = {
xAxis: {
type: 'value',
},
yAxis: {
type: 'value'
},
series: [
{
data: [
{
value: [1,1],
lineStyle: {
color: 'green'
}
},
{
value: [2,3],
lineStyle: {
color: 'red'
}
},
{
value: [4,5],
lineStyle: {
color: 'green'
}
},
{
value: [5,10]
}
],
type: 'line'
},
{
data: [[1,4], [2,6], [4,9], [5,12]],
type: 'line',
lineStyle: {
color: 'blue'
}
}
]
};
```
would produce the following chart
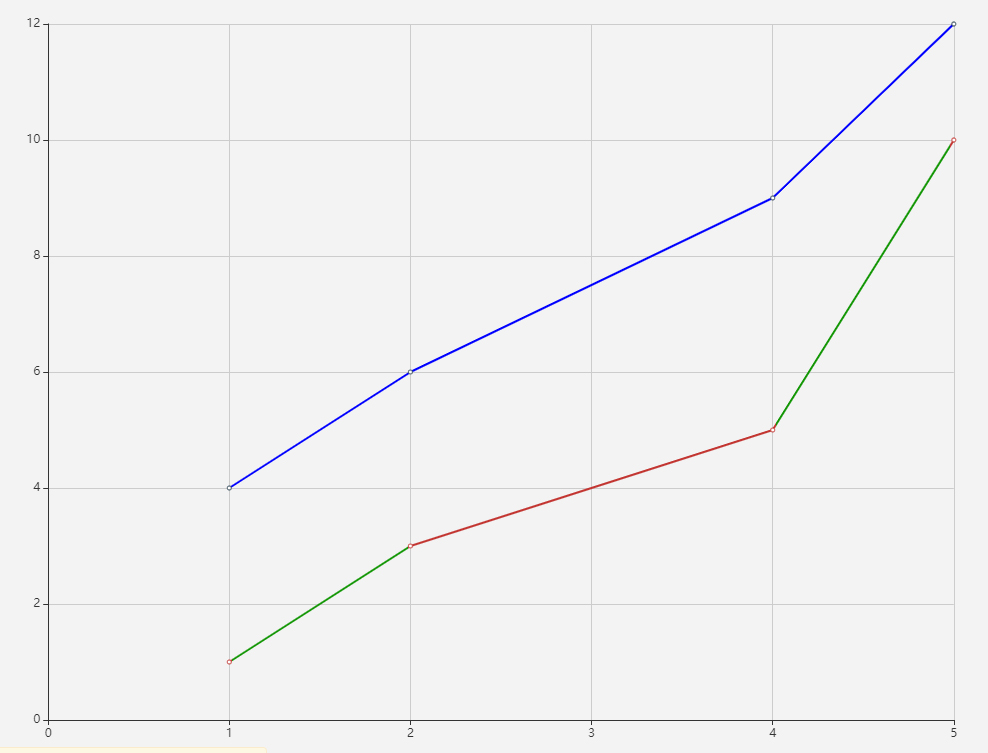
where one line has first section in green, second in red, third in green, but the other line is unaffected.
--
This is an automated message from the Apache Git Service.
To respond to the message, please log on to GitHub and use the
URL above to go to the specific comment.
To unsubscribe, e-mail: commits-unsubscribe@echarts.apache.org
For queries about this service, please contact Infrastructure at:
users@infra.apache.org
---------------------------------------------------------------------
To unsubscribe, e-mail: commits-unsubscribe@echarts.apache.org
For additional commands, e-mail: commits-help@echarts.apache.org
[GitHub] [echarts] pissang commented on issue #16056: Add the ability to add different colors in different segments to a single specific series
Posted by GitBox <gi...@apache.org>.
pissang commented on issue #16056:
URL: https://github.com/apache/echarts/issues/16056#issuecomment-966904064


   What you want is give each data item a specific color or give data items in range a specific color?


--
This is an automated message from the Apache Git Service.
To respond to the message, please log on to GitHub and use the
URL above to go to the specific comment.

To unsubscribe, e-mail: commits-unsubscribe@echarts.apache.org

For queries about this service, please contact Infrastructure at:
users@infra.apache.org


---------------------------------------------------------------------
To unsubscribe, e-mail: commits-unsubscribe@echarts.apache.org
For additional commands, e-mail: commits-help@echarts.apache.org