You are viewing a plain text version of this content. The canonical link for it is here.
Posted to commits@echarts.apache.org by GitBox <gi...@apache.org> on 2020/09/22 10:55:48 UTC
[GitHub] [incubator-echarts] msbasanth opened a new issue #13327: "Timeline Chart" (not timeline feature) for visualizing important events over a time axis
msbasanth opened a new issue #13327:
URL: https://github.com/apache/incubator-echarts/issues/13327
### What problem does this feature solve?
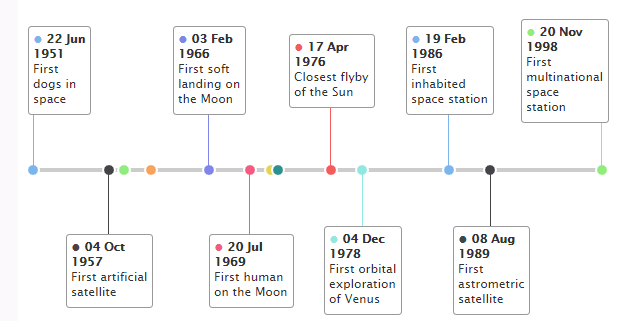
Currently I couldn't find a way to create a timeline chart for visualizing important events over a time span.
Charts with a Timeline series display every data point as a separate event along a horizontal or vertical line.
By placing events tied to a datetime axis, we should be able to show the exact time intervals between all points.
Please let me know whether I can achieve such a chart with the help of any existing chart type? This looks to be a standard usecase and good to have as a separate chart type.
### What does the proposed API look like?
You can find the sample here, https://jsfiddle.net/gh/get/library/pure/highcharts/highcharts/tree/master/samples/highcharts/series-timeline/datetime-axis
<!-- This issue is generated by echarts-issue-helper. DO NOT REMOVE -->
<!-- This issue is in English. DO NOT REMOVE -->
----------------------------------------------------------------
This is an automated message from the Apache Git Service.
To respond to the message, please log on to GitHub and use the
URL above to go to the specific comment.
For queries about this service, please contact Infrastructure at:
users@infra.apache.org
---------------------------------------------------------------------
To unsubscribe, e-mail: commits-unsubscribe@echarts.apache.org
For additional commands, e-mail: commits-help@echarts.apache.org
[GitHub] [incubator-echarts] echarts-bot[bot] commented on issue #13327: "Timeline Chart" (not timeline feature) for visualizing important events over a time axis
Posted by GitBox <gi...@apache.org>.
echarts-bot[bot] commented on issue #13327:
URL: https://github.com/apache/incubator-echarts/issues/13327#issuecomment-696648039


   Hi! We've received your issue and please be patient to get responded. 🎉
   The average response time is expected to be within one day for weekdays.

   In the meanwhile, please make sure that **you have posted enough image to demo your request**. You may also check out the [API](http://echarts.apache.org/api.html) and [chart option](http://echarts.apache.org/option.html) to get the answer.

   If you don't get helped for a long time (over a week) or have an urgent question to ask, you may also send an email to dev@echarts.apache.org. Please attach the issue link if it's a technical questions.

   If you are interested in the project, you may also subscribe our [mail list](https://echarts.apache.org/en/maillist.html).

   Have a nice day! 🍵


----------------------------------------------------------------
This is an automated message from the Apache Git Service.
To respond to the message, please log on to GitHub and use the
URL above to go to the specific comment.

For queries about this service, please contact Infrastructure at:
users@infra.apache.org


---------------------------------------------------------------------
To unsubscribe, e-mail: commits-unsubscribe@echarts.apache.org
For additional commands, e-mail: commits-help@echarts.apache.org